DOI:
10.1039/C5RA01967B
(Paper)
RSC Adv., 2015,
5, 35773-35782
Enhanced thermal properties in a hybrid graphene–alumina filler for epoxy composites†
Received
31st January 2015
, Accepted 13th April 2015
First published on 14th April 2015
Abstract
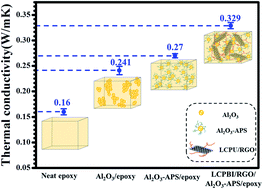
In this report, we synthesized a new kind of liquid-crystal perylenebisimide polyurethane (LCPBI). Noncovalently functionalized reduced graphene oxide (RGO) with LCPBI was prepared via π–π stacking interactions. The noncovalently functionalized graphene nanosheets (LCPBI/RGO) were used to improve the thermal properties of epoxy composites, with modified Al2O3 nanoparticles (Al2O3-APS) which were grafted with a silane coupling agent (KH-550). We demonstrated that the thermal conductivity of the epoxy composites could be improved by hybrid LCPBI/RGO and Al2O3-APS fillers. For instance, the thermal conductivity of the epoxy composite with 30 wt% Al2O3-APS and 0.3 wt% LCPBI/RGO was 0.329 W m−1 K−1, increased by 105.6% compared to that of the pure epoxy (0.16 W m−1 K−1). Meanwhile the glass transition temperature and storage modulus of epoxy composites with increasing hybrid fillers was improved, as well as the α-relaxation apparent activation energy.
1. Introduction
Epoxy resin (EP) is an important class of thermoset polymer, which is widely used in polymer composites owning to its excellent electrical insulation, chemical resistance, mechanical properties and low cost.1–4 When it comes to the thermal dispersion problem, these resins cannot meet the requirements in the aerospace electrical and electronic components due to their poor thermal conductivity and weak resistance to high temperature.5 Currently, aerospace devices are embedded with lots of electronics which generate considerable amounts of heat energy. This generated heat, if not dissipated on time, might potentially affect the structural integrity of the composite structure.6,7 A mass of studies have been conducted to improve the thermal conductivity of the epoxy composites using different types of fillers, such as silica, carbon tubes, clay silicates and graphene etc.8–10
Graphene is two-dimensional sp2-hybridized carbon honeycomb lattice structure material, which has attracted tremendous attention in the last decade, due to its unparalleled thermal, mechanical and electrical properties etc.11,12 Polymer composites with graphene have many potential applications in thermal management and electronics. However, there are two main factors limit the application of polymer composites with graphenes: (1) the poor dispersion of graphenes in polymeric matrixes; (2) the high cost of graphene nanofillers.13–16 On the other hand, the micro-scale inorganic fillers with high thermal conductivity are widely used as fillers in epoxy resins to improve the thermal conductivity of composites at relatively low cost, such as alumina, aluminum nitride and boron nitride etc. However, this micro-scale inorganic filled materials need high content (50–80 vol%) of powder to maximize the heat transfer pathways.5,17
As we know, thermal transport occurs through phonons or lattice vibrations.18 For these filled composites, the dispersion of nanofillers in the matrix and the interface interactions between nanofillers and matrix are two important factors affecting the heat transport pathways.9 In this study, we proposed an effective hybrid filler epoxy system consisted of Al2O3 nanoparticles modified by silane agents (Al2O3-APS) and noncovalently functionalized graphene nanosheets (LCPBI/RGO), aiming at enhancing the thermal properties of epoxy matrix at low cost and fillers content.17 The RGO were noncovalently functionalized with liquid-crystal perylenebisimides polyurethane (LCPBI) via π–π stacking interactions which improved the dispersion of graphene nanofillers in epoxy matrix based on our last work.19 Meanwhile, the Al2O3-APS nanoparticles filled into the interspace of LCPBI/RGO nanosheets, which generated bridge between LCPBI/RGO, thus resulted in an increased heat transfer pathway.15,19 The thermal conductivity, glass transition temperature and thermomechanical properties of epoxy composites with hybrid fillers were systematically studied in this work, as well as the dispersion of hybrid fillers and the interface interactions between hybrid fillers and epoxy matrix.
2. Experimental
2.1. Materials
Nature flake graphite (325 mesh, 99%) was provided by Hengrui Graphite Co., Ltd. (Qingdao, China). 3,4,9,10-Perylenetetracarboxylic anhydride (PTCDA), monoethanolamine (MEA) and γ-aminopropyltriethoxysilane (γ-APS) were obtained from Xiya Chemical Reagent Co., Ltd. (Chengdu, China). Zinc acetate and 4,4′-diaminodiphenylsulphone (DDS) were purchased from Aladdin Chemistry Co., Ltd. (Shanghai, China). H2SO4 (98%), HCl (36%), H2O2 (30%), KMnO4, P2O5 and K2S2O8 were purchased from Sinopharm Chemical Reagent Co., Ltd. (Shanghai, China). N,N′-dimethylformamide (DMF), N-methyl-2-pyrrolidone (NMP), polyethylene glycol-1000 (PEG-1000), dibutyltindilaurate, chloroform, 2,4-tolylene diisocyanate (TDI) and dimethylbenzene were obtained from Jin hua du Chemical Reagent Co., Ltd. (Guangzhou, China). The diameter of Al2O3 particles was about 30 nm and supplied by Kaier nano science and technology Co., Ltd. (Hefei, China). The epoxy resin used in this study is diglycidylether of bisphenol A (DGEBA, E-51, epoxy value = 0.51 and viscosity value = 12 Pa s at 25 °C) supplied by Yueyang Chemical Plant (Yueyang, China). Deionized (D.I.) water was used in all the process of aqueous solution preparations and washings.
2.2. Synthesis of liquid crystal perylenebisimides polyurethane (LCPBI)
The N,N′-(ethanolamine)perylene-3,4,9,10-tetracarboxylic acid diimide (PDI) was prepared according to the literature.20,21 Briefly, the PTCDA (1000 mg, 2.55 mmol) and MEA (280 mg, 4.58 mmol) were added in a 250 ml three-necked flask with zinc acetate (250 mg, 1.36 mmol) as catalyst and NMP (70 ml) as solvent, then keep the temperature at 165 °C for 12 h under nitrogen atmosphere. After the reaction, cooled the solution to room temperature and precipitated it in anhydrous ethanol. Collected the precipitate by filtration and washed with plenty of anhydrous ethanol. The resulting PDI was isolated in 79.3% yield as a chocolate solid then dried in a vacuum oven at 60 °C for 12 h.
240 mg (0.5 mmol) as-prepared PDI were dissolved in 40 ml DMF in a 100 ml three-neck flask. Then 192 mg (1.1 mmol) TDI and 50 mg dibutyltindilaurate as catalyst were added in the reaction mixture. The reaction system was kept at 60 °C for 6 h under a nitrogen atmosphere. Then added 110 mg (1.1 mmol) PEG-1000 in the reaction mixture and heated to 90 °C for 8 h. At the end, this reaction mixture was poured into plenty of D.I. water. The solid was separated by filtration, washed and vacuum dried in a vacuum oven at 60 °C for overnight. The resulting purplish red solid (LCPBI) was obtained.19 The synthetic route is shown in Scheme 1.
 |
| Scheme 1 The preparation process of the LCPBI. | |
2.3. Synthesis of LCPBI-functionalized reduced graphene oxide (LCPBI/RGO)
Firstly, the graphene oxide (GO) was prepared according to the modified Hummers method, then the reduced graphene oxide (RGO) was obtained by thermal annealing of GO to 1100 °C at a heating rate of 2 °C min−1 under a 3% H2/Ar stream over a 12 h period.3,19,22 After that, 500 mg RGO dispersed in 20 ml chloroform solution under sonication for 30 min. And then, 500 mg LCPBI were added, followed by other 30 min of sonication. The weight ratio of LCPBI to RGO was 1
:
1. The atropurpureus suspension was centrifuged at 8000 rpm to obtain the LCPBI/RGO. Then the resultant LCPBI/RGO were dispersed in chloroform solution and centrifuged again to ensure completely removal the free LCPBI.23,24 The synthetic route is shown in Scheme 2.
 |
| Scheme 2 The preparation process of the LCPBI/RGO. | |
2.4. Synthesis of Al2O3 grafted silane coupling agent (Al2O3-APS)
3 g of Al2O3 nanoparticles and appropriate amount of the γ-APS (0.5–1 wt% based on the weight of nanofillers) were added into a 500 ml three-necked flask, equipped with a mechanical stirrer and a reflux condenser, and mixed in high purity dimethylbenzene by stirring at 110–120 °C for at least 4 h. After filtration, the γ-APS treated Al2O3 nanoparticles (Al2O3-APS) was washed several times with dimethylbenzene to remove the unreacted siloxane moieties and dried in a vacuum oven at 120 °C for 2 h to remove the residual solvent.5,25 The proposed reaction scheme for γ-APS modification process on the surface of Al2O3 nanoparticles is illustrated in Scheme 3.26,27
 |
| Scheme 3 Schematic illustration of γ-APS modification process on the Al2O3 nanoparticle surface. | |
2.5. Preparation of epoxy composites
The pure epoxy was prepared by mixing epoxy resin (E-51) with stoichiometric amounts of curing agent DDS (30 phr of epoxy resin, and epoxy resin for 100 phr) through ultrasonication for 0.5 h and vigorous stirred for 10 min to get homogeneous mixture. Then the mixture was poured into preheated mould. Lastly eliminated the entrapped air in a vacuum oven at 100 °C for 0.5 h and cured by the following cycle, 140 °C for 2 h, 160 °C for 2 h and 180 °C for 2 h. For the LCPBI/RGO/Al2O3-APS/epoxy composites, stoichiometric amounts of LCPBI/RGO nanosheets (0.3 phr of epoxy resin) and appropriate amount of Al2O3-APS nanoparticles (5, 10, 15, 20, 25, 30 phr of LCPBI/RGO, respectively) were dispersed in anhydrous ethanol firstly. Then the preheated epoxy was added to the LCPBI/RGO/Al2O3-APS solution. The mixture was ultrasonicated for 2 h at 80 °C. Then the mixture was placed in a vacuum oven at 100 °C for 2 h to eliminate the entrapped air and to remove the residual ethanol. After that the curing agent was added to the mixture under high speed shear mixing for 10 min at 2000 rpm. Then the hybrid fillers/epoxy slurry was poured into preheated mould. The mixture was again placed in a vacuum oven to degas for 1 h. The curing cycle of the LCPBI/RGO/Al2O3-APS/epoxy composites was the same as the pure epoxy. At the same time, the Al2O3-APS/epoxy composites and the Al2O3/epoxy composites were prepared as well as this method without added the LCPBI/RGO nanosheets.3,4,19,28 The experimental details of the synthesis of the epoxy composites are shown in Scheme 4.
 |
| Scheme 4 The preparation process of epoxy composites with different nanofillers. | |
2.6. Characterization
Fourier-transform infrared spectra (FT-IR) were recorded on a Perkin-Elmer 1710 spectrophotometer at room temperature. The frequency range of FT-IR was 4000–500 cm−1, using KBr pellets. Transmission electron microscopy (TEM) images were obtained from a JEOL JEM-2100 instrument operated at an accelerating voltage at 200 kV. The RGO and LCPBI/RGO samples were prepared by dropping the sample ethanol solutions onto holey carbon-coated copper grids and air-dried before measurement. Thermogravimetric analysis (TGA) of the samples with 2.5 mg were conducted on NETZSCH STA- 449 at a heating rate of 10 °C min−1 under nitrogen. X-ray photoelectron spectra (XPS) of the surfaces of nanoparticles were recorded by means of a Vacuum Generators Escalb MK II X-ray photoelectron spectrometer with a resolution of 0.8 eV at 240 W (Mg Kα 12 kV). Thermal conductivities of the composites were measured with UNITHERMTM MODEL 2022 (ANTER, USA) according to ASTM E1461, using the measured heat capacity and thermal diffusivity, with separately entered density data. Samples were prepared in square shape of 25.4 mm in length and 1.0–2.0 mm in thickness. Differential scanning calorimetry (DSC-204, NETZSCH, Germany) were performed at temperature from 30 to 250 °C at heating rate of 10 °C min−1. All tests were performed in a nitrogen atmosphere with a sample weight of about 8 mg. The fracture surfaces of the specimens were investigated using field emission scanning electron microscopy (FE-SEM, JSM-6701F, Japan) at an accelerating voltage of 20 kV, and the fracture surfaces were coated with sputter-gold to improve the conductivity. Dynamic mechanical analysis (DMA) was performed on a DMA Q800 dynamic mechanical analyzer (TA Instruments, USA) to determine the thermomechanical properties of composites. The tests were carried out in the single cantilever mode in multifrequency pattern at 0.1, 1, 5 and 10 Hz frequency from 40 to 250 °C at a heating rate of 1 °C min−1. Mechanical properties of the composites were evaluated by impact, tensile and flexural measurements. Izod impact strength was measured on a tester of type XJJ-5, which is with no notch in the specimen according to National Standard of China (GB1043-79). The experiments were carried out on cubic samples (80 × 10 × 4 mm). The tensile strength was examined on a universal tensile tester of type RGT-5 according to National Standard of China (GB1040-92). The tensile rate was 2 mm min−1. Flexural tests were performed according to WDW-20 (Shenzhen Jun Red Instrument Equipment Co., Ltd, China) using a three-point bending mode of the universal testing machine with a crosshead speed of 2 mm min−1. The conditions of the tests and the specimens conformed to GB1449-2005. All the results are the average value of five specimens.
3. Results and discussion
3.1. Characterization of the nanofillers
The left of Scheme 4 shows the dispersion of Al2O3, Al2O3-APS, RGO, LCPBI/RGO and LCPBI/RGO/Al2O3-APS in ethanol. These photographs were taken after 1 day of storage at room temperature. As we can see, both of the Al2O3 and RGO are easily deposited to the bottom, while the Al2O3-APS, LCPBI/RGO and LCPBI/RGO/Al2O3-APS exhibited better colloidal stability in ethanol. In general, the dispersion of nanofillers in solvent was affected by the particle–particle or sheet–sheet interactions and particle–solvent or sheet–solvent interactions.29 There was obvious precipitation in the RGO suspension, due to its 2-D plane structures and large specific surface area.30 Meantime, distinct agglomerates were also observed in the Al2O3 nanoparticles suspension for its large specific surface area. But the Al2O3-APS, LCPBI/RGO and LCPBI/RGO/Al2O3-APS suspensions exhibited visually homogeneous solutions, which indicated that modified Al2O3 nanoparticles effectively prevented the aggregation between the particles, the long and tortuous liquid-crystal perylenebisimides polyurethane inhibited the stacking of noncovalently functionalized graphene nanosheets resulted in good colloidal stability.31 And for the LCPBI/RGO/Al2O3-APS suspensions, we found a steric and electrostatic stabilization existed between LCPBI/RGO nanosheets and Al2O3-APS nanoparticles in ethanol solvent.
Fig. 1 shows the FTIR spectra of the nanofillers. For the LCPBI, the strong absorption appears at 3420 cm−1 indicating the presence of the stretching vibration band of N–H band in the diimide groups. The bands at the 2930 and 2860 cm−1 are due to the stretching vibration of –CH2– band. The band at 1650 cm−1 is assigned to the C
O stretching vibration of diimide groups. And the band at 1060 cm−1 corresponds to the C–O stretching vibration of ether groups. The spectrum of the LCPBI/RGO is very similar to that of the LCPBI, but there are some differences between them. The absorption bands corresponding to the N–H band is 3428 cm−1. And the –CH2– band is presented at 2997, 2922 and 1394 cm−1 in the spectrum of the LCPBI/RGO. Compared with the spectrum of the LCPBI, LCPBI/RGO appeared high frequency infrared absorption peak mobile phenomenon. This phenomenon is due to the presence of π–π conjugation between LCPBI and RGO.32 Fig. 1 also shows the FTIR spectra of the Al2O3 and Al2O3-APS. For the Al2O3, the strong absorption appears at 3473 cm−1 due to the stretching vibration of –OH band. And the absorption at the 1629 cm−1 corresponds to the bending vibration of –OH, which indicated the Al2O3 nanoparticles easy to absorb water molecules. The spectrum of the Al2O3-APS is similar to Al2O3 curve, the absorption at 3473 and 1629 cm−1 are assigned to the –OH band. While the absorption appear at 2923 and 2853 cm−1 corresponding to stretching vibration of –CH2 band and 1222 cm−1 owning to the stretching vibration of C–N band. It shows that the silane coupling agents have been grafted on the surface of Al2O3 nanoparticles.5
 |
| Fig. 1 FT-IR spectra of LCPBI, LCPBI/RGO, Al2O3 and Al2O3-APS. | |
The XPS spectra are employed to investigate π–π stacking interactions between LCPBI and RGO. Fig. 2(a–c) provides the survey spectra of RGO, LCPBI and LCPBI/RGO from 0 to 1250 eV. Fig. 2(d–f) show C1s, O1s and N1s XPS spectra of RGO, LCPBI and LCPBI/RGO, respectively. Notable peaks are observed at binding energy of 285 and 533 eV, corresponding to C1s and O1s, respectively, while slight reflection at 400 eV is assigned to N1s. As we can see, in Fig. 2(a), a slight O1s peak is observed, indicating there is still some C–O in RGO. It is also proved in Fig. 2(d), the peak at 286.5 eV owned to C–O. The C1s of LCPBI/RGO shift to 283.49 eV compare with LCPBI (283.8 eV), due to the π–π stacking interactions bring more nonoxygenated ring C from RGO. The 287.8 eV is assigned to the form of C
O, in the C1s XPS spectra of LCPBI and LCPBI/RGO. In Fig. 2(e), for the peak at 530.62 eV is attributed to C–O–C in LCPBI curve, a shift was found in LCPBI/RGO curve, the peak moved to 531.24 eV for decreasing amount of C–O–C, which caused by stacking with RGO. We can find the same shift tendency in Fig. 2(f).33,34
 |
| Fig. 2 XPS spectra of (a) RGO, (b) LCPBI, (c) LCPBI/RGO, (d) C1s peaks, (e) O1s peaks, (f) N1s peaks. | |
Fig. 3 shows the TGA curves of nanofillers at a heating rate of 10 °C min−1 in N2. The thermal stability of these samples is determined by TGA considering the onset of thermal decomposition (Ti), i.e. the temperature corresponding to initial 10% of weight loss. From the Fig. 3(a), we can find that both of LCPBI and LCPBI/RGO are thermally stable with a high Ti nearly 300 °C, the Ti of LCPBI and LCPBI/RGO are 280 °C and 320 °C, respectively. The Ti of the LCPBI/RGO is 40 °C higher than that of LCPBI. As we can see, from 200 °C to 280 °C, there was a slight weight loss(less than 10 wt%) in LCPBI curve. As for LCPBI/RGO, although some degree weight loss can be found in temperature between 280 °C to 320 °C, the weight loss is lower than LCPBI, indicated the thermostability of LCPBI/RGO higher than LCPBI. On the basis of above analysis, it is noteworthy is that the LCPBI/RGO is thermostabilized during the epoxy composites preparation temperature (the highest temperature is 180 °C). Both their molecular forces and intermolecular forces, including π–π stacking interactions, are stabilized. And the residue yield of LCPBI and LCPBI/RGO calculated at 800 °C are ca. 25.66% and 58.57%, respectively.
 |
| Fig. 3 TGA curves of (a) LCPBI and LCPBI/RGO (b) Al2O3 and Al2O3-APS. | |
Fig. 3(b) shows the TGA curves of Al2O3 and Al2O3-APS. As we can see, for these two types of nanoparticles, two stages of weight loss could be observed. At low temperature range (<400 °C), the weight loss corresponds to the remove of water molecules and the hydroxyl groups from the nanoparticles. At the high temperature range from 400 to 800 °C, the weight loss owning to the decomposition of the grafted silane molecules. As it shown in Fig. 3(b), the weight loss of the Al2O3-APS nanoparticles is obviously higher than that of the Al2O3 nanoparticles, which indicated that silane molecules were successfully grafted onto the surface of the Al2O3 nanoparticles.5,35
Fig. 4 shows the TEM images of RGO and LCPBI/RGO nanosheets. It can be seen from Fig. 4(a) that the RGO are showing overlapping in some instances with a silk-like appearance. Corrugation and scrolling are the part of the intrinsic nature of RGO, which result from the fact of the two-dimensional membrane structure becoming thermodynamically stable via bending.36 The detail π–π stack between RGO and LCPBI are shown in the Fig. 4(b), it can be found some obvious LCPBI banding were attached to the RGO nanosheets via π–π stacking, indicating that the LCPBI have been coated on the surface of the RGO.
 |
| Fig. 4 TEM images of (a) RGO, (b) LCPBI/RGO. | |
The SEM images which obtained for the as received Al2O3 nanoparticles and Al2O3-APS nanoparticles powders are compared in Fig. 5(a) and (b). Comparison of SEM images Fig. 5(a) and (b) shows that silane treated Al2O3 nanoparticles display that the surface modification dramatically affects the aggregate particle size.37 Fig. 5(c) and (d) shows the XPS spectra of the Al2O3 and Al2O3-APS. Fig. 5(c) is the XPS spectra of Al2O3, there were three peaks in this XPS spectra, with binding energy at 531.1, 117.9 and 72.9 eV, attributed to O1s, Al2s and Al2p. In Fig. 5(d), the XPS spectra of Al2O3-APS, there were another four peaks compared to Fig. 5(c), with binding energy at 398.4, 285, 150.5 and 100.4 eV, attributed to N1s, C1s, Si2s and Si2p.38,39 It shows that the silane coupling agents have been grafted on the surface of Al2O3 nanoparticles, which is in agreement with the results of FTIR.
 |
| Fig. 5 SEM images of (a) Al2O3, (b) Al2O3-APS and XPS spectra of (c) Al2O3, (d) Al2O3-APS. | |
3.2. Morphology of composites
Fig. 6 shows SEM images of the fracture surfaces of the pure epoxy and its composites. Fig. 6(a–d) depicts the fracture surfaces of pure epoxy, 15 wt% Al2O3/epoxy, 15 wt% Al2O3-APS/epoxy and 15 wt% LCPBI/RGO/Al2O3-APS/epoxy composite, respectively. It can be observed from Fig. 6(a) that river patterns appear on the fracture surface and the smooth fracture surface regions can be observed. This is a typical brittle fracture for thermosetting polymer. Unlike the pure epoxy, the composites show a rough fracture surface due to the matrix shear yielding or local polymer deformation, as shown in Fig. 6(b–d). As we can observe, some tortuous, cracks and cavities appeared in the fracture surfaces of these composites. The fail manner of these composites may due to a crack deflection mechanism which caused by the nanofillers. For Fig. 6(b), the Al2O3 nanoparticle protruded from the fracture surface of the Al2O3/epoxy composite, revealing the weak interface interaction between matrix and Al2O3 nanoparticle. At the same time, some nanoparticle agglomerates are found in the SEM image. While the Al2O3-APS/epoxy and the LCPBI/RGO/Al2O3-APS/epoxy composites show a good dispersion and homogeneity on the fracture surface, as shown in the Fig. 6(c) and (d). In Fig. 6(c), there still some agglomerated nanoparticles protruded from the fracture surface of the Al2O3-APS/epoxy composite. While for Fig. 6(d), there are almost no obvious naked nanofillers and clusters present due to the high dispersion of LCPBI/RGO nanosheets and Al2O3-APS nanoparticles. These nanofillers are deep embedded in the epoxy matrix suggesting that covalent bonding are formed among the epoxide groups, hydroxy groups and amine groups.3,5,8,40
 |
| Fig. 6 SEM images of fracture surfaces of composites: (a) pure epoxy; (b) 15 wt% Al2O3/epoxy; (c) 15 wt% Al2O3-APS/epoxy; (d) 15 wt% LCPBI/RGO/Al2O3-APS/epoxy. | |
3.3. Thermal conductivity of epoxy composites
Fig. 7 depicts the thermal conductivity and thermal conductivity enhancement of pure epoxy and its composites with various filler contents. The thermal conductivity of the pure epoxy is 0.16 W m−1 K−1. And the thermal conductivities of composites with 0.3 wt% of LCPBI/RGO in the matrix is 0.192 W m−1 K−1. As shown in the Fig. 7, with the increment in the amount of Al2O3 nanoparticles, the thermal conductivity of these composites gradually improved. When the Al2O3 content was 30 wt%, the thermal conductivity reached its highest value at 0.241 W m−1 K−1 (with Al2O3 filler), 0.27 W m−1 K−1 (with Al2O3-APS filler), 0.329 W m−1 K−1 (with LCPBI/RGO/Al2O3-APS filler), respectively. As we can see, there is 105.6% improvement in the thermal conductivity of composite with loading 30 wt% Al2O3-APS and 0.3 wt% LCPBI/RGO, compared with that of the pure epoxy. While added 0.3 wt% LCPBI/RGO nanosheets without Al2O3-APS nanoparticles, there was only 20% improvement in the thermal conductivity. Meanwhile with only 30 wt% filler of Al2O3-APS nanoparticles the thermal conductivity was 68.8% improvement. We found the improvement of the thermal conductivity of LCPBI/RGO/Al2O3-APS/epoxy is not simply the result of Al2O3-APS plus LCPBI/RGO.
 |
| Fig. 7 (a) Thermal conductivity and (b) thermal conductivity enhancement of pure epoxy and its composites with various contents. | |
The high thermal conductivity of the LCPBI//RGO/Al2O3-APS/epoxy composites is due to the synergetic effect of Al2O3-APS and LCPBI/RGO in the epoxy matrix. It is known that the mode of thermal conduction in amorphous polymers is primarily phonons. In order to improve the overall thermal transport in amorphous polymeric systems, the acoustic impedance mismatch (a function of the acoustic speed and the density of the medium) at the interface between the fillers and the polymeric matrix has to be reduced.6 A model was proposed to present the efficient network for heat flow in the nanocomposite is shown in Fig. 8 The hybrid system of Al2O3-APS and LCPBI/RGO increased thermal conductivity by minimizing interfacial phonon scattering, which may be attributed to three reasons. First, the strong chemical bonds formed between the Al2O3-APS and epoxy matrix, which provided good interface compatibility, therefore may reduce the interfacial thermal resistance. Second, the LCPBI/RGO nanosheets and Al2O3-APS nanoparticles can disperse well in the epoxy matrix. Meanwhile the noncovalently functionalized graphene nanosheets with long and tortuous liquid-crystal polyurethane on its surface increased the path for phonon diffusion within hybrid nanofillers. Third, the Al2O3-APS nanoparticles filled into the interspace of LCPBI/RGO nanosheets, which generated bridge between LCPBI/RGO, thus resulted in an increased heat transfer pathway. Through the synergetic effect of Al2O3-APS and LCPBI/RGO, the thermal conductivity of the epoxy composites could be improved, compared with the pure epoxy.8,10,15,17
 |
| Fig. 8 The model of heat flow for composites (a) Al2O3/epoxy (b)Al2O3-APS/epoxy and(c) LCPBI//RGO/Al2O3-APS/epoxy. | |
3.4. Glass transition temperature of epoxy composites
Fig. 9 shows the change in Tg for the pure epoxy and LCPBI/RGO/Al2O3-APS/epoxy composites. It is known that the Tg of epoxy usually related to the crosslinking density of the resin matrix.41 The glass transition temperature occurs in a wide temperature range, since the degree of crosslinking in the epoxy matrix is not uniform. There are three characteristic temperatures in the DSC curves, the onset temperature, the intermediate temperature and the end temperature. Here the intermediate temperature is denoted as the glass transition temperature. As shown in Fig. 9, the Tg of pure epoxy is 178.4 °C. For the composite with only 0.3 wt% LCPBI/RGO nanofiller, the Tg is 182.5 °C. Meanwhile, the Tgs of the LCPBI/RGO/Al2O3-APS/epoxy composites with 10, 15, 20, 25, and 30 wt% hybrid fillers are 183.5, 184.2, 186.4, 187.5, and 189.1 °C, respectively. As mentioned above all LCPBI/RGO/Al2O3-APS/epoxy composites in our study were added 0.3 wt% LCPBI/RGO. As we can see, the Tg of the composite with only LCPBI/RGO nanofiller is lower than those with hybrid nanofillers. And the Tgs of the epoxy composites tended to higher temperature with the addition of LCPBI/RGO/Al2O3-APS. It can be attributed to three factors. First, LCPBI/RGO/Al2O3-APS nanofillers restricted polymer chains, thus which reduced the mobility of chains. It is believed that the nanofillers can act as physical interlock points in the cured organic matrix, which usually provided a sterically hindered surroundings for curing reactions of composites meanwhile restrained the mobility of chain. Second, the amino groups and hydroxy groups of the nanofillers can participate in the curing reaction, therefore the Al2O3-APS and LCPBI/RGO moleculars formed a strong interface by reacting with matrix molecules during curing process, which lead to a higher crosslinking density. Third, the long and tortuous liquid-crystal moleculars of the LCPBI/RGO nanosheets are able to entangle with matrix moleculars thus induced crosslink and improved the Tg.25,42
 |
| Fig. 9 DSC curves of the pure epoxy and epoxy composites. | |
3.5. Thermomechanical properties of epoxy composites
The thermomechanical properties of the epoxy composites were assessed by using dynamic mechanical analysis. Analysis of storage modulus (E′) and tan
δ curves have been proven to be an effective tool to assess the reinforcing efficiency of hybrid fillers under stress and temperature. Fig. 10 displays the dynamic mechanical spectra as a function of temperature for pure epoxy and epoxy composites. Fig. 10(a) shows the storage modulus of the pure epoxy, LCPBI/RGO/epoxy composite and LCPBI/RGO/Al2O3-APS/epoxy composites as a function of temperature. We can find, the storage modulus of the composite with only LCPBI/RGO nanofiller is a little higher than pure epoxy and lower than those with hybrid nanofillers. It also clearly reveals that the storage modulus of the epoxy composites increases with increasing the loading of hybrid fillers from 10 to 30 wt%. Within the experimental temperature range, the storage moduli of the epoxy composites are significant higher than that of pure epoxy. Two reasons may account for the enhancement in the thermomechanical properties. First, the applied stresses are expected to be easily transferred from the matrix onto the hybrid fillers due to the high surface area of hybrid fillers. Second, the strong covalent bonding formation between hybrid fillers and epoxy matrix reduced the mobility of the local matrix during the process of epoxy curing reaction. Furthermore, to assess the contribution of hybrid fillers to the modulus of composites at all temperature, the relative modulus between the storage modulus of the composite (E′Composite) and the pure epoxy (E′pure epoxy) are plotted in Fig. 10(b). The peaks around Tg for all composites are observed clearly. This dramatic increase in storage modulus around Tg indicates that the interaction between the functional groups present on the surface of hybrid fillers and the epoxy matrix is strong enough to allow a very efficient load to transfer to the hybrid fillers. Meanwhile, the resulting epoxy composites containing LCPBI/RGO/Al2O3-APS hybrid filler kept the desired mechanical properties, as shown in Fig. S1–S3 and Table S1.†
 |
| Fig. 10 DMA of the pure epoxy and epoxy composites at 1 Hz frequency: (a) storage modulus (E′), (b) difference in the storage modulus (E′) of composites and pure epoxy, (c) damping properties, and (d) Tg from DSC and DMA. | |
Fig. 10(c) shows the temperature dependence of tan
δ for the pure epoxy and epoxy composites. The loss factor tan
δ is defined as the ratio of the loss modulus to the storage modulus (E′′/E′), and it very sensitive to solid structural transformation in materials. The tan
δ peak values also determine Tg of the composites. Fig. 10(c) shows that the Tg of the pure epoxy and the composites with 10, 15, 20, 25, and 30 wt% are 182.4, 188.0, 189.5, 192.4, 193.4, and 196.0 °C, respectively. For the LCPBI/RGO/epoxy composite, the Tg is 184.7 °C. On the other hand, higher tan delta peak of composites compared to the pure epoxy were also observed. It can be interpreted that the interface interaction in the matrix enhanced with the content of hybrid fillers. Meanwhile the internal friction increased with the higher interface interaction, which eventually lead to a strong damping behavior and show a higher tan delta peak height in DMA test.6,13,40,43 A comparison of the Tg values from the DMA and DSC data is shown in Fig. 10(d). It should be mentioned that the glass transition is a diffuse thermodynamic transition. The measurement method and sample preparation always affect the absolute value of Tg obtained.9 While absolute magnitudes of Tg measured by these different methods differ, the trend in terms of changes of Tg from the DMA and DSC data are quite similar.
Fig. 11 shows the storage modulus and tan delta of pure epoxy and its composites in multifrequency pattern at 0.1, 1, 5 and 10 Hz frequency. We found both the storage modulus and the glass transition temperature of the pure epoxy and composites increase with the increasing frequency. That is attributed to the polymer chain segment motion easier to follow the change of the external force at low frequency condition compared to the high frequency, the internal friction was smaller than those at high frequency condition. These temperature shifts with frequency increase allow calculation of α-relaxation apparent activation energy of the relaxation process, ΔE, by means of the following eqn (1):44
|
ln(f) = ln(fo) − ΔE/RT
| (1) |
where
f is the vibration frequency, and
T stands for the absolute temperature of
Tg at frequency
f. The α-relaxation apparent activation energy of the relaxation process, Δ
E, is determined in regression equation with least square method. The linear fitting figure (the ln(
f) as the
Y axis and (1/
T) as the
X axis) was shown in the
Fig. 12(a). In addition,
Fig. 12(b) shows that the Δ
E and enhanced Δ
E of these composites. From the Δ
E values, we found that the α-relaxation apparent activation energy increased with increasing content of hybrid fillers. The phenomenon suggested the existence of matrix–filler interactions which caused by strong physical entangles and chemical crosslinking in the composites.
45 The entangles and cross-linking hindered the movement of molecular chain of resin matrix effectively. Thus with the increment of hybrid fillers, the resistance of molecular chain motion increased gradually, the glass transition temperature of composites increased.
46
 |
| Fig. 11 Storage modulus and tan delta versus temperature of pure epoxy and its composites at 0.1, 1, 5 and 10 Hz frequency: (a) pure epoxy; (b) 10 wt%; (c) 15 wt%; (d) 20 wt%; (e) 25 wt%; (f) 30 wt%. | |
 |
| Fig. 12 (a) Linear fitting of relationship between the frequency and temperature and (b) the ΔE and ΔE enhancement of pure epoxy and epoxy composites. | |
4. Conclusions
This study has demonstrated a novel approach to improve the thermal properties of epoxy composites filled by hybrid LCPBI/RGO and Al2O3-APS fillers. The hybrid LCPBI/RGO and Al2O3-APS fillers were prohibited from stacking and aggregation, resulted in high stability in solvent and homogeneous dispersion in epoxy matrix with a strong interface interaction. The thermal conductivity of epoxy composites could be improved by hybrid fillers. For instance, the thermal conductivity of epoxy composite with 30 wt% Al2O3-APS and 0.3 wt% LCPBI/RGO was 0.329 W m−1 K−1, increased by 105.6%, compared to that of the pure epoxy (0.16 W m−1 K−1). Meanwhile the Tg, storage modulus and mechanical properties of epoxy composites with increasing hybrid fillers were improved, as well as the α-relaxation apparent activation energy. Therefore, the hybrid fillers show significant potential as novel and effective additives for next generation electronic devices.
Acknowledgements
The authors gratefully acknowledge the financial support by National Natural Science Foundation of China (51303034 and 51463007), the Natural Science Foundation of Guangxi Province, China (2013GXNSFAA019308, 2014GXNSFDA118006 and 2014GXNSFBA118034), Guangxi Universities Scientific Research Project (no. YB2014165), Natural Science Foundation of Ningbo (no. Y40307DB05). Guangxi Small Highland Innovation Team of Talents in Colleges and Universities and Guangxi Funds for Specially-appointed Expert.
References
- J. Zhu, S. Wei, J. Ryu, M. Budhathoki, G. Liang and Z. Guo, J. Mater. Chem., 2010, 20, 4937–4948 RSC.
- H. Gu, S. Tadakamalla, X. Zhang, Y. Huang, Y. Jiang, H. A. Colorado, Z. Luo, S. Wei and Z. Guo, J. Mater. Chem. C, 2013, 1, 729–743 RSC.
- S. Lu, S. Li, J. Yu, Z. Yuan and B. Qi, RSC Adv., 2013, 3, 8915 RSC.
- X. Xiao, S. Lu, B. Qi, C. Zeng, Z. Yuan and J. Yu, RSC Adv., 2014, 4, 14928 RSC.
- Z. Yuan, J. Yu, B. Rao, H. Bai, N. Jiang, J. Gao and S. Lu, Macromol. Res., 2014, 22, 405–411 CrossRef CAS PubMed.
- S. Ganguli, A. K. Roy and D. P. Anderson, Carbon, 2008, 46, 806–817 CrossRef CAS PubMed.
- Y. Xu, D. Chung and C. Mroz, Composites, Part A, 2001, 32, 1749–1757 CrossRef.
- J. Yu, X. Huang, L. Wang, P. Peng, C. Wu, X. Wu and P. Jiang, Polym. Chem., 2011, 2, 1380 RSC.
- J. Yu, X. Huang, C. Wu, X. Wu, G. Wang and P. Jiang, Polymer, 2012, 53, 471–480 CrossRef CAS PubMed.
- M. J. Assael, K. D. Antoniadis, I. N. Metaxa and D. Tzetzis, J. Chem. Eng. Data, 2009, 54, 2365–2370 CrossRef CAS.
- Y. J. Wan, L. X. Gong, L. C. Tang, L. B. Wu and J. X. Jiang, Composites, Part A, 2014, 64, 79–89 CrossRef CAS PubMed.
- L. Wang, F. Liu, C. Jin, T. Zhang and Q. Yin, RSC Adv., 2014, 4, 46187–46193 RSC.
- C. Bao, Y. Guo, L. Song, Y. Kan, X. Qian and Y. Hu, J. Mater. Chem., 2011, 21, 13290 RSC.
- S. H. Song, K. H. Park, B. H. Kim, Y. W. Choi, G. H. Jun, D. J. Lee, B. S. Kong, K. W. Paik and S. Jeon, Adv. Mater., 2013, 25, 732–737 CrossRef CAS PubMed.
- S. Y. Yang, W. N. Lin, Y. L. Huang, H. W. Tien, J. Y. Wang, C. C. M. Ma, S. M. Li and Y. S. Wang, Carbon, 2011, 49, 793–803 CrossRef CAS PubMed.
- X. Huang, X. Qi, F. Boey and H. Zhang, Chem. Soc. Rev., 2012, 41, 666–686 RSC.
- C. C. Teng, C. C. M. Ma, K. C. Chiou and T. M. Lee, Composites, Part B, 2012, 43, 265–271 CrossRef CAS PubMed.
- Z. Han and A. Fina, Prog. Polym. Sci., 2011, 36, 914–944 CrossRef CAS PubMed.
- C. Zeng, S. Lu, X. Xiao, J. Gao, L. Pan, Z. He and J. Yu, Polym. Bull., 2015, 72, 453–472 CrossRef CAS PubMed.
- C. W. Struijk, A. B. Sieval, J. E. Dakhorst, M. van Dijk, P. Kimkes, R.
B. Koehorst, H. Donker, T. J. Schaafsma, S. J. Picken and A. M. van de Craats, J. Am. Chem. Soc., 2000, 122, 11057–11066 CrossRef CAS.
- R. A. Cormier and B. A. Gregg, Chem. Mater., 1998, 10, 1309–1319 CrossRef CAS.
- O. C. Compton and S. T. Nguyen, Small, 2010, 6, 711–723 CrossRef CAS PubMed.
- J. Björk, F. Hanke, C.-A. Palma, P. Samori, M. Cecchini and M. Persson, J. Phys. Chem. Lett., 2010, 1, 3407–3412 CrossRef.
- Y. Xu, H. Bai, G. Lu, C. Li and G. Shi, J. Am. Chem. Soc., 2008, 130, 5856–5857 CrossRef CAS PubMed.
- R. Qian, J. Yu, C. Wu, X. Zhai and P. Jiang, RSC Adv., 2013, 3, 17373–17379 RSC.
- Y. Song, J. Yu, D. Dai, L. Song and N. Jiang, Mater. Des., 2014, 64, 687–693 CrossRef CAS PubMed.
- W. A. Razali, V. K. Sreenivasan, E. M. Goldys and A. V. Zvyagin, Langmuir, 2014, 30, 15091–15101 CrossRef CAS PubMed.
- L. Pan, S. Lu, X. Xiao, Z. He, C. Zeng, J. Gao and J. Yu, RSC Adv., 2015, 5, 3177–3186 RSC.
- S. C. Jana and S. Jain, Polymer, 2001, 42, 6897–6905 CrossRef CAS.
- F. You, D. Wang, X. Li, M. Liu, G.-H. Hu and Z.-M. Dang, RSC Adv., 2014, 4, 8799–8807 RSC.
- Q. Yang, X. Pan, F. Huang and K. Li, J. Phys. Chem. C, 2010, 114, 3811–3816 CAS.
- S. Burattini, B. W. Greenland, D. H. Merino, W. Weng, J. Seppala, H. M. Colquhoun, W. Hayes, M. E. Mackay, I. W. Hamley and S. J. Rowan, J. Am. Chem. Soc., 2010, 132, 12051–12058 CrossRef CAS PubMed.
- J. Liu, G. Chen and M. Jiang, Macromolecules, 2011, 44, 7682–7691 CrossRef CAS.
- X. An, T. Simmons, R. Shah, C. Wolfe, K. M. Lewis, M. Washington, S. K. Nayak, S. Talapatra and S. Kar, Nano Lett., 2010, 10, 4295–4301 CrossRef CAS PubMed.
- C. Li and B. C. Benicewicz, Macromolecules, 2005, 38, 5929–5936 CrossRef CAS.
- S. Guo and S. Dong, Chem. Soc. Rev., 2011, 40, 2644–2672 RSC.
- J. H. Yu, J. K. Duan, W. Y. Peng, L. C. Wang, P. Peng and P. K. Jiang, eXPRESS Polym. Lett., 2011, 5, 132–141 CrossRef CAS.
- S. Velu, K. Suzuki, C. S. Gopinath, H. Yoshida and T. Hattori, Phys. Chem. Chem. Phys., 2002, 4, 1990–1999 RSC.
- Z. Kónya, J. Kiss, A. Oszkó, A. Siska and I. Kiricsi, Phys. Chem. Chem. Phys., 2001, 3, 155–158 RSC.
- H. Im and J. Kim, Carbon, 2012, 50, 5429–5440 CrossRef CAS PubMed.
- M. Fang, K. Wang, H. Lu, Y. Yang and S. Nutt, J. Mater. Chem., 2009, 19, 7098 RSC.
- H. Xia and M. Song, Soft Matter, 2005, 1, 386–394 RSC.
- P. Song, Z. Cao, Y. Cai, L. Zhao, Z. Fang and S. Fu, Polymer, 2011, 52, 4001–4010 CrossRef CAS PubMed.
- L. Ibarra and D. Panos, J. Appl. Polym. Sci., 1998, 67, 1819–1826 CrossRef CAS.
- P. N. Patil, S. K. Rath, S. K. Sharma, K. Sudarshan, P. Maheshwari, M. Patri, S. Praveen, P. Khandelwal and P. K. Pujari, Soft Matter, 2013, 9, 3589–3599 RSC.
- M. Naffakh and A. M. Díez-Pascual, J. Mater. Chem. B, 2014, 2, 4509–4520 RSC.
Footnote |
† Electronic supplementary information (ESI) available. See DOI: 10.1039/c5ra01967b |
|
This journal is © The Royal Society of Chemistry 2015 |
Click here to see how this site uses Cookies. View our privacy policy here.