The combined effect of heat-draw ratios and residence time on the morphology and property of aromatic copolysulfonamide fibers

Xi Yanga, Jinchao Yua, Feng Tianb, Shenghui Chenc, Fenhua Wangc, Yumei Zhang*a and Huaping Wanga
aState Key Laboratory for Modification of Chemical Fibers and Polymer Materials, Donghua University, Shanghai, 201620, China. E-mail: zhangym@dhu.edu.cn
bShanghai Institute of Applied Physics Chinese Academy of Sciences, 201204, China
cShanghai Tanlon Fiber Co., Ltd, Shanghai, 201419, China

Received 30th January 2015 , Accepted 2nd March 2015

First published on 3rd March 2015


Abstract

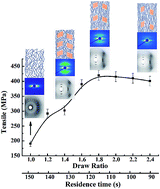
The wet-spun aromatic copolysulfonamide (co-PSA) fibers were heat-drawn at different ratios and then characterized by tensile testing, wide angle X-ray diffraction (WAXD) and small angle X-ray scattering (SAXS). The results showed that the tenacity of co-PSA fibers did not increase monotonously with the draw ratios and a maximal value of tenacity and initial modulus was observed as the heat-draw ratio increased. Accordingly, the large crystalline size, content of mesophase and crystal phase, as well as long period and fibril length, were corresponding to the maximum tenacity of the heat-drawn fibers. This suggested that the residence time of the co-PSA fibers, during which it stayed in the heat tube, could not be neglected when the draw ratios changed. A more perfect structure could be formed with a favourable draw ratio and residence time.
1. Introduction

Aromatic polysulfonamide (PSA) fiber, as one of the high-performance fibers, has been applied in the field of heat-resistant filter, flame-resistant material and insulating material because of its unique properties such as excellent thermal properties, acid and alkali resistance and flame retardancy.1,2 Such significant performances of PSA fibers are attributed to their molecular structure, supermolecular structure and microstructure, which have been disclosed in the past investigations.3,4 In addition to the inherent structure of PSA, the morphology of the fibers, which is formed during the spinning process, is also a negligible factor to the performance of PSA fibers. Sokira5 and Banduryan et al.6 studied the effect of coagulation conditions during both the wet spinning process and dry spinning process on the porous structure of aromatic polysulfonamide fibers. They also pointed out that the fiber was amorphous before heat drawing and further orientation and polymer crystallization occurred during the heat drawing process, which suggests that heat drawing played an important role in the improvement of the fiber performance. Chen et al.7 studied the effect of heat-draw ratio on the structure and properties of the aromatic copolysulfonamide (co-PSA) fibers. Results showed that the crystallinity and crystal orientation increased when the draw ratios varied from 1.4 to 2.6, resulting in the increase of tenacity. Yu et al.8 investigated the influence of heat-draw temperature on the structure and properties of the aromatic copolysulfonamide (co-PSA) fibers. The crystallinity of the co-PSA fibers increased with the heat-draw temperature but a maximum value of strength was observed at 350 °C to 390 °C temperature range because of the special microstructure formed in the heat drawing process. Such phenomenon was also found in other high-performance fibers. Ran et al.9 found that there exists a typical draw-to-break ratio for Kevlar 49 fiber, which results in a decrease in the crystal orientation when the fibers were stretched above that breaking point. Law et al.10 discussed the effect of draw ratio as well as the residence time in the heated tunnel on the structure changes of the wet-spun acrylic-fiber. At high stretch ratios, the residence time in the tunnel was consequently reduced, which impacted the structural collapse and subsequent properties.

Kuznetsov et al.11 pointed out that the crystallization of PSA was slow; thus, the residence time must be taken into account when the draw ratio or draw speed is changed. Therefore, we designed a heat-drawing experiment for the wet-spun co-PSA fiber to investigate the changes in the structure and properties at different heat-draw ratios accompanied by the change in the residence time. The mechanical properties of co-PSA fibers were measured by tensile testing, and the structure was analysed by wide angle X-ray diffraction (WAXD) and small angle X-ray scattering (SAXS). The relationship between the structure and properties of the co-PSA fibers drawn at different ratios is discussed below.

2. Experimental

2.1. Materials

Wet-spun fiber (co-PSA-0) was supplied by Shanghai Tanlon Fiber Co., Ltd. co-PSA was synthesized via the polycondensation of 4,4′-diaminodiphenylsulfone (4,4′-DDS), 3,3′-diaminodiphenylsulfone (3,3′-DDS) and terephthaloyl chloride (TPC) with a molar ratio of 3[thin space (1/6-em)]:[thin space (1/6-em)]1[thin space (1/6-em)]:[thin space (1/6-em)]4. The intrinsic viscosity ([η]) of the prepared co-PSA was 0.7 dL g−1, which was measured in dimethylsulfoxide (DMSO) at 25 °C.

2.2. Sample preparation

The dried wet-spun co-PSA fibers were drawn in a heat tube, as shown in Fig. 1. The draw ratio was controlled by adjusting the second roller speed (V2) as the first roller speeds (V1) were kept constant. The ratio was changed from 1.2 to 2.4 to obtain different samples numbered from co-PSA-1 to co-PSA-7 (Table 1).
image file: c5ra01868d-f1.tif
Fig. 1 Schematic illustration of a heat-drawing process.
Table 1 Sample description
Fibers Draw ratio (V2/V1) Residence time (s)
co-PSA-0 Wet-spun fiber
co-PSA-1 1.2 139
co-PSA-2 1.4 130
co-PSA-3 1.6 121
co-PSA-4 1.8 113
co-PSA-5 2.0 105
co-PSA-6 2.2 97
co-PSA-7 2.4 90


2.3. Characterization

The diameters of the fibers were measured using an 8XB-PC microscope. At least 20 samples were tested for each sample and the average diameters were calculated.

The stress–strain curves of a single fiber were recorded using a XQ-2 tensile tester with a gauge length of 20 mm and an extension rate of 20 mm min−1. At least 50 samples were tested for each samples and the average tenacity, elongation at break and initial modulus were calculated.

Wide-angle X-ray diffraction (WAXD) was carried out at the Shanghai Synchrotron Radiation Facility (SSRF) on beam line (BL14B) with an X-ray wavelength of 0.124 nm. A bundle of co-PSA fibers was placed on a sample holder with the fiber direction perpendicular to the X-ray beam. The specimen-to-detector (Mar345) distance was calibrated using the standard sample LaB6. All data analysis (background correction, radial and azimuthal integration) was carried out using the Xpolar software (Precision works NY, Inc., USA).

The phase structure of the PSA fibers was quantitatively calculated according to the three phase model (shown in Fig. 2), as described by Ran9 and Che.13


image file: c5ra01868d-f2.tif
Fig. 2 Schematic illustration of the three phase structure.12

The average crystallite size, Lhkl, perpendicular to plane (hkl) and the crystal orientation along the fiber axis (Z) were calculated according to the methods described in ref. 8.

Small angle X-ray scattering (SAXS) experiment of the fibers was carried out at the Shanghai Synchrotron Radiation Facility (SSRF) on beam line (BL16B) with an X-ray wavelength of 0.124 nm. The sample-to-detector (Mar CCD 165) distance was 1980 mm. All data analysis was carried out using the Xpolar software (Precision works NY, Inc., USA).

The average length (lf), radius and misorientation angle (Bϕ) of the fibrils were calculated as described in ref. 8.

For heat-drawn co-PSA fibers, there is a detectable arc-shaped pattern along the meridional direction, which indicates the existence of lamellar morphology. The long period (LM), the length of the lamellae (LN) and the diameter of the lamellae (LE) were calculated based on the methods proposed by Murthy.14,15

3. Results and discussion

3.1. Mechanical properties of co-PSA fibers heat-drawn at different ratios

The variations in the tenacity, initial modulus and elongation at break of co-PSA fibers heat-drawn at different ratios are plotted in Fig. 3. The elongation at break of the heat-drawn fibers was lower than that of the wet-spun co-PSA fibers, which was probably due to the lowered flexibility of polymer chains after drawing. The tenacity and initial modulus of the heat-drawn co-PSA fibers increased significantly but did not increase monotonously with the varying draw ratios, as shown in Fig. 3. A maximum tenacity of 420 MPa and initial modulus of 4.5 GPa were achieved with a draw ratio of 1.8. However, a slight decline in tenacity and initial modulus was observed when the draw ratios further increased over 2.0. Such a remarkable change of the mechanical properties of co-PSA fibers could be due to the different structures formed under different heat drawing conditions, which will be discussed in the following Section. The mechanical properties analysis of the samples with different draw ratios demonstrates that a suitable draw ratio is crucial for the simultaneous improvement in both the tenacity and initial modulus.
image file: c5ra01868d-f3.tif
Fig. 3 Tenacity, initial modulus and elongation at break of co-PSA fibers heat-drawn at different ratios (draw ratio 1.0 represents the wet-spun co-PSA fiber).

3.2. Microstructure of co-PSA fibers heat-drawn at different ratios

Fig. 4 illustrates the 2D WAXD patterns of the co-PSA fibers heat-drawn at different ratios. The strong diffuse halo in the pattern of the wet-spun fiber showed its amorphous state. For the heat-drawn co-PSA fibers, the reflections located on the equator, meridian, and the off-axis indicated the development of the crystalline structure within the fiber. The index reflections of co-PSA are identified in Fig. 4.
image file: c5ra01868d-f4.tif
Fig. 4 WAXD patterns of co-PSA fibers heat-drawn at different ratios.

The quantitative calculation of the crystal, amorphous and mesophase fractions from 2D WAXD patterns is shown in Fig. 5(a) and the crystallite sizes and crystal orientation, fc, are plotted in Fig. 5(b). At low draw ratios, long residence time led to sufficient crystallization and high crystallinity but the crystal orientation was lower because of the less drawing stress impact on the fiber from the lower draw ratio.16 At high draw ratios, the residence time was inevitably reduced. There was not enough time for the macromolecular chain to be rearranged; therefore, the crystallinity was relatively low and more amorphous phase of the wet-spun fibers was converted to mesophase under greater drawing stress. However, the crystal orientation of the heat-drawn co-PSA fibers improved at higher draw ratios owing to the higher drawing stress. As the draw ratio rose up to 2.2, the crystal orientation decreased. It is logical to conclude that there was not enough time for the polymer chains to pack along the fiber axis due to the very short residence time.


image file: c5ra01868d-f5.tif
Fig. 5 Fractions of crystal, amorphous and mesomorphic phases (a), crystallite size and crystal orientation fc (b) of co-PSA fibers heat-drawn at different ratios.

It is interesting that the different variation trends of the crystallite sizes of crystal plane (002) and (100) were found. In general, the normal direction of the crystal plane (100) is perpendicular to the fiber axis, while that of (002) is parallel to the fiber axis. At higher draw ratios within a certain range, the crystallite tended to grow along the fiber axis with a larger crystallite size of plane (002) and smaller size of plane (100) under the higher drawing stress. For fibers heat-drawn at ratios higher than 2.0, there was no time for the crystallite to grow, resulting in the smaller crystallite sizes of both the planes.

The microstructure of the co-PSA fibers at a large scale has been analyzed by SAXS, as shown in Fig. 6. A characteristic diamond-shaped scattering pattern along the equator was seen for the wet-spun co-PSA fibers. The equatorial steak became sharper and grew in intensity for the heat-drawn co-PSA fibers, which indicates the higher orientation of the fibrils.8 It also should be noted that the arc-shaped pattern along the meridional direction appeared on the SAXS patterns of the heat-drawn co-PSA fibers, which proves the existence of the lamellar morphology in the stretching direction. At higher draw ratios, the orientation in the amorphous region improved due to the straightened polymer chains under higher drawing stress and the structural difference between the lamellae and amorphous region subsided, which led to the declined electron cloud density contrast. Consequently, the scattering intensity of the arc-shaped pattern decreased.


image file: c5ra01868d-f6.tif
Fig. 6 SAXS patterns of co-PSA fibers heat-drawn at different ratios.

The quantitative analysis of the average length (lf), radius and misorientation angle (Bϕ) of the fibrils was conducted, as shown in Fig. 7. The fibril length was found to be longer when the fibers were heat-drawn at higher ratios until 1.8, which could be a result of the higher drawing stress. It could be understood that the long fibril could only be formed with suitable drawing stress and residence time. The radius of the fibrils in the cross section exhibited multi-order characters and were not affected by the draw ratios. The misorientation of the fibrils was found to decrease after heat drawing and varied within a small range under different ratios, indicating that the orientation of the fibrils improved greatly after heat drawing but did not increase with higher draw ratios.


image file: c5ra01868d-f7.tif
Fig. 7 Fibril length, misorientation angle (a) and fibril radius (b) of co-PSA fibers heat-drawn at different ratios (draw ratio 1.0 represents the wet-spun co-PSA fiber).

The long period (LM), the length of the lamellae (LN) and the diameter of the lamellae (LE) are derived from the lamellar SAXS reflection, as shown in Fig. 8. For the co-PSA-5, co-PSA-6, co-PSA-7, the scattering intensity in the meridional direction is very low for quantitative calculation. At higher draw ratios, the length of the lamellae increased slightly, while an apparent decline in the diameter of the lamellae was found. From the conformation and molecular packing in the crystal phase, it could be understood that at low draw ratios, long residence time led to the packing of molecular chains perpendicular to the fiber axis under its own hydrogen bond between NH2 and C[double bond, length as m-dash]O, which results in a larger lamellar stack diameter. At high draw ratios, the oriented chain segments were packed into the crystal lattice under external stress along the fiber axis and the crystallization was insufficient because of the short residence time. It is seen that the long period was larger when the fibers were heat-drawn at higher draw ratios, which could be related to the longer length of the lamellae and the fraction of mesomorphic phase as observed earlier by WAXD.


image file: c5ra01868d-f8.tif
Fig. 8 Length of the lamellar, diameter of the lamellae (a) and long period (b) of co-PSA fibers heat-drawn at different ratios.

A structural model is proposed to illustrate the morphology of the fibers formed under different draw ratios, as shown in Fig. 9. The wet-spun co-PSA fibers had an amorphous structure and a more compact structure with periodic lamellae, which was formed after heat drawing. At low draw ratios, the orientation of molecular chains in the amorphous region was relatively low due to the less drawing stress, while the long residence time was conducive for sufficient crystallization with wider lamellae and higher crystallinity. At high draw ratios, the molecular chains straightened under bigger drawing stress, whereas the crystallinity and lamellar stack diameter decreased with insufficient residence time. The more perfect structure with high crystallinity as well as high amorphous orientation could be formed at favorable draw ratio and residence time.


image file: c5ra01868d-f9.tif
Fig. 9 Schematic structural models of co-PSA fibers heat-drawn at different ratios.

4. Conclusions

By varying the heat-draw ratio of the wet-spun co-PSA fibers, the residence time of the fibers, for which it stayed in the heat tube, inevitably changed. It turned out that the tenacity of co-PSA fibers did not increase monotonously with the draw ratios and a slight decline in strength and initial modulus was observed when the fiber was drawn at higher ratios. Combined with the results of microstructure changes, a simple model was proposed to describe the morphology changes of wet-spun co-PSA fibers with different heat-draw ratios. At low draw ratios, indicating lesser drawing stress, long residence time was conducive for sufficient crystallization and high crystallinity; however, the orientation in the amorphous region was relatively low. At high draw ratios, the crystallinity decreased because of the insufficient residence time, while the amorphous orientation increased significantly under higher drawing stress. It could be noted that more perfect structure with larger crystalline size, mesophase and crystal phase, as well as the long period and fibril length, could only be formed with favorable draw ratio and residence time, which corresponds to the maximum strength of the heat-drawn fibers.

Acknowledgements

This study was financially supported by the National Natural Science Foundation of China (11079015 and 51273039) and the Chinese Universities Scientific Fund (CUSF-DH-D-2014024).

Notes and references

  1. X. Wang and Y. Zhang, China Text. Leader, 2005, 1, 18 Search PubMed , Chinese.
  2. J. Ren, X. Wang and Y. Zhang, Technical Textiles, 2007, 5, 1 Search PubMed , Chinese.
  3. X. Ding, Y. Chen, S. Chen, J. Li, X. Wang, H. Wang and Y. Zhang, J. Macromol. Sci., Part B: Phys., 2012, 51, 1199 CrossRef CAS.
  4. Y. Zhang, H. Wang, S. Chen, X. Wang, D. Fang, C. Burger, J. Che, X. Li and B. S. Hsiao, Macromol. Chem. Phys., 2013, 214, 2432 CrossRef CAS.
  5. A. N. Sokira, S. G. Efimova, A. M. Shchetinin, G. G. Frenkel and M. M. Iovleva, Fibre Chem., 1979, 10, 545 CrossRef.
  6. S. I. Banduryan, N. A. Ivanova, S. G. Efimova, A. N. Sokira, A. M. Efimova, A. N. Sokira, A. M. Shchetinin, G. G. Frenkel, G. A. Budnitskii and M. M. Iovleva, Fibre Chem., 1978, 9, 484 CrossRef.
  7. F. Chen, S. Chen, Q. Wu, J. Yu, X. Ding and Y. Zhang, Synth. Fiber China, 2013, 42, 18 CAS , Chinese.
  8. J. Yu, R. Wang, C. Yang, S. Chen, F. Tian, H. Wang and Y. Zhang, Polym. Int., 2014, 63, 2084 CrossRef CAS.
  9. S. Ran, D. Fang, X. Zong, B. S. Hsiao, B. Chu and P. M. Cunniff, Polymer, 2001, 42, 1601 CrossRef CAS.
  10. S. J. Law and S. K. Mukhopadhyay, J. Text. Inst., 1998, 89, 182 CrossRef CAS.
  11. G. A. Kuznetsov, N. I. Nikiforov, V. P. Lebedev, V. G. Zhuravlev and V. M. Savinov, Polym. Sci. U.S.S.R., 1974, 16, 3156 CrossRef.
  12. Z. Mo and Y. Chen, Chin. Polym. Bull., 1990, 3, 178 Search PubMed , Chinese.
  13. J. Che, C. R. Locker, S. Lee, G. C. Rutledge, B. S. Hsiao and A. H. Tsou, Macromolecules, 2013, 46, 5279 CrossRef CAS.
  14. N. S. Murthy and D. T. Grubb, J. Polym. Sci., Part B: Polym. Phys., 2006, 44, 1277 CrossRef CAS.
  15. N. S. Murthy, D. T. Grubb and K. Zero, Macromolecules, 2000, 33, 1012 CrossRef CAS.
  16. F. Lian, J. Liu, Z. Ma and J. Liang, Carbon, 2012, 50, 488 CrossRef CAS PubMed.

This journal is © The Royal Society of Chemistry 2015
Click here to see how this site uses Cookies. View our privacy policy here.