Synthesis of silicate-bridged ZnO/g-C3N4 nanocomposites as efficient photocatalysts and its mechanism†
Chong Liuab,
Chengming Lia,
Xuedong Fua,
Fazal Raziqa,
Yang Qua and
Liqiang Jing*a
aKey Laboratory of Functional Inorganic Materials Chemistry (Heilongjiang University), Ministry of Education, School of Chemistry and Materials Science, Harbin 150080, P. R. China. E-mail: jinglq@hlju.edu.cn; Tel: +86 451 86604760
bCollege of Environmental and Chemical Engineering, Heilongjiang University of Science and Technology, Harbin 150027, P. R. China
First published on 9th April 2015
Abstract
In this study, silicate-capped ZnO/g-C3N4 nanocomposites were successfully fabricated by a simple wet chemical process. The photocatalytic activities of g-C3N4 for the degradation of phenol and the production of H2 are greatly enhanced after coupling with an appropriate amount of nanocrystalline ZnO. This is attributed to the prolonged lifetime and increased separation of the photogenerated charges, which are mainly based on atmosphere-controlled steady-state surface photovoltage spectra and time-resolved surface photovoltage responses. Interestingly, the lifetime and separation of photogenerated charges are further improved after the introduction of silicate groups as linkers between ZnO and g-C3N4, which consequently lead to enhanced photocatalytic activities, as much as 4 times higher compared to g-C3N4. Evidently, the built silicate linkers, which act as bridges, are highly favorable for charge transfer and separation in the fabricated heterojunctional nanocomposites and also for efficient photocatalysis. The present work provides a simple and feasible idea to enhance photogenerated charge separation so as to improve the photoactivities of nanocomposites.
Introduction
Photocatalytic degradation of organic compounds on semiconductors offers a viable approach to solve a variety of environmental problems.1 Among the photocatalysts used, graphitic carbon nitride (g-C3N4) is a relatively novel, versatile and promising metal-free polymeric semiconductor photocatalyst to overcome the problem of energy and environment, which has been widely investigated for its great potential in degrading environmental pollutants. In addition, it can catalyze water splitting for H2 evolution and reduce carbon dioxide under irradiation due to its special semiconducting properties,2–4 and such low-cost material may be used in the field of civil engineering. However, its photogenerated charges easily recombine to restrict its photocatalytic performance and thus greatly influencing its wide practical application.5–7 Accordingly, several attempts have been made to promote its photogenerated charges separation with certain success such as surface heterojunctions, copolymerization, doping with foreign elements, and coupling with metals or other semiconductors.8–12One of the most general methods is to design and construct a suitable heterojunctional composite. Several researchers have demonstrated the enhanced photocatalytic properties of TiO2/g-C3N4, DyVO4/g-C3N4, and CdS/g-C3N4 nanocomposites compared to the bare g-C3N4 for the degradation of pollutants and production of H2.13–16 Unfortunately, there is usually a lack of direct evidence to reveal the characteristics of photogenerated charges to support the expected conclusions that such ‘heterojunction’ is beneficial for the transfer and separation of photogenerated charges. In addition, fabricated g-C3N4-based nanocomposites do not yet meet the requirements for practical applications. Therefore, it is highly desired to develop a novel g-C3N4-based nanocomposite as an efficient photocatalyst, and also deeply reveal its charge transfer-separation mechanism.
In recent studies, ZnO, which is a typical oxide semiconductor, has been given considerable attention because of its wide energy band gap, strong exciton binding energy, rich morphologies, and potential applications as nanolasers, field emitters, nanotransistors, sensors and nanogenerators.17–20 In general, its properties are similar to those of TiO2 because of its similar energy band gap and conduction and valence band potentials (located at −0.16 eV and 2.16 eV versus NHE, respectively).21 Differently, it is cheap and easy to prepare. There have been several published studies on ZnO/g-C3N4 composites as photocatalysts to date.22–28 It is widely accepted that the heterojunction connections in a nanocomposite mainly depend on the lattice matching degree, which greatly influences charge transfer and separation. Undoubtedly, ZnO and g-C3N4 exhibit different crystal structures with different lattice parameters so that the connection between ZnO and g-C3N4 is weak. For this, it is meaningful to introduce functional linkers between them as bridges in order to be favourable for charge transportation. Because the silicate group is often taken as one of the most effective modifiers as adhesives,29–31 along with our previous work indicating that the introduced silicate groups are useful for charge separation in a BiVO4-based nanocomposite,32 it is feasible to improve the photocatalytic performance of g-C3N4-based heterojunctional nanocomposites by building bridges with silicate groups.
Based on the abovementioned considerations, we tried to investigate the effects of coupling ZnO and building silicate bridges on the photogenerated charge transfer and separation and on the photocatalytic performance of g-C3N4, mainly by means of surface photovoltage techniques. It is clearly demonstrated that the photocatalytic activity of g-C3N4 could be greatly enhanced after coupling with an appropriate amount of nanocrystalline ZnO. In particular, for silicate-bridged ZnO/g-C3N4, it displays nearly 4-times higher photocatalytic activities for the degradation of phenol or production of H2, compared to bare g-C3N4. It is confirmed that the enhanced photocatalytic activity is attributed to the promoted separation of photogenerated charges. This work provides a simple and feasible idea to enhance photogenerated charge separation so as to improve the activities of nanocomposites as efficient photocatalysts for the degradation of pollutants and the production of H2.
Experimental section
Chemicals
All the chemicals used in this work were of analytical grade and were used without further purification.Fabrication of silicate-capped ZnO/g-C3N4 nanocomposite
g-C3N4 powder was synthesized by heating melamine in an alumina combustion boat at 550 °C for 4 h under an argon gas flow (20 mL min−1).33 The nano-ZnO powder was synthesized by the dropwise addition of 100 mL NaOH ethyl alcohol solution (0.1 mol L−1) into 50 mL of Zn(Ac)2 ethyl alcohol solution (0.02 mol L−1) under continuous stirring. Then, the suspension was maintained at 55 °C with stirring for 1 h. The product was collected by centrifugation and then thoroughly washed with absolute ethyl alcohol. Finally, the product was dried at 70 °C and then heated at 150 °C for 1 h. The ZnO/g-C3N4 composites were synthesized by mixing the as-prepared g-C3N4 with different amounts of nano-ZnO. In a typical synthesis procedure, 0.5 g g-C3N4 powder was impregnated in 20 mL of ethyl alcohol, and then the planned-quality ZnO ethyl alcohol solution was added dropwise into it with stirring for 2 h. Subsequently, the suspension was dried at 70 °C, followed by thermal treatment at 450 °C for 1 h. For the silicate-capped ZnO/g-C3N4 composite, silicate-capped ZnO was synthesized by mixing the resulting ZnO and various amounts of TEOS ethyl alcohol solution (0.01 mol L−1) with stirring for 2 h in advance, followed by drying at 70 °C. Subsequently, a procedure similar to the preparation procedure of the ZnO/g-C3N4 composite was used. The ZnO/g-C3N4 and silicate-capped ZnO/g-C3N4 composite samples were defined as XZnO–CN and Ysilicate-bridged ZnO–CN, respectively, where X indicates the mass percent ratio of ZnO to g-C3N4, Y is the molar percent ratio of silicon to zinc atoms, and CN is g-C3N4.The silicate-capped ZnO/g-C3N4 nanocomposite films that were used for photoelectrochemical (PEC) measurements were prepared by the doctor blade method using Scotch tape as the spacer. The paste was prepared as follows: 50 mg nanocomposite powder was dispersed in 2 mL DMF, and then treated by an ultrasonic process for 30 min and was stirred for 30 min. The FTO glass that was covered by the nanocomposite film was cut into approximately 1.0 cm × 3.0 cm pieces with a nanocomposite film surface area of 1.0 cm × 1.0 cm. To make a photoelectrode, an electrical contact was made with the FTO substrate using silver conducting paste connected to a copper wire, which was then enclosed in a glass tube. The working geometric surface area of nanocomposite was 0.5 cm × 0.5 cm, where the remaining area was covered with epoxy resin.
Characterization
The crystalline phase of the prepared samples were characterized using a Bruker D8 X-ray diffractometer (XRD) using Cu Kα radiation source (λ = 1.5418 Å), and an accelerating voltage of 30 kV and an emission current of 20 mA was employed. The morphology of the samples was determined using a JEOL JEM-2010 transmission electron microscope (TEM) operating at 200 kV. Ultraviolet-visible (UV-Vis) diffuse reflectance spectroscopy (DRS) of the samples was recorded using a Model Shimadzu UV-2550 spectrophotometer. Fourier transform infrared spectra (FTIR) were collected with a Bruker Equinox 55 spectrometer, using KBr as a diluent.Steady-state surface photovoltage spectroscopy (SS-SPS) measurements on the samples were conducted with a home-built apparatus with a lock-in amplifier (SR830) synchronized with a light chopper (SR540). The powder sample was sandwiched between two ITO glass electrodes, in which an outer electric field could be employed. The sandwiched electrodes were arranged in an atmosphere-controlled container with a quartz window and mono-chromatic light was obtained by passing light from a 500 W xenon lamp (CHF XQ500W) through a double prism monochromator (SBP300).
Time-resolved surface photovoltage (TR-SPV) measurements were performed with a self-assembled device in atmosphere at room temperature, in which the sample chamber was connected to an ITO glass as the top electrode and to a steel substrate as the bottom electrode, and an approximately 10 μm thick mica spacer was placed between the ITO glass and the sample to decrease the space charge region at the ITO–sample interface. The samples were excited by 532 nm-laser radiation with 10 ns pulse width from a second harmonic Nd:YAG laser (Lab-130-10H, Newport, Co.). The laser intensity was modulated with an optical neutral filter and measured by a high energy pyroelectric sensor (PE50BF-DIF-C, Ophir Photonics Group). Signals were registered by a 1 GHz digital phosphor oscilloscope (DPO 4104B, Tektronix) with an amplifier and the aid of a computer.
Photoelectrochemical (PEC) measurements for the samples were performed in a glass cell using a xenon lamp (500 W), with a monochromator (CM110, Spectral Products), a stabilized current power supply as the illumination source and an aqueous solution of Na2SO4 (1.0 mol L−1). The working electrode was the resulting nanocomposite film (illumination area about 0.25 cm2), which was illuminated from the FTO glass side. Platinum wire (99.9%) was used as the counter electrode, and a saturated KCl Ag/AgCl electrode (SSE) was used as the reference electrode. All potentials were referenced to the SSE at 25 °C. Oxygen free nitrogen gas was bubbled through the electrolyte before and during the experiments. Applied potentials were controlled by a commercial computer-controlled potentiostat (LK2006A, made in China). Electrochemical impedance data were obtained using the three electrode configuration with a Princeton Applied Research Versa STAT 3, and the experiments were carried out in the frequency range of 1 MHz to 100 mHz with the amplitude of 10 mV (RMS) at the bias of 0.4 V vs. Ag/AgCl.
Photocatalytic activity measurements
The photocatalytic activities of the samples were examined by the photocatalytic degradation of phenol and water splitting to produce H2. In a typical liquid-phase photocatalytic experiment, a 150 W xenon lamp was chosen as the light source, 0.1 g of photocatalyst and 20 mL of 10 mg L−1 phenol aqueous solution were mixed by stirring for 1 h in an open glass reactor under light irradiation. The distance between the light source and the reactor was 10 cm. After centrifugation, the phenol concentrations were analyzed by the 4-aminoantipyrine spectrophotometric method at the characteristic optical absorption (510 nm) of phenol with a Shimadzu UV-2550 spectrophotometer.The photocatalytic experiment for hydrogen production was conducted in an inline hydrogen production system (AuLight, Beijing, CEL-SPH2N). The photocatalyst powder (0.1 g) was suspended in a mixture of distilled water (80 mL), methanol (20 mL) and 1.0 wt% Pt from Pt(cod)2 in the reaction cell using a magnetic stirrer. Prior to the reaction, the mixture was deaerated by evacuation to remove O2 and CO2 dissolved in water. The reaction was carried out by irradiating the mixture with light from a xenon lamp (300 W). Gas evolution was observed under photoradiation and was analyzed by an online gas chromatograph (SP7800, TCD, molecular sieve 5 Å, N2 carrier, Beijing Keruida Limited).
Analysis of hydroxyl radical
0.04 g of sample was dispersed in 120 mL of 1 × 10⁻³ M coumarin aqueous solution in a quartz reactor. At a given irradiation time, a certain amount of the solution was transferred into a Pyrex glass cell for the fluorescence measurement of 7-hydroxycoumarin at around 456 nm under the light excitation of 332 nm with a spectrofluorometer (PerkinElmer LS 55).Results and discussion
Structural characterization and morphology
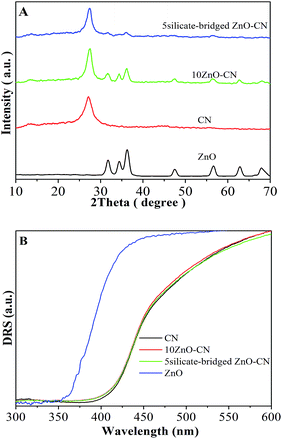
The XRD peaks at 31.8°, 34.3°, 36.5°, 47.3°, 56.5°, and 62.8° correspond to the (100), (002), (101), (102), (110) and (103) planes of ZnO,17–20 and the diffraction peaks at 27.3° and 13.1° result from the crystal planes of (002) and (100) of g-C3N4, respectively.5,8,12 Thus, it is confirmed from the XRD patterns (Fig. 1A and S1A†) that ZnO and g-C3N4 exist, and no other phase is present. In addition, the phase composition and crystallinity (Fig. S1B†) of ZnO and g-C3N4 is almost unchanged after capping ZnO with silicate groups in advance. In addition, it is confirmed from the DRS spectra (Fig. 1B, and S2†) that the band gap energy of g-C3N4 is about 2.7 eV, and it is almost unchanged after coupling with the uncapped and silicate-capped ZnO.One can notice from the TEM images (Fig. S3†) that the spherical ZnO nanoparticle is about 6 nm size (Fig. S3D†). This is in agreement with the crystallite size calculated using the Scherrer formula based on the XRD data. The nanocrystalline ZnO is dispersed on the surfaces of the slice-like g-C3N4. Moreover, intimate heterojunctions between ZnO and g-C3N4 are formed, as seen in the HRTEM image in the inset, in which the facet distances of 0.336 and 0.238 nm correspond to g-C3N4 (002)5 and ZnO (002).17–20 After capping ZnO with silicate groups in advance, the formed junction situation does not change evidently. From the FTIR spectra (Fig. S4†), it can be seen that the characteristic bands in the 1200–1700 cm−1 region dominate the spectrum, with peaks appearing at 1235, 1322, 1423, 1572, and 1640 cm−1, which are assigned to the stretching modes of g-C3N4 heterocycles, and also the characteristic breathing mode of triazine units at 806 cm−1 is observed.5 For pure ZnO, the broad and weak band around 532 cm−1 can be attributed to the Zn–O bond, and the band around 3430 cm−1 corresponds to physical-absorbed H2O.21 Interestingly, after modification with silicate groups, a new FTIR peak at about 1000 cm−1 was seen, and its intensity gradually becomes larger with an increase in the silicate group content, which is attributed to the O–Si–O groups.34 Thus, it is deduced that the silicate group (O–Si–O) linkers, which act as bridges, are built in the formed heterojunctions between ZnO and g-C3N4. This would improve the connection between the two parts in the fabricated nanocomposites, which is favorable for charge transfer and separation.
Photogenerated charge properties
Steady-state surface photovoltage spectroscopy (SS-SPS) is a reliable and sensitive method to explore directly the properties of the photogenerated charges of solid semiconducting materials.35 It is generally accepted that the SS-SPS response of a nanosized semiconductor mainly results from photogenerated charge separation via the diffusion process.36,37As shown in Fig. 2A and S5,† the SS-SPS response gradually becomes stronger with increase in the content of O2 in the atmosphere for g-C3N4, ZnO/g-C3N4 and silicate-bridged ZnO/g-C3N4, which indicates that the introduction of ZnO or silicate-capped ZnO does not change the SPS attribute of g-C3N4, and it means that the larger the O2 content is, the stronger is the SPS response. This is because of the fact that adsorbed O2 can capture photogenerated electrons and make the produced holes preferentially diffuse to the testing electrodes. Notably, it can be seen that there is no SPS response in N2 atmosphere for CN, whereas for the 10ZnO–CN nanocomposite, it exhibits an evident SPS response, which clearly indicate that the transfer process of photogenerated charges of g-C3N4 to ZnO takes place to promote charge separation. Interestingly, the silicate-bridged ZnO/g-C3N4 nanocomposite (5silicate-bridged ZnO–CN) exhibits a stronger SS-SPS response than the ZnO/g-C3N4 nanocomposite (10ZnO–CN) in N2. This clearly demonstrates that the built silicate bridges are favorable for charge transfer and separation by improving the heterojunction connection.
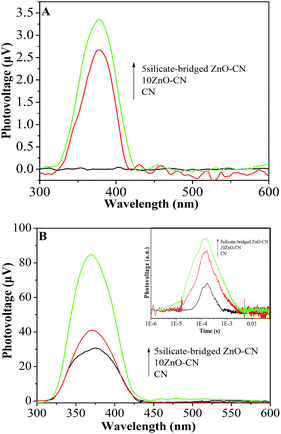 | ||
| Fig. 2 SS-SPS responses of CN, 10ZnO–CN and 5silicate-bridged ZnO–CN in N2 (A) and in air (B) with TS-SPV responses in air as the inset. | ||
It can be seen from Fig. 2B and S6† that the SPS response of g-C3N4 in air is enhanced after coupling with an appropriate amount of nanocrystalline ZnO, especially with the silicate-capped ZnO. For the ZnO/g-C3N4 nanocomposites, the 10ZnO–CN nanocomposite exhibits the strongest SS-SPS response, and the SS-SPS response of the 5silicate-bridged ZnO–CN nanocomposite is the strongest for the silicate-bridged nanocomposites. In this case, it is acceptable that the strong SS-SPS response corresponds to high charge separation. It is worthy to note that the TS-SPV signal of g-C3N4 (the inset in Fig. 2B) is enhanced after coupling with the nanocrystalline ZnO, along with a prolonged carrier lifetime by ∼ms, especially with the silicate-capped ZnO. This is in good agreement with the SS-SPS result. However, if the amount of ZnO or silicate used is exceeded, the related SS-SPS response decreases. This is mainly because the excess ZnO and silicate are unfavorable for charge transportation.
Photocatalytic activities
To investigate the photocatalytic activities of the nanocomposites, PEC experiments were carried out in advance. As shown in Fig. S7,† the 10ZnO–CN film displays a larger photocurrent density than the bare g-C3N4 film, and the 5silicate-bridged ZnO–CN film has the largest photocurrent density of all. The photocurrent density of the 5silicate-bridged ZnO–CN film is larger by about 4 times compared with that of the others at the applied voltage of 0.4 V. This heralds that the photoactivity of g-C3N4 is improved greatly by the introduction of the silicate bridge. In addition, from the EIS Nyquist plots (the inset in Fig. S7†), it is seen that the 5silicate-bridged ZnO–CN film shows a reduced capacitive arc radius compared with the 10ZnO–CN and CN films, which indicates that the introduced silicate bridge is favorable for charge transportation under irradiation.Along with the SS-SPS and TR-SPV results mentioned above, it is confirmed that the photogenerated charge separation of g-C3N4 can be enhanced by coupling with an appropriate amount of nanocrystalline ZnO, especially with the silicate-capped ZnO. Thus, it is anticipated that the silicate-bridged ZnO/g-C3N4 nanocomposite would exhibit enhanced photocatalytic activities compared with the bare g-C3N4 and ZnO/g-C3N4 nanocomposite. As expected, one can see from Fig. 3A and S8† that the photocatalytic activity of g-C3N4 for the degradation of liquid-phase phenol under UV-Vis irradiation is increased after coupling with an appropriate amount of ZnO. Interestingly, the activity of silicate-bridged ZnO/g-C3N4 nanocomposite is considerably higher than that of ZnO/g-C3N4 nanocomposite (10ZnO–CN) and even 4 times higher compared to bare g-C3N4 (CN). In addition, the experimental results show that the degradation rates of phenol by photolysis in the absence of the catalyst under irradiation from a xenon lamp and by adsorption in the presence of the catalyst without irradiation are negligible, compared to that by the photocatalytic process. Moreover, no loss of the photocatalytic activity of 5silicate-bridged ZnO–CN is observed for phenol degradation after five cycles, as shown in Fig. S8C.† This means that the introduced silicate group is stable during prolonged reactions. The photocatalytic activity results are further supported by the photocatalytic water splitting experiment to produce H2 with Pt as a co-catalyst in an ethanol–water system, as shown in Fig. 3B. It is clearly demonstrated that the activity of the ZnO/g-C3N4 nanocomposite for H2 production is higher than that of bare g-C3N4, especially for that of the silicate-bridged nanocomposite. Noticeably, the photocatalytic activity is consistent with the corresponding SPS intensity, which indicates that the photocatalytic activity mainly depends on the photogenerated charge separation.
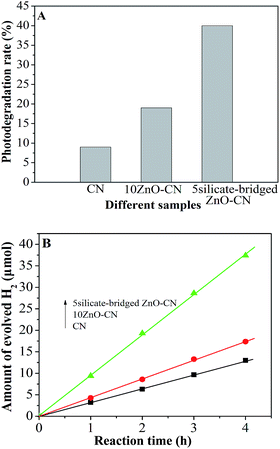 | ||
| Fig. 3 Photocatalytic activities for the degradation of phenol (A) and the production of H2 (B) in CN, 10ZnO–CN and 5silicate-bridged ZnO–CN. | ||
Discussion
In order to further reveal the enhanced photocatalytic activity mechanism of the silicate-bridged ZnO/g-C3N4 nanocomposites, measurements to detect the formation of the hydroxyl radical on the different samples after irradiation were performed (Fig. 4). Generally speaking, the hydroxyl radical (˙OH) is a key active species in photocatalytic processes, and the coumarin fluorescent method, which is a highly sensitive technique, is widely used to detect the amount of ˙OH, in which the introduced coumarin easily reacts with ˙OH to produce luminescent 7-hydroxycoumarin. From Fig. 4, it is evident that the amount of ˙OH produced on 10ZnO–CN is larger than that of CN, and 5silicate-bridged ZnO–CN had the largest amount. This is in good agreement with the SPS and photocatalytic activity results.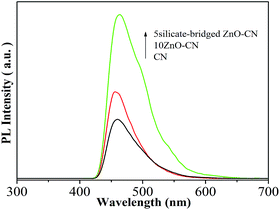 | ||
| Fig. 4 Fluorescence spectra related to the amounts of hydroxyl radical formed for CN, 10ZnO–CN and 5silicate-bridged ZnO–CN after irradiation for 1 h. | ||
On the basis of the above-mentioned results, a schematic mechanism is shown in Fig. 5. For g-C3N4 and ZnO, the conduction band potentials are located at −1.3 eV and −0.16 eV, respectively, whereas the valence band potentials are at 1.4 eV and 2.16 eV, all versus NHE.5,21 It is clear that when g-C3N4 is excitated under illumination, photogenerated electrons and holes are generated. Theoretically, it is active for the production of H2 and degradation of pollutants because of its suitable band positions. If there is g-C3N4 alone, the photogenerated carriers quickly recombine so as to greatly decrease the reaction activity. On the other side, if ZnO is coupled, the photogenerated electrons transfers from the higher conduction band of g-C3N4 to the lower conduction band of ZnO so as to prolong the lifetime and to promote the separation of the photogenerated carriers. As expected, the photocatalytic performance of ZnO/g-C3N4 is further improved by the introduction of silicate groups. It is mainly attributed to the introduced silicate that acts as electronic bridges. Thus, the built silicate bridges promote the transfer of photogenerated electrons to a great extent, so as to prolong the lifetime and enhance the separation of the photogenerated charge carriers of g-C3N4.
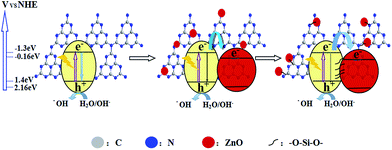 | ||
| Fig. 5 Schematic of the transfer and separation of photogenerated charges in the silicate-bridged ZnO/g-C3N4 nanocomposite. | ||
Conclusions
In this work, it is demonstrated that the separation of photogenerated charges of g-C3N4 is enhanced by coupling with an appropriate amount of nanocrystalline ZnO, which leads to enhanced photocatalytic activities for the degradation of phenol and production of H2. Interestingly, it is concluded for the first time that the introduction of a silicate bridge in the fabricated ZnO/g-C3N4 nanocomposite is highly favourable for charge transfer and separation, and is responsible for the higher photocatalytic activity of the silicate-bridged ZnO/g-C3N4 nanocomposite than that of ZnO/g-C3N4 nanocomposite, even 4 times higher compared with g-C3N4. Therefore, it is suggested that built bridges with silicate groups are beneficial to improve the heterojunctional connection between different constituents so as to enhance photocatalytic performance. This provides a feasible strategy to design and synthesize high-performance nanocomposite photocatalysts for the degradation of pollutants and water splitting.Acknowledgements
This work was supported by the Key NSFC Project (U1401245), the National Key Basic Research Program of China (2014CB660814), the Program for Innovative Research Team in Chinese Universities (IRT1237), the Research Project of Chinese Ministry of Education (213011A), the Specialized Research Fund for the Doctoral Program of Higher Education (20122301110002), the Natural Science Foundation of Heilongjiang Province for Youths (QC2012C077), and the Science Foundation for Excellent Youth of Harbin City of China (2014RFYXJ002).Notes and references
- I. Suil, O. Alexander, B. Regina, G. Felipe, P. J. Sergio, S. T. Mintcho, S. W. Dominic and M. L. Richard, J. Am. Chem. Soc., 2007, 129, 13790 CrossRef PubMed.
- Y. J. Zhang and M. Antonietti, Chem.–Asian J., 2010, 5, 1307 CAS.
- D. Noto and V. E. Negro, Electrochim. Acta, 2010, 55, 7564 CrossRef PubMed.
- J. S. Zhang, X. F. Chen, K. Takanabe, K. Maeda, K. Domen, J. D. Epping, X. Z. Fu, M. Antonietti and X. C. Wang, Angew. Chem., 2010, 49, 441 CrossRef CAS PubMed.
- X. C. Wang, K. Maeda, A. Thomas, K. Takanabe, G. Xin, J. M. Carlsson, K. Domen and M. A. Antonietti, Nat. Mater., 2009, 8, 76 CrossRef CAS PubMed.
- S. C. Yan, Z. S. Li and Z. G. Zou, Langmuir, 2009, 25, 10397 CrossRef CAS PubMed.
- G. Liu, P. Niu, C. H. Sun, S. C. Smith, Z. G. Chen, G. Q. Lu and H. M. Cheng, J. Am. Chem. Soc., 2010, 132, 11642 CrossRef CAS PubMed.
- L. Ge, C. C. Han, J. Liu and Y. F. Li, Appl. Catal., A, 2011, 409, 215 CrossRef PubMed.
- F. Goettmann, A. Fischer, M. Antonietti and A. Thomas, Angew. Chem., 2006, 45, 4467 CrossRef CAS PubMed.
- L. Ge, F. Zuo, J. K. Liu, Q. Ma, C. Wang, D. Z. Sun, L. Bartels and P. Y. Feng, J. Phys. Chem. C, 2012, 116, 13708 CAS.
- Y. J. Zhang, A. Thomas, M. Antonietti and X. C. Wang, J. Am. Chem. Soc., 2009, 131, 50 CrossRef CAS PubMed.
- S. C. Yan, S. B. Lv, Z. S. Li and Z. G. Zou, Dalton Trans., 2010, 1488 RSC.
- L. Ge, C. C. Han and J. Liu, Appl. Catal., B, 2011, 108, 100 CrossRef PubMed.
- N. Yang, G. Q. Li, W. L. Wang, X. L. Yang and W. F. Zhang, J. Phys. Chem., 2011, 72, 1319 CAS.
- Y. Liu, G. Chen, C. Zhou, Y. D. Hu, D. G. Fu, J. Liu and Q. Wang, J. Hazard. Mater., 2011, 190, 75 CrossRef CAS PubMed.
- Y. J. Zhang, T. Mori, L. Niu and J. H. Ye, Energy Environ. Sci., 2011, 4, 4517 CAS.
- X. S. Fanj and L. D. Zhang, J. Mater. Sci. Technol., 2006, 22, 721 Search PubMed.
- D. Moore and Z. L. Wang, J. Mater. Chem., 2006, 16, 3898 RSC.
- X. Fang, Y. Bando, U. K. Gautam and D. Golberg, Curr. Opin. Solid State Mater. Sci., 2009, 34, 190 CAS.
- J. Schrier, D. O. Demchenko and L. W. Wang, Nano Lett., 2007, 7, 2377 CrossRef CAS PubMed.
- M. Y. Lu, J. Song, M. P. Lu, C. Y. Lee, L. J. Chen and Z. L. Wang, ACS Nano, 2009, 3, 357 CrossRef CAS PubMed.
- Y. M. He, Y. Wang, L. H. Zhang, B. Tenga and M. Fana, Appl. Catal., B, 2015, 1, 168–169 Search PubMed.
- J. X. Sun, Y. P. Yuan, L. G. Qiu, X. Jiang, A. J. Xie, Y. H. She and J. F. Zhu, Dalton Trans., 2012, 41, 6756 RSC.
- S. Kumar, A. Baruah, S. Tonda, B. Kumar, V. Shanker and B. Sreedharc, Nanoscale, 2014, 6, 4830 RSC.
- J. W. Zhou, M. Zhang and Y. F. Zhu, Phys. Chem. Chem. Phys., 2014, 16, 17627 RSC.
- X. F. Li, M. Li, J. H. Yang, X. Y. Li, T. J. Hu, J. S. Wang, Y. R. Sui, X. T. Wu and L. G. Kong, J. Phys. Chem. Solids, 2014, 75, 441–446 CrossRef CAS PubMed.
- Y. J. Wang, R. Shi, J. Lin and Y. F. Zhu, Energy Environ. Sci., 2011, 4, 2922–2929 CAS.
- W. Liu, M. Wang, C. Xu and S. Chen, Chem. Eng. J., 2012, 209, 386 CrossRef CAS PubMed.
- J. P. Ge, Q. Zhang, T. R. Zhang and Y. D. Yin, Angew. Chem., 2008, 120, 9056–9060 CrossRef PubMed.
- M. Hirano, K. Ota and H. Iwata, Chem. Mater., 2004, 16, 3725–3732 CrossRef CAS.
- C. Xie, Z. L. Xu, Q. J. Yang, B. Y. Xue, Y. G. Du and J. H. Zhang, Mater. Sci. Eng., B, 2004, 112, 34–41 CrossRef PubMed.
- X. D. Fu, M. Z. Xie, P. Luan and L. Q. Jing, ACS Appl. Mater. Interfaces, 2014, 6, 18550 CAS.
- S. C. Yan, Z. S. Li and Z. G. Zou, Langmuir, 2009, 25, 10397 CrossRef CAS PubMed.
- F. Rubio, J. Rubio and J. L. Oteo, Spectrosc. Lett., 1998, 31, 199 CrossRef CAS.
- L. Kronik and Y. Shapira, Surf. Sci. Rep., 1999, 37, 1 CrossRef CAS.
- Y. H. Lin, D. J. Wang, Q. D. Zhao, M. Yang and Q. L. Zhang, J. Phys. Chem. B, 2004, 108, 3202 CrossRef CAS.
- H. L. Zhou, Y. Q. Qu, T. Zeid and X. F. Duan, Energy Environ. Sci., 2012, 5, 6732 CAS.
Footnote |
| † Electronic supplementary information (ESI) available: Fig. S1 XRD patterns of XZnO–CN (A) and Ysilicate-bridged ZnO–CN (B); Fig. S2 DRS spectra of XZnO–CN (A) and Ysilicate-bridged ZnO–CN (B); Fig. S3 TEM images of CN (A), 10ZnO–CN (B), 5silicate-bridged ZnO–CN (C) and low resolution TEM image of 5silicate-bridged ZnO–CN (D) (inset indicates HRTEM images of CN, 10ZnO–CN and 5silicate-bridged ZnO–CN); Fig. S4 FTIR spectra of ZnO, 10ZnO–CN, Ysilicate-bridged ZnO–CN and the inset is the local amplification of the wavenumber of 800–1150; Fig. S5 SS-SPS responses of CN (A), 10ZnO–CN (B) and 5silicate-bridged ZnO–CN in different atmospheres; Fig. S6 SS-SPS responses of XZnO–CN (A) and Ysilicate-bridged ZnO–CN (B) in air; Fig. S7 I–V curves and the inset is the electrochemical impedance spectra (EIS) under irradiation; Fig. S8 photocatalytic degradation rates of phenol of XZnO–CN (A), Ysilicate-bridged ZnO–CN (B) and the repeated processes of 5silicate-bridged ZnO–CN for photodegradation of phenol (C). See DOI: 10.1039/c5ra01824b |
| This journal is © The Royal Society of Chemistry 2015 |

