
Effective adsorption of toxic brilliant green from aqueous solution using peat of Brunei Darussalam: isotherms, thermodynamics, kinetics and regeneration studies
Hei Ing Chienga,
Namal Priyanthabc and
Linda B. L. Lim*a
aDepartment of Chemistry, Faculty of Science, Universiti Brunei Darussalam, Jalan Tungku Link, Gadong, Negara Brunei Darussalam. E-mail: linda.lim@ubd.edu.bn; Fax: +673-2461502; Tel: +673-8748010
bDepartment of Chemistry, Faculty of Science, University of Peradeniya, Peradeniya, Sri Lanka
cPostgraduate Institute of Science, University of Peradeniya, Peradeniya, Sri Lanka
First published on 8th April 2015
Abstract
Peat, a natural adsorbent, has been successfully used for the removal of the hazardous water-soluble cationic dye, brilliant green (BG). Characterization of peat was carried out by determining its physical and chemical compositions such as moisture, ash, carbon%, hydrogen%, nitrogen%, and sulphur% (CHNS), crude protein and crude fat. X-ray fluorescence (XRF) was used for the determination of the percentage of elements present in peat. Functional groups present in peat were analyzed using Fourier transform infra-red (FTIR). Changes in the surface morphology of peat before and after treatment with BG were studied using Scanning Electron Microscopy (SEM). The optimization time required for establishment of an adsorption equilibrium is determined to be 2.0 h. The ambient pH of BG was used throughout the study. Adsorption isotherm models such as Langmuir, Freundlich, Halsey, Temkin, Redlich–Peterson (R–P) and Sips were simulated to fit with the experimental equilibrium data. Based on linear regression, simulated isotherm models and error analyses, the R–P isotherm fitted well for the adsorption of BG by peat. Adsorption kinetics was found to follow the pseudo second order model, with a rate constant of 0.39 g mmol−1 min−1. BG-loaded peat was successfully regenerated using 0.01 M sodium hydroxide (NaOH) solution for up to 5 consecutive cycles, while maintaining high adsorption ability of 98% even after the 5th cycle.
1. Introduction
Industrial applications of dyes and pigments have increased tremendously over the past few decades,1,2 and consequently, industrial wastewater is contaminated with such substances. Among many methods, adsorption is an alternative technology for the removal of dyes from wastewater due to its low cost, ease of operation, energy saving potential and high efficiency.3 This technique has been successfully used for the removal of various dyes on low-cost adsorbents namely methylene blue by peels of breadnut and Tarap,4,5 reactive navy blue dye by powdered orange waste,6 methyl violet by Casuarina equisetifolia needles,7 direct red by Pseudomonas putida,8 Bismark brown R by hen feathers9 and acid red 14 on surface soils.10In this study, peat was selected as an adsorbent for brilliant green (BG) in wastewater. BG, structure shown in Fig. 1, is a triarylmethane cationic dye and in dry form is an odourless yellowish-green solid powder. It is commonly used as a biological stain, dermatological agent, veterinary medicine, and as an additive to poultry to prevent mould, intestinal parasites and fungus.11 BG is also used as an indicator which changes color from yellow to green at pH 2.6.12 Human contact with BG might cause irritation to human gastrointestinal tract, respiratory tract, nausea, vomiting, diarrhoea, causing coughing and shortness of breath. BG can also cause skin irritation which in turn might cause redness and pain to human.11,13
 | ||
| Fig. 1 Chemical structure of brilliant green (BG). | ||
In Brunei Darussalam, it is reported that approximately 100![[thin space (1/6-em)]](https://www.rsc.org/images/entities/char_2009.gif) 000 ha (18%) of land area is made up of peat soils and is mostly untouched.14,15 Peat is a dark brown soil and is made up of vegetative remains of the partial decomposition of leaves, plants, tress or mosses. As peat soil in Brunei Darussalam is low cost and easily available, its adsorption properties on BG were explored in this research. To date, no study has been reported on the use of peat to remove BG. Parameters such as contact time and pH were determined for the most efficient removal of the dye. The pH of dye solutions is an important parameter to be considered in an adsorption process because many reactions, such as ionization, protonation, dissociation of functional groups on the active sites of the adsorbent are pH dependent.13,16,17 Various salts present in dye wastewater often lead to high ionic strength and could affect the adsorption capacity of an adsorbent. Therefore, there is a need to study the effect of ionic strength on the adsorption of BG on peat. Equilibrium studies were carried out by comparing the adsorption data with isotherm models, such Langmuir, Freundlich, Halsey, Temkin, Redlich–Peterson (R–P) and Sips by using linear and non-linear functions. Determination of various error functions was performed to identify the isotherm model with the best precision. Kinetics studies of BG were examined by using pseudo first order, pseudo second order, Elovich, intraparticle diffusion and Boyd models.
000 ha (18%) of land area is made up of peat soils and is mostly untouched.14,15 Peat is a dark brown soil and is made up of vegetative remains of the partial decomposition of leaves, plants, tress or mosses. As peat soil in Brunei Darussalam is low cost and easily available, its adsorption properties on BG were explored in this research. To date, no study has been reported on the use of peat to remove BG. Parameters such as contact time and pH were determined for the most efficient removal of the dye. The pH of dye solutions is an important parameter to be considered in an adsorption process because many reactions, such as ionization, protonation, dissociation of functional groups on the active sites of the adsorbent are pH dependent.13,16,17 Various salts present in dye wastewater often lead to high ionic strength and could affect the adsorption capacity of an adsorbent. Therefore, there is a need to study the effect of ionic strength on the adsorption of BG on peat. Equilibrium studies were carried out by comparing the adsorption data with isotherm models, such Langmuir, Freundlich, Halsey, Temkin, Redlich–Peterson (R–P) and Sips by using linear and non-linear functions. Determination of various error functions was performed to identify the isotherm model with the best precision. Kinetics studies of BG were examined by using pseudo first order, pseudo second order, Elovich, intraparticle diffusion and Boyd models.
Dye-loaded adsorbents are of no use after adsorption and are either discarded in landfill or incinerated. Both ways are not economical and could be hazardous, toxic, flammable or even explosive if incinerated. Therefore, it is more economical to reuse the dye-saturated adsorbent through regeneration. This in turn will reduce the cost of disposal and subsequently minimize the cost for adsorbent treatment. A superb adsorbent should not only have high adsorption capacity but also high reusable ability which could be recycled or regenerated for various cycles at the same time maintaining its high dye removal capacity. Finally, BG-loaded peat was regenerated using various solvents for the determination of its reusability as a spent adsorbent.
2. Background
Various isotherm models were used in this study for the adsorption of BG on peat. The widely used Langmuir adsorption isotherm is based on the assumption that adsorption takes place at the homogeneous sites and that the adsorbent's surface is saturated after monolayer adsorption.18 Langmuir isotherm is important for the determination of the adsorption capacity of an adsorbent. The values of qmax and kL are calculated from the linear plot of Langmuir isotherm, where qmax (mmol g−1) is the adsorption capacity of peat and the Langmuir constant kL (L mmol−1) is related to both the adsorption capacity and the rate of adsorption.Langmuir isotherm model also showed that the feasibility of adsorption is based on the dimensionless adsorption intensity (RL)19 value given in eqn (1):
 | (1) |
Freundlich isotherm20 is an empirical equation which provides the relationship between the adsorption of peat and the equilibrium concentration of the dye based on multilayer adsorption. The value of kF (mmol g−1) represents the Freundlich isotherm constant describing the amount of dye adsorbed on the adsorbent at equilibrium stage, while n is related to the adsorption intensity of an adsorption process.
Halsey isotherm21 model was applied to provide better insight on the multilayer adsorption of adsorbate on adsorbent.
Temkin isotherm22 assumes the heat of adsorption decreases linearly with the coverage due to the adsorbate–adsorbent interactions and the adsorption is characterized by uniform distribution of binding energies (up to some maximum binding energies). kT is the equilibrium binding constant (L mmol−1) corresponding to the maximum binding energy, constant B is related to the heat of adsorption, R is gas constant (8.314 J mol−1 K−1) and T is absolute temperature at 298 K.
Redlich–Peterson (R–P) isotherm23 is another three parameters isotherm, which combines both Langmuir and Freundlich equations, in which the mechanism of adsorption is a hybrid and does not follow ideal monolayer adsorption. The equation reduces to Freundlich isotherm at high concentration and reduces to Henry's equation at low concentration. R–P isotherm constants are obtained by maximizing the R2 value of the linear plot, ln[kR(Ce/qe) − 1] vs. lnCe through kR, using Microsoft Excel. kR (L g−1) and aR (L mmol−1) represent the R–P isotherm constants and g is the exponent lies between 0 and 1.
Sips isotherm24 is a three parameter isotherm model, combining both Langmuir and Freundlich isotherms. At low dye concentrations, it reduces to Freundlich isotherm and at high dye concentration, the equation turned to Langmuir isotherm, predicting a monolayer adsorption.
Table 1 lists standard equations and linearized forms of the six isotherms. Five different error functions, namely average relative error (ARE), sum square error (ERRSQ), hybrid fractional error function (HYBRID), sum of absolute error (EABS), Marquardt's percent standard deviation (MPSD) and Non-linear chi-square test (χ2) of non-linear regression used in this study are given in Table 2.
| Isotherm model | Equations | Linearized | Plot |
|---|---|---|---|
| Langmuir |  |
 |
Ce/qe vs. Ce |
| Freundlich |  |
 |
lnqe vs. lnCe |
| Halsey |  |
 |
lnqe vs. lnCe |
| Temkin |  |
qe = BlnkT + BlnCe |
qe vs. lnCe |
| R–P |  |
 |
 |
| Sips |  |
 |
 |
| Type of errors | Equations |
|---|---|
| a qe,calc and qe,meas are the calculated and measured adsorption capacity; n is the number of data points; p is the number of parameters. | |
| Average relative error (ARE) |  |
| Sum square error (ERRSQ) | 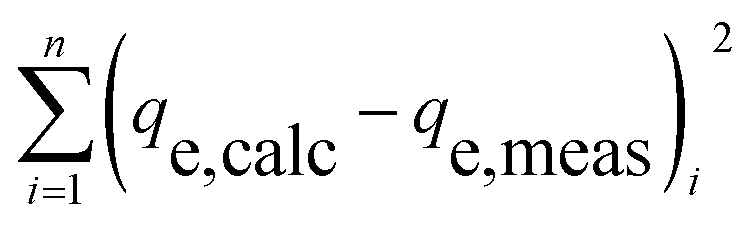 |
| Hybrid fractional error function (HYBRID) |  |
| Sum of absolute error (EABS) |  |
| Marquardt's percent standard deviation (MPSD) |  |
| Non-linear chi-square test (χ2) |  |
Kinetics models such as pseudo first order,25 pseudo second order,26 Elovich,27 Weber–Morris intraparticle diffusion28 and Boyd15 models were used to investigate the mechanism of adsorption system in this study. The kinetics equations are summarized in Table 3, where qe and qt (mmol g−1) are the amount of dye or heavy metal adsorbed at equilibrium and time (t), k1 (min−1), k2 (g mmol−1 min−1) and kid (mg g−1 min−1/2) are the rate constants of pseudo first order, pseudo second order and intraparticle diffusion models. α (mmol g−1 min−1) is the initial sorption rate constant (rate of chemisorption) and β (g mmol−1) is related to surface coverage (desorption constant) for Elovich model. C value for intraparticle diffusion model represents the thickness of the boundary layer effect.
| Kinetics models | Linear equations | Plot |
|---|---|---|
| Pseudo first order |  |
log(qe − qt) vs. t |
| Pseudo second order |  |
t/qt vs. t |
| Elovich | 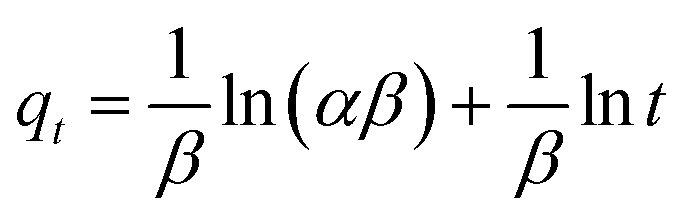 |
qt vs. lnt |
| Intraparticle diffusion model | qt = kidt1/2 + C | qt vs. t1/2 |
| Boyd model | Bt = −0.4977 − In(1 − F) | Bt vs. t |
3. Materials and methods
3.1. Materials
Representative peat samples were collected from Damit (04°N, 114°E) in the Belait District in Brunei Darussalam. Peat was dried in an oven at 60 °C until a constant mass was obtained. Dried samples were sieved to obtain particle sizes between 355 to 850 μm. All experiments in this study were carried out in triplicate at 298 K, unless otherwise stated.3.2. Chemicals and reagents
The adsorbate, BG was purchased from Sigma-Aldrich [C.I.: 42040, chemical formula: C27H34N2O4S, M.W.: 482.63, λmax: 625.0 nm]. A stock solution of BG (1000 mg L−1) was prepared by dissolving accurately weighed amount of dye in double-distilled water. Dye solutions of lower concentrations ranging from 10 to 1000 mg L−1 were obtained by dilution with double-distilled water. The pH of solutions was adjusted using 0.1 M NaOH and 0.1 M HNO3 purchased from Fluka. All chemicals were used without further purification.
3.3. Surface characterization and instrumentation used
Dried peat sample was characterized for its moisture, ash, pH, bulk density, elemental composition (CHNS), crude protein and crude fat using the standard procedures.29 Crude fat and protein of peat sample were analyzed using GerhardT Soxtherm multistate/SX PC, GerhardT Fibretherm FT12 and GerhardT VAP 50S Nitrogen Protein Analyzer, respectively. Elemental percent compositions for C, H, N and S for peat was obtained from the Elemental Analysis Laboratory at the National University Singapore using Elementar Vario Micro Cube. Elemental percent composition of peat before and after BG adsorption were determined by PANalytical Axiosmax X-ray fluorescence (XRF). The pH of the solution was measured using Thermo Scientific Orion 2 Star pH Benchtop pH meter. Morphological characteristics of adsorbent surface were carried out using Tescan Vega XMU Scanning Electron Microscope (SEM) operated at 20 kV accelerated voltage, and SPI-MODULETM Sputter Coater was used to coat the adsorbent.The UV-absorbance of dye solution was measured using Ultraviolet-Visible (UV-Vis) spectrophotometer (Shimadzu/Model UV-1601PC). Fourier transform infra-red (FTIR) spectrophotometer (Shimadzu Model IRPrestige-21) was used to determine the functional groups present in the sample. Morphological characteristics of adsorbent surface were carried out using Tescan Vega XMU Scanning Electron Microscope (SEM) operated at 20 kV accelerated voltage, and SPI-MODULETM Sputter Coater was used to coat the adsorbent.
Surface chemistry of peat was determined by the point of zero charge (pHpzc) using the solid addition method.30 Solutions of different pHs were prepared in 0.1 M KNO3 solution, adjusting its pH at 2, 4, 6, 8, 10 and 12 using 0.1 M HNO3 and 0.1 M NaOH. KNO3 solution (25.0 mL) at each pH was then separately mixed with a pre-weighed peat sample (0.050 g). The solutions were agitated on an orbital shaker at 250 rpm for 24 h at room temperature and the final pH was recorded using a pH meter. A graph of ΔpH(pHfinal − pHinitial) against pHinitial was plotted where pHpzc of peat was taken as the point that passes through the x-axis.
3.4. Adsorption experiments for peat on BG
Optimum contact time was obtained by shaking the mixture at different time ranging from 30 to 240 min. Effect of pH was studied by using the pre-determined contact time periods. For this purpose, pHs of peat-dye suspensions were adjusted by drop wise addition of 0.1 M HNO3 and 0.1 M NaOH solution at different pH values between 2 and 10. Each solution was filtered using fine metal sieve and the filtrate was analyzed.
The mass of adsorbed dye molecules per unit mass (g) of solid at the equilibrium state, qe (mmol g−1) was calculated using the eqn (2):
 | (2) |
The percentage removal (%) of BG was calculated using eqn (3).
 | (3) |
The effect of ionic strength was carried out using different concentrations of KNO3 solutions ranging from 0.01 M to 1.0 M mixed with BG solution of 100 mg L−1. Peat (0.050 g) was treated with each of the KNO3 solutions and shaken for optimum contact at room temperature. The mixture was then filtered and the filtrate was analyzed for remaining dye concentration.
3.5. Regeneration of BG-loaded peat
Regeneration was studied by agitating peat (0.500 g) with 100 mg L−1 BG solution (250 mL) using the optimized contact time so that the active sites were fully saturated with BG. The dye-loaded peat was washed with doubly distilled water to remove the excess BG on the surface and dried overnight at 60 °C. Regeneration was done by using 250 mL of 0.1 M HNO3, 0.01 M NaOH and water. Control was kept to compare the adsorption capacity with the regenerated peat. Regeneration was carried out for five successive adsorption–regeneration cycles and the absorbance of the BG solution was analyzed using UV-Vis spectrophotometer.4. Results and discussion
4.1. Characterization and surface chemistry of peat
As shown in Table 4, peat contains approximately 7.11% crude protein and 1.12% crude fat. Elemental characterization using XRF, as shown in Table 5, indicated that the major elements found in peat are oxygen (O), iron (Fe), zinc (Zn) and silicon (Si) in addition to many other minor elements.| Element | Concentration (%) | |
|---|---|---|
| Peat | BG-loaded peat | |
| O | 34.95 | 28.28 |
| Fe | 20.16 | 28.18 |
| Zn | 19.01 | 32.85 |
| Si | 10.74 | 2.08 |
| Ca | 6.36 | 2.95 |
| Al | 2.03 | 0.63 |
| S | 1.96 | 1.78 |
| Ru | 1.41 | 1.77 |
| K | 0.87 | 0.12 |
| P | 0.76 | 0.51 |
| Cl | 0.65 | 0.46 |
| Mg | 0.5 | 0.16 |
| Na | 0.47 | — |
| Br | 0.09 | 0.18 |
| Sr | — | 0.07 |
After adsorption with BG, great reduction was seen for Ca (6.36 to 2.95%) and Si (10.74 to 2.08%), while the elements Al, Cl, K, Mg, P and S showed little decrease after BG adsorption. Such decrease could be due to metal replacement. Previous reports have attributed decrease in metal ions after adsorption process as a result of replacement by adsorbates such as cationic dyes.4,5,15 On the other hand, the element Zn increased after dye adsorption and explanation to this finding is currently beyond the scope of this work. However, similar observations have been reported where an increase in Zn after adsorption process was observed for adsorbents such as Stenochlaena palustris (Burm.f.) Bedd31 and Artocarpus camansi.32
The point of zero charge (pHpzc) is the pH at which there is no net charge on the surface of the adsorbent.34 The pHpzc of peat is determined to be 2.80 from the plot of ΔpH vs. pHinitial (Fig. 2), indicating that at pH < 2.80, the surface of the peat would be positively charged and at pH > 2.80, it would be negatively charged. The pHpzc of peat experimentally determined in this research is similar to that of algal biomass,35 which also has a high organic matter content. Above the pHpzc, the pH of the peat suspension if greater than the initial pH, suggesting that there is a tendency for the peat surface to become negatively charged with exposed hydroxyl groups, promoting the adsorption of cationic dyes, such as BG. However, this trend is altered after pH = 8, probably due to the denaturing effect of peat at high basic values.
 | ||
| Fig. 2 Point of zero charge of peat using 0.10 M KNO3 solution. | ||
4.2. Optimization of parameters
 | ||
| Fig. 3 Effect of shaking time (♦) on the adsorption of BG on peat (355 μm < d < 850 μm; concentration of dye: 10 mg L−1; mass of peat: 0.050 g; volume of solution: 25.0 mL). | ||
Rapid adsorption at the initial stage is due to the availability of large amount of surface sites for adsorption, resulting in BG molecules being adsorbed onto the external surface of peat through boundary layer adsorption.36 As the contact time increases, the surface of peat gets saturated. Hence, there is limited number of surface sites available for dye adsorption, due to the presence of some repulsive forces forming between BG molecules on the surface of peat and BG molecules present in the solution.11,13 In the second stage, BG molecules diffused deeper into the micropores of peat, which makes the process slower, thereby BG molecule is aggregated at higher contact time.11 Therefore, the optimum adsorption equilibrium for peat – dye system is established at a contact period of 2.0 h.
The contact time of for the removal of BG molecules on other natural adsorbents such as Citrus limetta peel (4 h),37 rice husk ash (5 h),16 bottom ash (6 h),12 deoiled soya (6 h)12 and Saklikent mud (6 h),38 are longer than that of peat, indicating that peat is efficient for dye removal if applied in real life wastewater treatment.
 | ||
| Fig. 4 UV-Vis spectra of BG solution at different pHs. | ||
The effect of solution pH on BG adsorption can be partially explained using the information of pHpzc of peat (2.80) and pKa (4.93 and 2.62) values of BG, which are related to the ionization of the dye functional groups.40 When pH is decreased from 4 to 2, the fact that pH < pHpzc = 2.80, leads to the competition of H+ ions with bulky BG molecules for limited surface sites causing the reduction in dye removal. Increase in the extent of removal when pH is increased is due to the opposite effect as pH > pHpzc leads to negative charges on the surface of the adsorbent, promoting uptake of cationic dyes and the dye cations are positively charged when pH > pKa. Little decrease observed at pH = 10 (95%) can be attributed to high OH− concentration which would inhibit the dye to adsorb onto the peat surface as was reported for other dyes with Arundo donax root41 and Citrus limetta peel.37
Effect of pH was carried out by adjusting BG solution pH from 3 to 10 and 98 to 99% removal of the dyes was obtained between 4 and 9 as shown in Fig. 5. Because the ambient pH at 4.9 leads to the maximum removal of 99% under the experimental conditions employed, no adjustment to pH is recommended for the adsorption study. A similar result17 was found for the removal of BG by white rice husk ask, where no adjustments of pH were needed.
 | ||
| Fig. 5 Effect of pH on the removal of BG by peat (355 μm < d < 850 μm; concentration of dye: 10 mg L−1; mass of peat: 0.050 g; volume of solution: 25.0 mL). | ||
Thermodynamic parameters such as Gibbs free energy (ΔG°), enthalpy change (ΔH°) and entropy change (ΔS°) were estimated for BG adsorption on peat. ΔG° values at different temperatures ranging 298 to 344 K were calculated using eqn (4),
|
ΔG° = −RTlnKc
| (4) |
 | (5) |
Enthalpy (ΔH°) and entropy (ΔS°) values of BG on peat was determined from slope (−ΔH°/R) and intercept (ΔS°/R) of the plot of lnKc vs. 1/T (Fig. 6). The calculated parameters are given in Table 6.
 | ||
| Fig. 6 Thermodynamics plot of lnKc vs. 1/T. | ||
| T (K) | ΔG° (kJ mol−1) | ΔS° (J mol−1 K−1) | ΔH° (kJ mol−1) |
|---|---|---|---|
| 298 | −4.8 | 175.7 | 47.0 |
| 314 | −8.9 | ||
| 324 | −10.7 | ||
| 334 | −11.0 | ||
| 344 | −13.2 |
The negative values of ΔG° indicated that the adsorption process of BG on peat is spontaneous and feasible within the temperature range of investigation. Further having ΔG° between 0 to −20 kJ mol−1 signifies that the adsorption of BG on peat is a physisorption process, similar to the adsorption of BG on red clay43 and basic dye using Luffa cylindrical.44 Positive value of ΔH° (47.0 kJ mol−1) indicates that the reaction is endothermic. Having ΔH° > 8 kJ mol−1, also verifies that the adsorption of BG on peat is a physical process.13,43 This is also supported by the increase of dye uptake (100 mg L−1 BG: 88 to 99%) with the rise of solution temperature (298 to 344 K), which further supports the endothermic behavior described earlier.
 | ||
| Fig. 7 Effect of ionic strength on the removal of BG by peat (355 μm < d < 850 μm; concentration of dye: 100 mg L−1; mass of peat: 0.050 g; volume of solution: 25.0 mL). | ||
4.3. Adsorption isotherms
Sorption isotherm equations were used to estimate the amount of peat sorbent to sorb dye molecules in solution and providing explanation for the interaction of peat and dye molecules. Different isotherm models such as the Langmuir, Freundlich, Halsey, Temkin, Redlich–Peterson (R–P) and Sips were applied in this study for BG solution of initial concentration between 0 and 1000 mg L−1. The isotherms equations and the linearized form used for regression analysis are shown in Tables 1 and 2. The relationship between the extent of adsorption and the initial concentration is shown in Fig. 8. | ||
| Fig. 8 Adsorption isotherm of BG by peat at 298 K (355μm < d < 850 μm; mass of peat: 0.050 g; volume of solution: 25.0 mL). | ||
Isotherm parameters calculated from its linear plot are shown in Table 7. High R2 (0.92) showed that the Langmuir isotherm model fitted well to the adsorption process between BG and peat, obtaining a maximum adsorption capacity (qmax) of 0.55 mmol g−1 (265.47 mg g−1). The RL values calculated for the adsorption of BG for many concentrations lie between 0 and 1, suggesting the adsorption of BG on the surface of peat was favorable.
| Model | Parameter | |
|---|---|---|
| Langmuir | qmax (mmol g−1) | 0.55 |
| kL (L mmol−1) | 0.02 | |
| R2 | 0.92 | |
| Freundlich | kF (mmol g−1) | 0.04 |
| n | 2.52 | |
| 1/n | 0.40 | |
| R2 | 0.99 | |
| Halsey | n | 2.52 |
| kH (L mmol−1) | 0.0003 | |
| R2 | 0.99 | |
| Temkin | kT (L mmol−1) | 0.62 |
| bT (J mol−1) | 32314.25 |
|
| R2 | 0.86 | |
| R–P | kR (L g−1) | 8.00 |
| g | 0.60 | |
| aR (L mg−1) | 200.31 | |
| R2 | 0.99 | |
| Sips | qmax (mmol g−1) | 1.00 |
| kS (L mmol−1) | 0.04 | |
| n | 1.98 | |
| 1/n | 0.51 | |
| R2 | 0.96 |
According to the adsorption data in Table 7, the Freundlich isotherm model also fits well (R2 = 0.99) to the adsorption data, having n > 1, indicating a favorable adsorption. The surface heterogeneity of an adsorbent is represented by using 1/n value, in which the adsorption is considered favorable and heterogeneous when the value of 1/n lies between 0 and 1, the adsorption is homogenous in which there is no interaction among the adsorbed species when 1/n = 1 and the adsorption is unfavorable when 1/n > 1.46 In this case, the value of 1/n is 0.40; this value implies only 40% of active adsorption sites having equal energy level, indicating that there is a possibility of multilayer adsorption of BG on the heterogeneous sites of peat.47 As implied by Mane and Babu,11 1/n = 0.40 implied that there are 40% of active adsorption sites having equal energy level. Hence, the surface heterogeneity of peat could be due to the presence of different types of cations, surface charges and crystal edges on peat.48
Similar to the Freundlich isotherm model, the Halsey isotherm model also fits well to the adsorption data (R2 = 0.99), signifying that BG follows multilayer adsorption on peat. This phenomenon is further confirmed by evaluating the coverage factor,43,49 which is the fraction of the peat surface covered by BG molecules, using eqn (6) and (7).
 | (6) |
 | (7) |
Low R2 values for Temkin (0.86) isotherm model indicates that this adsorption model was not suitable to fit to the experimental data. Linear plot of R–P model showed the best fit (R2 = 0.99) for the adsorption of BG on peat compared to Langmuir, Freundlich, Halsey, Temkin isotherm models. The g value (0.60) falls between 0 and 1, suggesting that BG adsorption on peat is favorable and physiosorptive16 and suggesting that the adsorption of BG on peat was favored towards Freundlich instead of Langmuir. This also implies that the sorption of BG on peat is not monolayer, but possibly by complexation or ion-exchange interaction between peat and dye molecules. The order of isotherm models is explained in the following order: R–P (0.99), Freundlich and Halsey (0.98), Sips (0.96), Langmuir (0.92) and Temkin (0.86), based on R2 values. This trend was found to be similar to red clay,43 modified mesoporous clay,47 sugarcane dust50 and NaOH treated saw dust.11
The simulated isotherm plot for the adsorption of BG on peat is shown in Fig. 9 for the determination of the best fit isotherm models. The error values calculated from error functions are listed in Table 8.
 | ||
| Fig. 9 Different isotherm models for adsorption of BG peat at 298 K (355 μm < d < 850 μm; concentration of dye: 0 to 1000 mg L−1; mass of peat: 0.050 g; volume of solution: 25.0 mL). | ||
| Isotherms | R2 | ARE | ERRSQ | HYBRID | EABS | MPSD | χ2 |
|---|---|---|---|---|---|---|---|
| Langmuir | 0.92 | 31.61 | 0.06 | 1.98 | 0.83 | 42.77 | 0.28 |
| Freundlich | 0.99 | 9.05 | 0.02 | 0.31 | 0.38 | 11.38 | 0.11 |
| Halsey | 0.99 | 9.05 | 0.02 | 0.31 | 0.38 | 11.16 | 0.11 |
| Temkin | 0.86 | 49.31 | 0.08 | 4.77 | 0.99 | 94.78 | 0.57 |
| R–P | 0.99 | 9.10 | 0.02 | 0.33 | 0.38 | 11.85 | 0.11 |
| Sips | 0.96 | 12.90 | 0.03 | 0.61 | 0.49 | 17.46 | 0.11 |
The Freundlich, Halsey and R–P appeared to fit the data best, with high R2 and the lowest error function values. From the linear plots, R–P isotherm has the highest R2 value (0.99) compared to Freundlich (0.99) and Halsey (0.99) isotherms. Besides high R2 values, lowest error values were found for Freundlich and Halsey isotherms. Similar error values were found for R–P isotherm. Alternatively, the experimental data in Fig. 9 fitted very well with the calculated Freundlich, Halsey and R–P isotherms. Of all the isotherms, Temkin model did not fit the experimental data due to low R2 values together with high ARE, ERRSQ, HYBRID, EABS, MPSD and χ2 values for the adsorption of BG on peat. Both Langmuir and Sips isotherms have slightly higher R2 values of 0.92 and 0.96, respectively. However, the error values calculated for both Langmuir and Sips were also very high when compared with the error values of Freundlich, Halsey and R–P isotherms. Therefore, with respect to the R2 values, based on the error values and simulated isotherms, the suitable isotherm models to represent the adsorption data of BG on peat are Freundlich, Halsey and R–P isotherm models.
The maximum adsorption capacities (qmax) of BG by various reported adsorbents are listed in Table 9. Generally, the qmax of peat with BG are higher compared to some natural adsorbents as well as some of the activated carbon, indicating peat is suitable to be used as an effective low cost adsorbent in real life wastewater treatment.
| Adsorbent | qmax (mg g−1) | Isotherm model | Temperature (K) | References |
|---|---|---|---|---|
| Damit peat | 265.4 | Langmuir | 298 | This work |
| Ashoka leaf powder | 125.0 | Langmuir | 298 | 34 |
| Kaolin | 65.4 | Langmuir | 299 | 13 |
| Rice husk ash | 25.1 | Langmuir | 303 | 16 |
| Waste brewery's yeast | 141.9 | Langmuir | 303 | 51 |
| Binary oxidized cactus fruit peel | 166.7 | Langmuir | 293 | 39 |
| Acorn activated carbon | 2.1 | Langmuir | 303 | 40 |
| Saklikent mud | 1.2 | Langmuir | 298 | 38 |
| Neem leaf powder | 133.6 | Langmuir | 300 | 52 |
| NaOH treated saw dust | 58.5 | Langmuir | 303 | 11 |
4.4. Scanning electronic micrograph studies (SEM)
The morphological features and surface characteristics of the peat sample before and after treatment with BG analyzed using SEM at 1000× magnification (Fig. 10a) showed that the surface of the untreated peat are uneven, rough and contains pores which provide suitable binding sites for BG molecules. However, identification of binding sites for BG is beyond the task of this research. Adsorption of the dye molecules leads the coverage of most of the available pores present in peat causing the surface of peat sample to become saturated as shown in Fig. 10b. Nevertheless, it is not expected that BG molecules, owing to its relatively larger size, would transfer to the bulk of the peat matric, and consequently, compositional changes are not expected. | ||
| Fig. 10 Scanning electron microscope (SEM) micrographs of peat (a) before adsorption and (b) after adsorption with BG at 1000× magnification. | ||
4.5. FTIR studies
FTIR spectra provide useful information for characterization of the functional groups. The infrared spectra of peat before and after treatment with 1000 mg L−1 BG are presented in Fig. 11. The band at 3386 cm−1 for untreated peat indicates the presence of –OH and –NH stretching on the surface of peat both untreated and treated peat. The bands observed at 2920 and 2850 cm−1 are related to the asymmetric stretches of –CH group and symmetric stretching vibrations of –CH group respectively for untreated and dyes treated peat. Absorption band at 1717 cm−1 is attributed to –COOH groups. The bands at 1626, 1512 and 1460 cm−1 indicate the presence of –COO, –C![[double bond, length as m-dash]](https://www.rsc.org/images/entities/char_e001.gif) O and –NH groups for both untreated and treated peat. The CO band at 1626 cm−1 for untreated peat was shifted to 1617 cm−1 and the band formed at 1581 cm−1 for BG treated peat was associated with the existence of aromatic rings. Another band appearing at 1421 cm−1 represents the –O–H bending vibration. The peak at 1376 cm−1 for untreated peat indicated the asymmetrical bending vibration of –CH3 and –CH2. This peak has become broader and sharper for BG treated peat at 1329 cm−1. Peak present at 1242 cm−1 indicates the presence of O–C–H, C–C–H and C–O–H groups bending vibration. Band at 1035 cm−1 implies the presence of bending vibration of –OH group and stretch vibration of C–O–C in lignin structure of peat.
O and –NH groups for both untreated and treated peat. The CO band at 1626 cm−1 for untreated peat was shifted to 1617 cm−1 and the band formed at 1581 cm−1 for BG treated peat was associated with the existence of aromatic rings. Another band appearing at 1421 cm−1 represents the –O–H bending vibration. The peak at 1376 cm−1 for untreated peat indicated the asymmetrical bending vibration of –CH3 and –CH2. This peak has become broader and sharper for BG treated peat at 1329 cm−1. Peak present at 1242 cm−1 indicates the presence of O–C–H, C–C–H and C–O–H groups bending vibration. Band at 1035 cm−1 implies the presence of bending vibration of –OH group and stretch vibration of C–O–C in lignin structure of peat.
 | ||
| Fig. 11 FTIR spectrum of (a) untreated peat, (b) peat treated with 1000 mg L−1 BG. | ||
4.6. Kinetics studies
Kinetics models are used to investigate the mechanism of adsorption and its potential rate-controlling step which include the mass transport and chemical reaction processes. Dye adsorption on solid adsorbents can be understand through the two distinct mechanisms where binding of dye molecules on the surface of sorbent was initially rapid and slowed at the intraparticle diffusion stage. The kinetics data of peat treated with 500 mg L−1 BG were analyzed using the kinetics expression (Table 3) and the kinetics parameters are tabulated in Table 10. The best models were selected by the determination of R2 and by comparing the adsorption capacity values qe,calc and qe,exp.| Pseudo first order | BG |
|---|---|
| qe,exp (mmol g−1) | 0.28 |
| qe,calc (mmol g−1) | 0.16 |
| k1 (min−1) | 0.03 |
| R2 | 0.98 |
| Pseudo second order | |
| qe,calc (mmol g−1) | 0.27 |
| k2 (g mmol−1 min−1) | 0.39 |
| h (mmol g−1 min−1) | 0.03 |
| R2 | 0.99 |
| Elovich | |
| α (mmol g−1 min−1) | 0.34 |
| β (mmol g−1) | 29.16 |
| R2 | 0.81 |
| Intraparticle diffusion | |
| C | 0.10 |
| kid (mmol g−1 min−1) | 0.02 |
| R2 | 0.94 |
In order to determine the best fit kinetics model to describe the sorption process of BG on peat, comparison of R2 values (Table 10) showed that pseudo second order model gave the best R2 (0.99), suggesting that this model provides a better correlation for the adsorption of BG on peat. In addition, the qe,calc value (0.27 mmol g−1) fitted very well with its qe,exp value (0.28 mmol g−1), further confirming the suitability and validity of the pseudo second order model for the adsorption process for BG on Damit peat. The initial adsorption rate, h (mmol g−1 min−1) is 0.03 mmol g−1 min−1 and the rate constant, k2, is 0.39 g mmol−1 min−1. The rate of adsorption, k2, for the adsorption of BG on peat was high, indicating that less time is required to reach equilibrium, which is cost beneficial if applied in real life wastewater treatment.
Therefore, Elovich kinetics model which assumes the solid surface active sites are heterogeneous in nature and exhibit different activation energies for chemisorption is applied to provide better understanding on the adsorption process. The rate of chemisorption and the available adsorption surface (α) for the sorption of BG on peat is 0.34 mmol g−1 min−1, while the surface coverage (β) of peat is 29 mmol g−1.
Intraparticle diffusion and Boyd kinetics expression were both applied to identify whether the adsorption mechanism is particle diffusion or film diffusion. Particle diffusion indicates that the adsorbate transport within the pores of the solid adsorbent while film diffusion is to the external surface of adsorbent. The intraparticle diffusion plot (Fig. 12) did not pass through the origin, suggesting that this could control the overall rate of the adsorption process. The thickness of the boundary layer (C) is 0.10, indicating that the surface adsorption and intraparticle diffusion along the boundary layer diffusion were simultaneously operating during the adsorption of BG on peat.
 | ||
| Fig. 12 Intraparticle diffusion plot. | ||
The kinetics data was fitted into Boyd kinetics expression15 to provide information on the actual slow step involved in adsorption. The equation is given in eqn (8).
 | (8) |
 | (9) |
Rearranging the eqn (8) gives:
 | (10) |
| Bt = −0.4977 − In(1 − F) | (11) |
The Bt values at different time, t were calculated and a plot of Bt vs. t for the adsorption of BG on peat in Fig. 13 gave linear plots with high R2 value (0.98). According to Fig. 13, the plot gives a straight line passing through the origin, indicating that the adsorption process is governed by intraparticle diffusion mechanism according to the mathematical relationship given in Table 3.
 | ||
| Fig. 13 Boyd plot for the adsorption of 500 mg L−1 BG on peat. | ||
The effective diffusion coefficient, Di (cm2 s−1) is calculated using eqn (12).
 | (12) |
4.7. Regeneration of dye-loaded adsorbent
Peat loaded with 100 mg L−1 BG solution for predetermined contact time was regenerated with 0.01 M HNO3, 0.01 M NaOH and doubly distilled water for five adsorption–regeneration cycles, with a control (no washing) to compare the adsorption capacity with the regenerated peat. The removal efficiencies (%) of BG-loaded peat for five adsorption–regeneration cycle are shown in Fig. 14. For BG-loaded peat which was regenerated through washing with doubly distilled water and control showed that the adsorbent lost its removal efficiency by almost 50% after four consecutive cycles of adsorption–regeneration and was unable to adsorb more dye at the 5th cycle. The reduction of removal efficiency after several cycles could be due to the collapse of porosity on the surface of peat after several adsorption–regeneration cycles, which induce pore blockage and therefore restricts the adsorption of dye molecules onto the surface. For acid regeneration, BG-loaded peat gave an initial adsorption of 60% removal efficiency and thereafter increased to 69% at 5th cycle, showing a slight improvement of removal efficiency through acid regeneration. However, regeneration with 0.01 M NaOH was the best regeneration method compared to regeneration using acid and water. The removal efficiency increased from 59 to 98% from cycle 1 to 2 and remained 98% through 5 cycles. Hence, base regeneration is the most suitable regeneration method for peat in real life application in wastewater treatment which enabled the reusability of peat for a longer period of time while maintaining its high removal efficiency. | ||
| Fig. 14 Regeneration of BG-loaded peat adsorbent using control, water, 0.1 M HNO3, 0.01 M NaOH for 5 consecutive cycles. | ||
5. Conclusion
In this study, peat native to Brunei Darussalam was demonstrated to remove BG from solution. Maximum removal of BG was observed at the ambient pH (4.9), hence no pHs adjustments were required throughout the experiments. Thermodynamics studies show that the adsorption process of peat and BG was favorable, spontaneous and endothermic in nature. Among the six isotherm models investigated in this study, R–P isotherm model with the highest R2 value of 0.99, is the suitable model. This was further confirmed by error analysis and comparison of the simulated isotherms. As it is a combination of the Langmuir and Freundlich models, the maximum adsorption capacity of 0.55 mmol g−1 (265 mg g−1), determined from the Langmuir model is a reasonable prediction for the BG-peat system. The adsorption kinetics fitted well to the pseudo second order model, with the rate constant of 0.39 g mmol−1 min−1. BG-loaded peat was regenerated and reused 5 times while maintaining high removal efficiencies of >90% using 0.01 M NaOH as the desorption agent. Further testing in pilot scale of side stream applications with manufacturer wastewater is recommended.Acknowledgements
The authors would like to thank the Government of Negara Brunei Darussalam and the Universiti Brunei Darussalam (UBD) for their financial support in carrying out this research. The authors are also grateful to the staff at the CAMES at UBD for the use of XRF.References
- S. J. Allen and B. Koumanova, J. Univ. Chem. Technol. Metall., 2005, 40, 175–192 CAS.
- B. Noroozi and G. A. Sorial, J. Environ. Sci., 2013, 25, 419–429 CrossRef CAS.
- P. Pandey, R. P. Singh, K. N. Singh and P. Manisankar, Environ. Sci. Pollut. Res., 2013, 20, 238–249 CrossRef CAS PubMed.
- L. B. L. Lim, N. Priyantha, D. T. B. Tennakoon, H. I. Chieng, K. Muhammad Dahri and M. Suklueng, Arabian J. Chem., 2014 DOI:10.1016/j.arabjc.2013.12.018.
- L. B. L. Lim, N. Priyantha, H. I. Chieng, K. Muhd Dahri, D. T. B. Tennakoon, T. Zehra and M. Suklueng, Desalin. Water Treat., 2013, 1–12, DOI:10.1080/19443994.2013.852136.
- S. Irem, Q. Mahmood Khan, E. Islam, A. Jamal Hashmat, M. Anwar ul Haq, M. Afzal and T. Mustafa, Ecol. Eng., 2013, 58, 399–405 CrossRef PubMed.
- K. Muhammad Dahri, M. R. R. Kooh and L. B. L. Lim, ISRN Environ. Chem., 2013 DOI:10.1155/2013/619819.
- K. Deepa, P. Chandran and S. Sudheer Khan, Ecol. Eng., 2013, 58, 207–213 CrossRef PubMed.
- J. Mittal, V. Thakur and A. Mittal, Ecol. Eng., 2013, 60, 249–253 CrossRef PubMed.
- B. Qu, J. Zhou, X. Xiang, C. Zheng, H. Zhao and X. Zhou, J. Environ. Sci., 2008, 20, 704–709 CrossRef CAS.
- V. S. Mane and P. V. V. Babu, Desalination, 2011, 273, 321–329 CrossRef CAS PubMed.
- A. Mittal, D. Kaur and J. Mittal, J. Colloid Interface Sci., 2008, 326, 8–17 CrossRef CAS.
- B. K. Nandi, A. Goswami and M. K. Purkait, J. Hazard. Mater., 2009, 161, 387–395 CrossRef CAS PubMed.
- P. A. Brown, S. A. Gill and S. J. Allen, Water Res., 2000, 16, 3907–3916 CrossRef.
- H. I. Chieng, L. B. L. Lim and N. Priyantha, Desalin. Water Treat., 2014 DOI:10.1080/19443994.2014.919609.
- V. S. Mane, I. Deo Mall and V. Chandra Srivastava, J. Environ. Manage., 2007, 84, 390–400 CrossRef CAS PubMed.
- M. P. Tavlieva, S. D. Genieva, V. G. Georgieva and L. T. Vlaev, J. Colloid Interface Sci., 2013, 409, 112–122 CrossRef CAS PubMed.
- I. Langmuir, J. Am. Chem. Soc., 1918, 40, 1361–1403 CrossRef CAS.
- G. Crini, Dyes Pigm., 2008, 77, 415–426 CrossRef CAS PubMed.
- H. Freundlich, J. Phys. Chem., 1906, 57, 385–470 CAS.
- G. Halsey, J. Chem. Phys., 1948, 16, 931–937 CrossRef CAS.
- M. J. Temkin and V. Pyzhev, Acta Physicochim. URSS, 1940, 12, 217 Search PubMed.
- O. Redlich and D. L. Peterson, J. Phys. Chem., 1959, 63, 1024 CrossRef CAS.
- R. Sips, J. Chem. Phys., 1948, 16, 490–495 CrossRef CAS PubMed.
- S. Lagergren, K. Sven. Vetenskapsakad. Handl., 1898, 24, 1–39 Search PubMed.
- Y. S. Ho and G. McKay, Chem. Eng. J., 1998, 70, 115–124 CrossRef CAS.
- A. B. Perez Marin, M. I. Aguilar, V. F. Meseguer, J. F. Ortuno, J. Saez and M. Llorens, Chem. Eng. J., 2009, 155, 199–206 CrossRef CAS PubMed.
- W. J. Weber and J. C. Morris, J. Sanit. Eng. Div. Am. Soc. Chem. Eng., 1963, 89, 31–59 Search PubMed.
- L. B. L. Lim, H. I. Chieng and F. L. Wimmer, ASEAN Journal of Science & Technology for Development, 2011, 28, 122–138 Search PubMed.
- M. R. Malekbala, S. Hosseini, S. Kazemi Yazdi, S. Masoudi Soltani and M. R. Malekbala, Chem. Eng. Res. Des., 2012, 90, 704–712 CrossRef CAS.
- L. B. L. Lim, N. Priyantha, U. K. Ramli and H. I. Chieng, J. Appl. Phytotechnol. Environ. Sanit., 2014, 3, 65–74 CAS.
- H. I. Chieng, L. B. L. Lim and N. Priyantha, Environ. Technol., 2014, 36, 86–97 CrossRef.
- L. B. L. Lim, N. Priyantha, D. T. B. Tennakoon, H. I. Chieng and B. Chandima, Ceylon J. Sci., 2013, 17, 41–51 Search PubMed.
- N. Gupta, A. K. Kushwaha and M. C. Chattopadhyaya, J. Taiwan Inst. Chem. Eng., 2012, 43, 604–613 CrossRef CAS PubMed.
- A. Sivasamy, S. Nethaji and L. L. J. L. Nisha, Environ. Sci. Pollut. Res., 2012, 19, 1687–1695 CrossRef CAS PubMed.
- G. Z. Kyzas, N. K. Lazaridis and A. C. Mitropoulos, Chem. Eng. J., 2012, 189–190, 148–159 CrossRef CAS PubMed.
- P. Sudamalla, S. Pichiah and M. Manickam, Desalin. Water Treat., 2012, 50, 367–375 CrossRef CAS.
- Y. Kismir and A. Z. Aroguz, Chem. Eng. J., 2011, 172, 199–206 CrossRef CAS PubMed.
- R. Kumar and M. A. Barakat, Chem. Eng. J., 2013, 226, 377–383 CrossRef CAS PubMed.
- M. Ghaedi, H. Hossainian, M. Montazerozohori, A. Shokrollahi, F. Shojaipour, M. Soylak and M. K. Purkait, Desalination, 2011, 281, 226–233 CrossRef CAS PubMed.
- J. Zhang, Y. Li, C. Zhang and Y. Jing, J. Hazard. Mater., 2008, 150, 774–782 CrossRef CAS PubMed.
- M. A. Ahmad and R. Alrozi, Chem. Eng. J., 2011, 171, 510–516 CrossRef CAS.
- M. S. U. Rehman, M. Munir, M. Ashfaq, N. Rashid, M. F. Nazar, M. Danish and J.-I. Han, Chem. Eng. J., 2013, 228, 54–62 CrossRef CAS.
- A. Aylin, G. Emel and S. Yoldas, J. Hazard. Mater., 2010, 179, 658–664 CrossRef PubMed.
- L. B. L. Lim, N. Priyantha, C. M. Chan, D. Matassan, H. I. Chieng and M. R. R. Kooh, Arabian J. Sci. Eng., 2014, 39, 6757–6765 CrossRef CAS PubMed.
- M. A. Rauf, S. B. Bukallah, F. A. Hamour and A. S. Nasir, Chem. Eng. J., 2008, 137, 238–243 CrossRef CAS PubMed.
- M. Auta and B. H. Hameed, Chem. Eng. J., 2012, 198–199, 219–227 CrossRef CAS PubMed.
- U. R. Lakshmi, V. C. Srivastava, I. D. Mall and D. H. Lataye, J. Environ. Manage., 2009, 90, 710–720 CrossRef CAS PubMed.
- Y. S. Al-Degs, M. I. El-Barghouthi, A. H. El-Sheikh and G. M. Walker, Dyes Pigm., 2008, 77, 16–23 CrossRef CAS PubMed.
- Y.-S. Ho, W.-T. Chiu and C.-C. Wang, Bioresour. Technol., 2005, 96, 1285–1291 CrossRef CAS PubMed.
- Y. Wu, L. Jiang, Y. Wen, J. Zhou and S. Feng, Environ. Sci. Pollut. Res., 2012, 19, 510–521 CrossRef CAS PubMed.
- K. G. Bhattacharyya and A. Sarma, Dyes Pigm., 2003, 57, 211–222 CrossRef CAS.
| This journal is © The Royal Society of Chemistry 2015 |