Sheraz A. K. Tanoli*a,
Nazish U. Tanolia,
Tatiani M. Bondanciab,
Saman Usmanic,
Zaheer Ul-Haqc,
João B. Fernandesb,
Sérgio S. Thomasia and
Antonio G. Ferreiraa
aLaboratory of Nuclear Magnetic Resonance, Department of Chemistry, Federal University of São Carlos, Rodovia Washington Luiz, Km 235, Brazil. E-mail: nmrdoctor@gmail.com
bDepartment of Chemistry, Federal University of São Carlos, Rodovia Washington Luiz, Km 235, Brazil
cDr. Panjwani Center for Molecular Medicine and Drug Research, International Center for Chemical and Biological Sciences, University of Karachi, Karachi, 75210, Pakistan
First published on 18th February 2015
Over the last two decades, new and more advanced strategies that help in the rapid screening and identification of new ligands for a specific macromolecule have become an important domain. From this viewpoint, the effectiveness of STD NMR, Tr-NOESY, and STD-TOCSY has been utilized to evaluate the binding potential of the natural extract of Stryphnodendron polyphyllum, used as a herbal medicine in Brazil, towards human serum albumin. Moreover, 1D-DOSY experiments have also been carried out for the discriminations of different molecular weight compounds present in this extract. Following the STD, Tr-NOESY, and TOCSY analysis, a hyphenated system comprising LC-SPE-NMR was utilized to see the complete structural assignments through 2D spectra. The combined results from NMR spectroscopy and separation methods provided myricetin-3-O-rhamnopyranoside (1), quercetin-3-O-glucopyranoside (2), quercetin-3-O-xylopyranoside (3), and quercetin-3-O-rhamnopyranoside (4) as the active site blockers. Moreover, epitope results and additional Tr-NOESY cross peaks suggested the presence of the flattened conformations of these ligands within the ligand–HSA complex through the edge protons. Similarly, STD competition studies with the ligand–HSA complex were demonstrated by varying the concentration of spy molecule that selectively binds with Sudlow's site II. Finally, docking simulations targeting both Sudlow sites (I and II) were performed, which interestingly mimic the STD competition results and showed that these compounds (1–4) are more prone towards binding site-1 inhibition. Therefore, we suggest that the sequence of techniques presented in this study can be considered as a simple and fast analytical tool for screening natural extracts to get better leads against any specific target.
Since herbal extracts are sensitive towards environmental changes, NMR seems to be an ideal choice that offers the economically and environmentally healthy conditions required by the drug discovery process.5 Unlike other biochemical assays, NMR demands neither prior knowledge about the function of the protein and/or protein labeling nor target specific instrumental set-up.6 On the other hand, the screening techniques (mass spectrometry, circular dichroism, ultraviolet spectroscopy, etc.) used to analyze organic mixtures suffer from a number of drawbacks, like lack of information regarding proton exchange,7 unable to resolve overlaps in signals8 and demanding compounds with optical absorption.9 Although the aforementioned techniques are widely used in drug discovery, it is often not easy to develop a simple and rapid ligand screening method using these techniques because of differences in the molecular polarities, solubility, and presence of isomers, as well as the lack of optical absorption, etc. In addition, structure assignments of unknown compounds and their contribution towards the biological activity are also blurred.
Molecular recognition lies at the heart of all biological processes involving the human body since almost all body functions involve ligand–receptor and receptor–receptor type interactions. Therefore, ligand–protein interaction is an important primary domain for discovery of new drugs. Over the past two decades, the screening of natural product mixtures with receptors by using NMR as a detector has been extensively reported.10 Among the different NMR methods used for studying ligand–receptor interactions, STD NMR11 has become one of the most commonly used methods for ligand recognition,10,12 analyzing molecular kinetics and determining the dissociation constants13 of bound state ligands. Besides screening ligands, NMR has been demonstrated for fingerprinting the content of complex mixtures.14,15 However, in all such studies the structural characterization remains a bottleneck,6 unless some separation methods are involved. However, the use of hyphenated methods like LC-UV-SPE-NMR can beautifully eliminate this characterization bottleneck, particularly where the NMR is unable to make distinctions between the signals due to overlap.16 Recently, Ferreira and co-workers17 supplied an excellent way to find leads from crude, through the significant results obtained by utilizing direct NMR techniques following the docking simulation. Thus, this development has made NMR arguably the most important tool for the recognition of ligands from complex natural products.
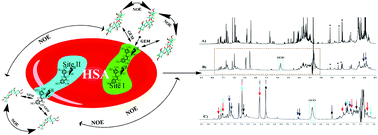
In the present study, we have employed STD NMR and Tr-NOESY experiments to study the binding of ligands from Stryphnodendron polyphyllum fully bloomed flower extract towards HSA protein. Human serum albumin is the most widely studied18,19 and the most abundant protein in the body, in the range 30–50 g L−1, constituting around 50% of total serum protein by concentration.20 It is a well-known protein, responsible for the maintenance of blood pH21 and osmotic pressure18 and the transportation of small molecules; however, it possesses a great affinity for fatty acids.22 HSA consists of three structurally similar helical domains with a total of 585 amino acids, where each domain consists of two sub-domains, named A and B, connected by a flexible loop.23 Six helices are present in the A subdomain while the B subdomain contains four helices, where a number of binding sites within the subdomains IIA and IIIA specific for Sudlow's site I and II, respectively, are present.23
The screening of ligands from a natural product was conducted by using direct NMR applications along with hyphenated methods. To date, to the best of our knowledge, no single study that has reported the interactions of this highly bioactive plant towards a specific target, HSA protein. Here, we have selected an ethyl acetate extract of Stryphnodendron polyphyllum (the plant commonly known as barbatimão). In folk medicine, the extract of barbatimão is frequently used in Brazil for the treatment of leucorrhea, diarrhea, sepsis and inflammatory disorders, as well as for blood clotting and wound healing purposes.24,25 The antibacterial and antioxidant activity of barbatimão extract is also reported.26 In the near future, this approach may open a way to new drug discoveries based on data from ligand–protein interactions, and can provide further evidential proof of the usefulness of NMR.
Soon after the provision of the screening strategies, and to have an idea regarding the size of different components within this fully bloomed flower extract, an alternate approach to bio-fractionation, a 1D-DOSY experiment, was selected. It is well understood that the intensities of protons belonging to low molecular weight compounds are reduced or even completely wiped out by increasing the gradient strength.27 Therefore, rather than utilizing bio-fractionation through the cut-off membrane, a series of 1D-DOSY analyses by varying gradient strength (5%, 20%, 40%, 80% and 95%) was employed to perform the fractionation based on molecular weight. Based on this series of 1D-DOSY spectral results, the assumption was made that there were at least two types of components present, as shown in Fig. 1. The changes in signal due to the decrease in gradient strength from 40% to 5% are indicated by arrows with an asterisk (*) and psi (Ψ), providing evidence of an almost similar component between δ = 7.9 and 12.4 ppm (Fig. 1). Spectral results corresponding to the gradient strength (20% and 80%) are not given because no recognizable changes were found in them. Therefore, after obtaining the realistic 1D-DOSY results, we assumed that there were smaller to medium size components (full spectra Fig. S-1 in ESI†), and the decision about whether the interaction originates from a smaller size or medium compound will be demonstrated later by STD NMR.
In the first step of this recognition process, screening was applied to 1 mg of fully bloomed flower extract of Stryphnodendron polyphyllum using STD NMR. First of all, a 1H-NMR spectrum in 5 μM HSA (Fig. 2A) was recorded that represents a ligand–protein complex system and acts as a control while, in Fig. 2B suppression of the HOD signal was carried out to see the hidden anomeric protons under the large HOD signal. Given complete numbering was done by 2D NMR data obtained (not shown here) thereby, separation methods. The STD NMR clearly showed (Fig. 3) that the aromatic, as well as the sugar region (2.8–5.5 ppm) of the spectra, is involved in major binding. Similarly, further evidence of binding was also observed in the line broadening and change in relaxation rate as a result of protein addition.
Fig. 3 presents the proton NMR spectrum as a reference at the top, the STD spectrum in the middle and the bottom spectrum is the magnified region (chemical shift δ = 3.0 to 8.2 ppm) of the STD spectrum in the dotted rectangle, for more clarity. The observations that come out from the figure are: some signals of impurities are present in the region δ = 2–2.5 ppm, background signals from protein, and almost all signals showed some level of enhancement—an indication of binding to HSA protein. Over the last decade, it has been shown that the signals in the STD spectrum represent the engagement in binding with some binding residues of the receptor.5,17 Conversely, the absence of signals in the STD spectrum shows that there is no binding/affinity towards the respective receptor.5,11–17
The amplification gradient is the result of a saturation received by the particular proton from the receptor, and it also determines the vicinity of the ligand to the binding cavity. Thus, the intensity of the signal depends on two factors: (A) the length of saturation time, and (B) the number of protons.13,17 The STD build-up stack was obtained by performing experiments with varying saturation times (1 s, 2 s, 3 s, 4 s, and 5 s), and the outcome stack model of the spectra is shown in Fig. S-2 ESI.† Group epitope mapping calculations were made by comparing the individual proton integrals, and normalizing others with respect to this, which was earmarked for 100%. After evaluating a series of experiments performed at different saturation times, a saturation time of ca. 3 s was discovered to be most efficient where all signals have excellent resolution and intensity. Possible recognizable compounds with their respective amplification factors, after comparing the data from STD NMR, Tr-NOESY, TOCSY, and the separation method, are shown in Fig. 4, where the sugar moieties of all compounds are represented separately. Intriguingly, the interaction footprints from these molecules revealed that the protons at position H-6 (6.26 ppm) and H-8 (6.44 ppm) showed singlets. Following this, the second largest signals were obtained from the sugar region.
A 100% STD effect was obtained from the H-6 protons of all the recognizable compounds, showing a major involvement in the interaction. However, the H-8 protons of these compounds contributed a 94% STD effect. Among the other aromatic signals, position H-2′/H-6′ of myricetin-3-O-rhamnoside (1) was taller with a 73% STD effect, while the same protons from quercetin-3-O-rhamnoside (2) provided between 46% and 50% STD effects. So, the protons H-2′/H-6′ from compound 1 engaged in stronger binding as compared to the same protons from compound 4. However, the protons H-6′ and H-2′ from compounds 2 and 3 revealed different amplification factors of 13% and 27%, and 27% and 39%, respectively. Conversely, the proton at position H-5′ remained prominent with 63%, 39% and 61% STD effects for the compound 2, 3 and 4 respectively. From these aromatic epitope results, it is clear that the only sides (edges) of all the recognizable compounds (1–4) were towards the binding cavities of the protein, thereby receiving more saturation transfer, and hence the larger interaction.
Likewise, the epitope results remarkably showed that both rhamnose units could provide better interaction compared to the glucose and xylose units. In addition, all the axial protons from these molecules provided greater amplification and obviously good interaction towards the HSA protein. Among the equatorial protons; H-3′′ from compound 1 and 4 could provide noticeable STD effects of 82% and 77%, respectively. The second highest STD effect was found from the sugar moiety of compound 1, H-4′′ and H-5′′ provided well-nigh effects of 39% and 43%, representing its moderate interactions. Similar protons from compound 4 could provide almost the same effect of 43%. By combining the results of compounds 1 and 4 for position H-4′′ and H-5′′, the interacting behavior towards HSA was found to be similar. However, the signal for H-4′′ from compounds 2 and 3 also provided STD effects of 41% and 36%, respectively. H-5′′ for 2 provided 41% STD, and both protons (H-5a′′ and H-5b′′) belonging to 3 showed a bit higher binding with 57% and 25% STD effects, respectively. Interestingly, the anomeric protons belonging to all compounds showed a negligible STD effect between 1–5%. From this epitope mapping, it can be concluded that the parts of the sugars that are towards the flavones (aglycone) skeleton showed less binding than the part far from it. Thus, these epitope results revealed that both edges are in intimate contact with the binding sites.
Furthermore, Tr-NOESY experiments were carried out to identify the bound conformations of these STD-exposed interacting molecules within the HSA–ligands complex. Tr-NOESY is the best-known experiment for the evaluation of the bound conformations for the ligand–receptor complexes at equilibrium, where the bound ligand's geometric information is transferred to unbound.5,17,28,29 In NOE, the major distinguishing parameter between the bound and unbound ligands is the correlation time (τc); small molecules possess short τc and a longer relaxation rate. However, in the bound state this shorter correlation time (τc) converts to the longer—a characteristic of large mass molecules, resulting in a strong NOE. Similarly, the Tr-NOESY build-up rate in solution was also much faster when compared to NOESY.17,28 In 2D NOESY without the addition of protein, all cross peaks had positive signs when compared to the diagonal (Fig. 5A). However, in the sugar region some signals also revealed negative signs, which might be due to the larger size or an uncorrected phase. Nevertheless, in Tr-NOESY all peaks represented the same significance to the diagonal and, more importantly, the buildup rate was much faster when matched to NOESY without protein, giving evidence of protein binding (see Fig. 5B). However, the mixing time for both NOE experiments was kept the same at 400 ms. In the next step, the bound conformations of these compounds within the ligands–receptor complex were studied.
Protons H-6′′, H-5′′, H-4′′ and H-3′′ of compound 1 and 4 were not present in the NOESY experiment; however, in the Tr-NOESY experiment these were very prominent (Fig. 5B). In fact, the flexibility of these protons has been reduced in the bound conformation. Thus, the short correlation time of these protons was no longer existed in the bound state, thereby interacting with binding cavities and hence affording the strong negative NOE results. Similarly, in the aromatic region, the strong signals from protons H-6 and H-8 were also absent, but they came into sight due to binding to the protein in the Tr-NOESY experiment. Interestingly, some protons from the glycone part of compound 2 and 3, like H-2′′ and H-3′′, also showed strong negative NOEs in the Tr-NOESY spectrum. It is worth noting that the signals from the anomeric protons were present in both spectra (Fig. 5A and B). The Tr-NOESY experiments mimic the epitope mapping STD results by providing similar results. Therefore, using the combined evidence from both the STD and Tr-NOESY experiments, we argue that the portions of the small molecules (1, 2, 3 and 4) that are engaged in strong binding are the edges of each molecule. Therefore, by taking compound 1 as a reference, the bound conformations have been suggested through 3D models in Fig. 6A–C, which show a flattened type existence in the binding cavity.
For further clarification about the structures and their bindings, the same sample (with protein) was considered for 2D TOCSY and STD-TOCSY experiments. The 2D TOCSY experiment is well comprehended for complex structure identification and has the added advantage of determining the ligand protons proximity to the neighboring binding sites of the receptor.11,30 Signal intensities were the primary source for STD-TOCSY establishments; by comparing the off-resonance to the STD spectrum, more intense signals were considered to indicate more intimate contact towards protein binding sites, while the fewer intense signals were more solvent exposed. Intact protons that were present in the STD NMR spectra experienced the same saturation, resulting in strong cross peaks. Interestingly, the aromatic region (Fig. 7A and B) as well as the glycone part (Fig. S-3 ESI†) protons, showed strong cross peaks that could be attributed to the closest approach to binding sites in this ligands–protein complex.
Among the aromatic protons of the recognized compounds, H-6′ and H-5a′′ of compounds 2 and 3 (small blue and red squares, respectively) were prominent, and they could provide evidence of binding in STD-TOCSY. Similarly, H-2′ from compounds 1 and 4 (small blue and red circles, respectively) and protons H-2′/6′ from compound 1 provided excellent agreement with the STD spectrum and hence interactions (Fig. 6B). Intriguingly, signals from H-6 and H-8 positions from these compounds (1, 2, 3 and 4) mimic exactly the STD and Tr-NOESY spectral results of having strong cross peaks, and thereby strong contact with binding sites. Thus, 2D STD-TOCSY again provided the strongest evidence of flattened conformations during the bindings of the recognizable ligands. In addition, the methyl signals of a rhamnose sugar from compounds 1 and 4 provided the same results (Fig. S-3 ESI†). In the STD-TOCSY results, some signals from the 2D TOCSY spectrum were missing, which might be due to a lower degree of saturation received from the protein because of the large distance from the binding site or being present in some shallow site.
At this stage, on the premise of STD NMR, Tr-NOESY and STD-TOCSY experiments, the structural skeleton was almost clarified and evidence of the presence of a flavonoid type skeleton with attached sugars was provided, but no guarantee about the absolute structural assignments was provided yet. However, there was a substantial need for some separation method that could lead to a full characterization and a certainty about the number of components involved in their binding. Thus, the obvious choice was LC-SPE-NMR, which not only enables characterization of the structure, but is also helpful in providing the exact number of components involved as well.31,32 To accomplish this purpose, 3 mg of the extract was dissolved in 1 mL of methanol–water (85:
15 v/v). Afterwards, a separation method with shorter run-time and high resolution was observed (Fig. S-4 ESI†). Using the gradient solvent with varying concentrations and with the injection of 15 μL of sample with a flow rate of 1 mL min−1 led to a chromatogram (see Fig. S-5 ESI†) comprising 13 peaks (4 major and 9 minor). After 30 times of trapping the four major compounds on the general phase cartridge of SPE system, each peak was eluted to the NMR probe using 230 μL of CD3OD. All of the trapped compounds provided very clear 2D NMR spectra (COSY, HSQC, and HMBC) after matching up this spectral data with earlier reported results,33–35 which led to the conclusion that myricetin-3-O-rhamnopyranoside, quercetin-3-O-glucopyranoside, quercetin-3-O-xylopyranoside and quercetin-3-O-rhamnopyranoside are compounds 1, 2, 3 and 4, respectively.
Thus, in STD NMR competition studies, L-tryptophan is used as a reference (spy molecule) that preferably binds to Sudlow's site II of human serum,36 and has been extensively applied to site-selective competition studies.37,38 In this study, the unknown amounts of the four natural products trapped through the SPE system were further utilized by making 1:
100 and 1
:
350 molar solutions of protein to L-tryptophan ratio for each single STD experiment after obtaining 1 and 2D spectra. All these competition experiments were performed by using a fixed concentration of HSA (50 μM) for each ligand. By close observation of the spectra, it could be presumed that the STD intensities of these ligands protons remained the same, even though, when increasing the molar excess of the spy molecule (Fig. 8 and S-6–S-8 ESI†). These outcomes of the competition study strongly suggest that no ligand targets the selected site of the HSA, subsequently binding with some other sites. Due to lack of sufficient quantities (from the separation system), further STD competition experiments for the hunt of Sudlow's site I were not performed with other spy molecules that selectively bind to the respective locus. Therefore, rather than exploring the site selectivity of these ligands towards Sudlow's site I through STD competition experiments, further observations were made through docking simulation and molecular dynamics studies.
With respect to site-1, compound 1 docked within the binding groove of human serum albumin with active residues. Arg257, the most interacting residue of the binding site, interacted via a strong hydrogen bond of 2.08 Å that linked the NH of Arg257 to the hydroxyl group of the ligand's sugar. Another quite weak hydrogen bond of 3.31 Å was also observed in between the Arg222 NH and the OH of the ligand's resorcinol, as shown in Fig. 9. Similarly, compound 2 (Fig. S-9a ESI†), displayed more intense interacting capability with three strong hydrogen bonds and the highest binding free energy of −7.3211 kcal mol−1 (Table 1). These bonds are mediated by the carboxylic oxygen of Glu153, the guanidine NH of Arg257 and the guanidine NH of Arg218 towards the hydroxyl hydrogen, the hydroxyl oxygen of the sugar and the hydroxyl oxygen of the resorcinol moiety at two extremes of the ligand molecule.
![]() | ||
Fig. 9 3D bound conformations of the myricetin-3-O-rhamnoside, generated by Molecular Operating Environment (MOE) 2011.10 within the HSA–myriscetin-3-O-rhamnoside complex for Sudlow's site I (A) and II (B). The PDB file for the HSA complex with amino camptothecin was taken from the protein data bank with ID: 4L8U. The best-fit accommodation of this structure after 30 different pose evaluations provided almost similar results as deduced earlier through STD AF and Tr-NOESY studies, i.e. a flattened extended structure is involved in binding. |
Site I | ||||
---|---|---|---|---|
Compounds | S | E-score1 | E-refine | E-score2 |
1 | −6.969235 | −15.22145 | −17.91924 | −6.969235 |
2 | −7.32114 | −12.14727 | −27.00223 | −7.32114 |
3 | −6.6642 | −12.1306 | −25.2395 | −6.6642 |
4 | −6.940517 | −13.40245 | −23.50109 | −6.940517 |
However, compound 3 also showed comparable results with the same number of hydrogen bonds supporting its residency within the binding site. Arg257, Glu153 and Ser192 via their NH, OCO and OH were found to be involved in hydrogen bonding with the hydroxyl oxygen of the ligand's hexose sugar, as depicted in Fig. S-10a ESI.† The distances of interaction that enable the compound to be selected as effective are 2.6 Å, 2.21 Å, and 2.31 Å, respectively. Moreover, a hydrophobic interaction mediated from the CH of Glu292 captured the resonating resorcinol of compound 3, resulting in a CH⋯π interaction. Conversely, compound 4 behaved quite differently with different interacting residues within the same binding pocket and with good binding energy of −6.9405 kcal mol−1 (Table 1). The compound's catechol OH interacted with the carboxylic oxygen of Asp451 with a binding length of 2.03 Å, however, a bond of 2.14 Å was observed in between the hydroxyl hydrogen of the hexose sugar and the hydroxyl oxygen of Ser192. Beside this, Ala291 also played a supportive role in ligand binding via hydrophobic interaction, established via its CH towards the resorcinol ring of the molecule (displayed in Fig. S-11a ESI†).
On the other hand, when the same compounds were screened against site II, a quite different binding pattern was exposed, as shown in Table 2 with different conformations. Compound 1 (Fig. 9B) placed itself at the edge of the defined binding site and interacted with the outside residues. Fig. 9B shows the compound placement with an active site (purple) and outside (gray) residues. It interacted strongly through hydrogen bonds of 1.88 Å, 1.99 Å, and 2.36 Å that originated from Asn429, Lys519 and Arg428 towards the OH of pyrogallol, the ketonic oxygen of the centered ring and the OH of the hexose sugar moieties of compound 1. Furthermore, the active site Lys190 and Leu115 also interacted via hydrogen bonding of 2.23 Å and 3.23 Å with the ligand to support its binding at the boundary of the protein's binding pocket. The orientation of compound 2 (Fig. S-9b ESI†) within binding pocket 2 ensured the correct placement of the molecule surrounding its hot spot residues. Arg117 and Asp183, two important active site residues, formed hydrogen bonds of 1.92 Å and 2.22 Å with the hexose sugar oxygen and the catecholic OH groups of the compound, depicted in Fig. S-9b and S-10b ESI.† Compound 3 and 4 presented in Fig. S-10b ESI† and Fig. S-11b,† respectively, also docked within the binding groove catching the protein's hot spot residues. Arg114, Arg117, and Arg186 were found to be the main players in compound 3's binding through their guanidine NH. Agr114 mediated two strong hydrogen bonds of 2.38 Å and 2.27 Å towards the ether-linked oxygen of the hexose sugar. Moreover, Arg117 and Arg186 radiated a single (2.45 Å) and three hydrogen bonds (1.99 Å, 2.73 Å and 2.78 Å) in the direction of the sugar's hydroxyl oxygen and the carbonyl oxygen of the resorcinol and the centered ring, respectively. Compound 3 with stronger bonding and higher binding free energy (−6.9428 kcal mol−1, Table 2) is considered to have more potential for this site of HSA, ensuring its greater blocking ability for site-2. Moreover, compound 4 seized Arg114 (1.92 Å) through hydrogen bonding with a binding interaction of 1.92 Å with a total free energy as shown in Table 2.
Site II | ||||
---|---|---|---|---|
Compounds | S | E-score1 | E-refine | E-score2 |
1 | −6.483576 | −12.29182 | −20.07261 | −6.483576 |
2 | −6.516641 | −11.81531 | −8.509714 | −6.516641 |
3 | −6.9428 | −13.7778 | −14.4524 | −6.9428 |
4 | −6.61349 | −11.05528 | −17.81524 | −6.61349 |
To increase the concentration of the existing compounds for NMR experiments, a Prospect 2 SPE system (Netherlands) with 210 nm DAD detection wavelength was utilized. Furthermore, the dilution before the trapping was performed through a makeup pump with pure water at a flow rate of 3 mL min−1 then each compound was trapped on a HySphere resin GP cartridge (10 × 2 mm). Thus, each compound was trapped 30 times within the same cartridge to ensure sufficient concentration for 2D spectral data. Before the elution, each compound was dried with N2 for 35 minutes and then eluted into the NMR probe by adding deuterated methanol-d4 as the solvent for the NMR experiments.
Footnote |
† Electronic supplementary information (ESI) available. See DOI: 10.1039/c5ra01457c |
This journal is © The Royal Society of Chemistry 2015 |