DOI:
10.1039/C5RA01420D
(Paper)
RSC Adv., 2015,
5, 27517-27525
Synthesis and characterization of micro/nano-structured BaHPO4/Ba3(PO4)2/Ba5(PO4)3OH phases and their luminescence
Received
24th January 2015
, Accepted 10th March 2015
First published on 10th March 2015
Abstract
Microspheres covered with microcuboids/nanorods and nanoparticles of BaHPO4/Ba3(PO4)2/Ba5(PO4)3OH phases have been successfully synthesized by a facile hydrothermal (HT) method using the citric acid as a surfactant at different pH values. X-ray diffraction (XRD), field emission scanning electron microscopy (FE-SEM) and fluorescence spectrometry were used to characterize the samples. It was found that the pH value was a crucial factor for the phase formation and shape determination of the final products, which were discussed in detail. Attractively, the as-prepared BaHPO4/Ba3(PO4)2/Ba5(PO4)3OH samples emitted an intense blue light in a broad band from 380 to 625 nm, for which the mechanism was complex ions luminescence originating from the transition of 3T1 → 1A1 in PO43−. Meanwhile, an obvious red shift for the emission band was observed between nano- and bulk-Ba3(PO4)2 synthesized by HT and conventional solid-state (CSS) reactions, respectively, which was due to the effect of the product being nanosized. The same effect was also revealed by the fact that the decay time of the latter was about 2.5 times that of the former. Moreover, the decay mode of Ba5(PO4)3OH was different from those of BaHPO4 and Ba3(PO4)2, which was ascribed to the effect of the substitution of three OH− for one PO43− on their electronic structures.
1. Introduction
In the past decades, the orthophosphate of barium, Ba3(PO4)2, has been reported to be a good host for rare earth-doped luminescence materials. As early as 1979, Tale et al. reported that Eu2+ doped Ba3(PO4)2 was an efficient luminophor for X-ray screens.1 Subsequently, in 1996, Poort et al. reported that the emission spectrum of Ba3(PO4)2:Eu2+ presented two blue bands ascribed to two different positions of Eu2+ in the host.2 In 2003, Liang et al. systematically investigated the optical spectroscopic properties of Ce3+, Sm3+, Eu3+, Eu2+ and Tb3+ doped Ba3(PO4)2.3 In further research, in 2011, Chen et al. studied the luminescence properties of Ba3(PO4)2 co-doped with Ce3+ and Dy3+ ions.4 They found that the introduction of a moderate amount of Dy3+ ions could cause a red shift in the Ce3+ emission band and enhance its emission intensity. However, the conventional solid-state (CSS) reaction route has been the only preparation method for all these phosphors. As we all know, their block-shape and poor particle distribution are prominent disadvantages of CSS products, and may hinder the effectiveness of the phosphors. In addition, the long sintering time and high sintering temperature in the CSS process greatly increase the cost. To improve the current situation, soft chemical synthetic methods, including sol–gel, precipitation, hydrothermal (HT) synthesis and so on,5,6 have been rapidly developed and certified to be some of the most effective and convenient approaches to yielding homogeneous and shape-controllable products with micro/nanostructures in recent years.7,8 In 2012, Cheng et al. successfully synthesized Eu2+ and Tb3+ doped Ba3(PO4)2 nanowires by the precipitation method for the first time, but anodic aluminum oxide was used as a template in the precipitation process, which involved a complicated process and may have introduced impurities owing to the incomplete removal of the template.5,9,10 As such, template-free strategies, of which HT synthesis is a typical one, should be more popular. In HT synthesis, a unique trait is that the liquid or gas is usually used as the reaction medium in a closed environment to form high temperature and high pressure surroundings, which can promote the formation of well dispersed and shaped crystals with complete crystallization in one step.11,12 Many experiments have shown that the shape and phase structure of products depended on the HT conditions to a certain degree, including the pH value of the initial solution, type and amount of surfactant, reaction time and temperature, concentration of the reaction solution, etc.8,13–17 Therefore, this present work focuses on the HT process in the synthesis of Ba3(PO4)2 materials. It is exciting that different phases, existing as spheres made up of distinct unit elements, were formed at different pH values, and all of the as-obtained host materials were observed to show an intense blue emission for the first time. Moreover, some nanostructures were generated in the HT process, which demonstrated different luminescence properties to those of the CSS products. This finding, that all of the as-synthesized non-rare earth doped BaHPO4/Ba3(PO4)2/Ba5(PO4)3OH materials emit a blue light in our work, may contribute to the field of near-ultraviolet (n-UV) conversion tri-color phosphors and save rare earth resources to some degree.
2. Experimental
2.1. Synthesis
To begin with, Ba3(PO4)2 powder was expected to be obtained using the HT method. The raw materials were Ba(NO3)2 (A.R.) and NH4H2PO4 (A.R.). In a typical procedure, the stoichiometric amount of Ba(NO3)2 and NH4H2PO4, and moderate citric acid (CA) acting as a surfactant, were weighed and dissolved together in deionized water under continuous stirring. Subsequently, ammonia (NH3·H2O) was added to adjust the pH to different values. After additional agitation for 30 minutes, the mixed solution was transferred to an autoclave with 30% filling capacity, and HT treatment was performed at 180 °C for 12 h. The as-obtained samples were washed several times using deionized water and anhydrous ethanol, then dried in an oven at 80 °C. As a comparison, the Ba3(PO4)2 samples were also synthesized using a CSS reaction, with 0 and 5 mass% H3BO3 (labelled as CSS0 and CSS5). As raw materials, the stoichiometric amounts of BaCO3 and NH4H2PO4 were weighed and mixed well in an agate mortar. The mixture was then transferred to an alumina crucible and calcined at 1300 °C for 4 h in an oxygen atmosphere. Finally, the as-obtained samples were slowly cooled to room temperature for subsequent characterization.
2.2. Characterization
The crystal structure of the phosphors was characterized using X-ray diffraction (XRD) (Bruker D8 Focus) with Ni-filtered Cu-Kα (λ = 1.540598 Å) radiation at 40 kV tube voltage and 40 mA tube current. The XRD data were collected in a 2θ range from 10° to 70°, with the continuous scan mode at a speed of 0.05 s per step with a step size of 0.01°. The morphology and microstructure were characterized using field emission scanning electron microscopy (FE-SEM) (Japan SU8010) at 15 kV. Excitation and emission spectra were recorded using a fluorescence spectrometer (FLUOROMAX-4P, Horiba Jobin Yvon, New Jersey, USA) equipped with a 150 W xenon lamp as the excitation source. The spectral step length of both the excitation and emission spectra was set up to be 1.0 nm with the width of the monochromator slits adjusted to 0.50 nm. The lifetime was recorded on a spectro-fluorometer (HORIBA, JOBIN YVON FL3-21), and pulse laser radiation (nano-LED) was used as the excitation source. The other measurement conditions were kept consistent from sample to sample during the measurements. All the measurements were carried out at room temperature.
3. Results and discussion
3.1. Phase identification, structure and calculation of crystallite size
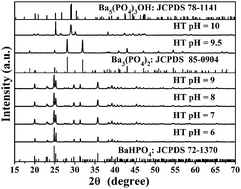
Fig. 1 shows the XRD spectra of the as-obtained phases produced by the HT process at 180 °C for 12 h with the different pH values of 6.0, 7.0, 8.0, 9.0 and 10.0. For comparison, XRD standard data patterns of the Joint Committee on Powder Diffraction Standards (JCPDS) card no. 72-1370 and 78-1141 are also given. It could be found that BaHPO4 was obtained with the pH value adjusted to 6.0, 7.0, 8.0 and 9.0, respectively, and that further elevating the pH value to 10.0 caused Ba5(PO4)3OH to be formed. These results suggest that the pH value has a great effect on the phase formation while the other experimental conditions are the same. Thus, we assume that Ba3(PO4)2 should be obtained by adjusting the pH value to 9.0–10.0, as shown in Fig. 2, in which the XRD data of the as-synthesized CSS0 and CSS5 samples prepared through a high temperature solid state process at 1300 °C for 4 h under an oxygen atmosphere, together with the spectrum from JCPDS card no. 85-0904, are shown. As expected, the Ba3(PO4)2 phase was obtained under feasible conditions, and was exactly indexed to the pure trigonal phase belonging to the space group R
m (no. 166) with cell parameters of a = b = c = 7.711 Å, V = 570.28 Å3, and Z = 1.
 |
| Fig. 1 XRD data of the as-synthesized samples produced by the HT method under 180 °C for 12 h at different pH values, together with the standard data of BaHPO4 (JCPDS card no. 72-1370) and Ba5(PO4)3OH (JCPDS card no. 78-1141) as references. | |
 |
| Fig. 2 (a) XRD data of the as-synthesized samples produced via the CSS route at 1300 °C for 4 h under an oxygen atmosphere and the HT method at 180 °C for 12 h at different pH values. The standard data for Ba3(PO4)2 (JCPDS card no. 85-0904) were used as a reference. (b) Partially enlarged details of the XRD patterns to show the differences in the major peaks. | |
Among the as-synthesized Ba3(PO4)2 samples, the relative intensities of the diffraction peaks obtained under HT conditions were stronger than those obtained under CSS conditions. Moreover, comparing CSS0 and CSS5, the relative intensities of the former were weaker than those of the latter. The degree of crystallization under different reaction conditions may be responsible for these results.16 As mentioned above, the surroundings in a closed environment under HT conditions are better than those in CSS for the generation of highly crystallized products. And in the CSS process, H3BO3, a powdered solid at room temperature, will melt into liquid at about 169 °C, thus a liquid surrounding is created, which can provide more contact room for the solid-state raw materials BaCO3 and NH4H2PO4 so that they are sufficiently mixed and react better.18–20 And finally, in comparison to CSS with 0% H3BO3 (CSS0), CSS5 could produce powders with better crystallization.
On the other hand, for the three typical samples obtained by the HT method, it was observed that the differences in the relative intensities based on (110) and (205) were especially salient, and were due to the different preferential growth orientations caused by the different pH values.5,21,22 A similar phenomenon could also be found in the as-prepared samples using the CSS method, which, however, was probably ascribed to the introduction of H3BO3.
Also note that the full width at half maximum (FWHM) values of the diffraction peaks for the three typical Ba3(PO4)2 samples synthesized under HT conditions were widened compared with those obtained under CSS conditions, as illustrated in Fig. 2(b). Generally speaking, when a crystallite’s size is larger than 200 nm, the FWHM values of diffraction peaks will remain constant and just depend on the instrument (the Bruker D8 Focus XRD, in our work), conversely, they will be broadened due to the inconsistent scattering. Herein, the phenomenon shown in Fig. 2(b) indicates that the average crystallite sizes of as-prepared Ba3(PO4)2 samples produced under HT conditions are on the nanometer scale, smaller than 200 nm, which can be theoretically estimated by the Scherrer equation23–25 as follows:
|
 | (1) |
where
k is a constant of 0.89,
λ is the wavelength of the X-rays (0.15405 nm),
β(2
θ) is FWHM of the considered diffraction peak in radians after correcting for the peak’s broadening due to the instrument,
θ is the Bragg angle (half of the diffraction angle 2
θ), and
Dhkl is the size of the crystallite, which is perpendicular to the plane (
hkl). For the samples synthesized at the pH values of 9.3 (HT9.3), 9.5 (HT9.5) and 9.7 (HT9.7), the average crystallite sizes were estimated to be 71, 66 and 63 nm, respectively. This suggests that the average crystallite size gradually dwindles with an increase in the pH value, which will be verified by SEM experimental results.
3.2. Phase formation, morphology and growth process
It has been found that the pH value plays an important role in the phase structure of the as-formed samples produced via the HT route, which may also have an effect on their morphologies. Fig. 3 demonstrates the SEM images of the final samples obtained at 180 °C for 12 h at different pH values. On the whole, they are micro/nano-structured materials with some differences in morphology. The XRD results indicate that the BaHPO4 phase can be obtained under HT conditions with pH values of 6.0, 7.0, 8.0 and 9.0, and that the morphologies are all microspheres with different sizes and structural components. Fig. 3(A) and (B) show the shapes of BaHPO4 samples obtained at a pH value of 6.0. The homogeneous flower-like microspheres were petalled by a large number of uneven microcuboids, which coincidentally spread outward from the center of the flower-like structures. As the pH value was gradually increased to 7.0, 8.0 and 9.0, a series of microspheres with different sizes was observed, as shown in Fig. 3(C), (E) and (G), respectively. From the corresponding higher magnification SEM images (D), (F) and (H), it could be seen that the petals of the flower-like microspheres seemed to vary with respect to those shown in image (B). Orderly slender nanorods, circular planes formed with aggregated nanorods, and messy and aggregated nanorods were respectively observed to be the basic constituent elements of those microspheres. Increasing the pH value to 10.0 caused the as-formed nanoparticles to be in the Ba5(PO4)3OH phase. Further accurately adjusting the pH value between 9.0 and 10.0 yielded the expected phase Ba3(PO4)2. Fig. 4-1 exhibits the SEM images of Ba3(PO4)2 samples prepared with the pH values at 9.3 (A and B), 9.5 (C and D) and 9.7 (E and F). As depicted in Fig. 4-1(A), (C) and (E), the as-prepared Ba3(PO4)2 samples were composed of well distributed nanoparticles, whose size gradually decreased as the pH value increased from 9.3 to 9.7. Comparing the higher magnification images (B), (D) and (F), it was revealed that the shapes of particles tended to change from round to long, which confirmed the phenomenon of different preferential growth orientations. Moreover, all of these nanoparticles presented a very smooth surface indicating their high crystallinity, as the XRD results had shown.26 For all the as-prepared samples, the possible phase structure formation mechanism, accompanied by morphology architecture details, is shown in Scheme 1. It highlights the roles of both the pH value and CA in the phase formation and morphologies of the final products. The whole process may be described with the following equations. |
3Ba2+ + 2Cit3− → 3Ba2+– 2Cit3− (citrate complex)
| (2) |
|
HPO42− + H3O+ ↔ H2PO4− + H2O ↔ H3PO4 + OH−
| (3) |
(add NH3·H2O into the above solution system)pH = 6.0–9.0, |
H2PO4− + OH− ↔ HPO42− + H2O
| (5a) |
|
3Ba2+– 2Cit3− + 3HPO42− → 3BaHPO4 + 2Cit3−
| (5b) |
pH = 9.0–10.0, |
H2PO4− + 2OH− ↔ PO43− + 2H2O
| (6a) |
|
3Ba2+– 2Cit3− + 2PO43− → Ba3(PO4)2 + 2Cit3−
| (6b) |
pH = 10.0, |
3H2PO4− + 7OH− ↔ [(PO4)3OH]10− + 6H2O
| (7a) |
|
5(3Ba2+– 2Cit3−) + 3[(PO4)3OH]10− → 3Ba5(PO4)3OH + 10Cit3−
| (7b) |
 |
| Fig. 3 SEM images of as-synthesized samples produced under HT conditions at 180 °C for 12 h with the pH value at (A and B) 6.0: flower-like microspheres petalled with microcuboids; (C and D) 7.0: microspheres covered with orderly nanorods; (E and F) 8.0: microspheres/hemispheres constructed by a series of planes formed of aggregated nanorods; (G and H) 9.0: microspheres structured with messy and aggregated nanorods; and (I and J) 10.0: nanoparticles. | |
 |
| Fig. 4 (1) SEM images of as-prepared Ba3(PO4)2 samples produced by the HT method at 180 °C for 12 h at different pH values: (A and B) non-uniform round granular nanoparticles at pH = 9.3; (C and D) mixture of long and round granular nanoparticles at pH = 9.5; and (E and F) long granular nanoparticles at pH = 9.7. (2) SEM images of as-obtained Ba3(PO4)2 samples produced by the CSS method with (G and H) 0 mass% H3BO3 (CSS0): heterogeneous, irregular and shaggy structures; and (I and J) 5 mass% H3BO3 (CSS5): less heterogeneous, regular and smooth structures. | |
 |
| Scheme 1 Schematic illustration of the possible process for forming the as-obtained HT products at different pH values at 180 °C for 12 h. (a) The reaction process, and (b) the details of the formation of the phases and morphologies. The whole process can be summarized as (1) the formation of the Ba2+–citrate complex, (2) ion-exchange between PO43− and citrate, while OH− ions come into effect, and (3) the assembly (pH value at 6.0–9.0) of the unit elements.13,26 | |
The citrate complex (3Ba2+– 2Cit3−) is temporarily formed by an adsorption process when cationic Ba2+ meets with CA, which then waits for the right anion to take the Ba2+ ions away. It is known that H2PO4−, H3PO4 and HPO42− exist synchronously in NH4H2PO4 aqueous solution, as shown in eqn (3), and that adding a moderate amount of NH3·H2O will change the balance of the system. The OH− in NH3·H2O aqueous solution can restrain the right side of the reaction while accelerating the left one, resulting in less and less H3PO4. In our case, when the pH value was adjusted to 6.0–9.0, HPO42− became the selective anion that conducted an ion-exchange reaction with citrate ions to generate the BaHPO4 phase, as represented in eqn (5a) and (5b). Likewise, when an appropriate OH− concentration existed in the reaction system, the phases of Ba3(PO4)2 and Ba5(PO4)3OH, could be obtained, respectively, exactly as eqn (6a), (6b), (7a) and (7b) showed. Throughout the process, various morphologies of products were formed, which are illustrated in Scheme 1(b). Under different pH conditions, Cit3− exhibited different adsorption/desorption abilities that could control the reaction rates to yield products with various morphologies and sizes in the same limited reaction time.13,27 On the other hand, CA has three carboxylic groups and each of them has a unique spatial orientation, which will be highly sensitive to the surface’s molecular structure. Hence, it could assemble the pre-grown elementary structures (microcuboids, nanorods and nanoparticles) together by binding side-on to each and, in view of growth energies, the new crystal nucleus prefers to develop on the existing growth steps to form the final flower-like structures, spheres and aggregated round/long particles.8,13,27–29 Taking into consideration the fact that the Ba3(PO4)2 crystallite size decreases as the pH value increases from 9.3 to 9.7, the citrate complex 3Ba2+– 2Cit3− and OH− have comprehensive actions. As eqn (6a) shows, the increasing OH− concentration will destroy the balance of the reaction system and promote the right reaction to produce more PO43−, which will immediately react with 3Ba2+– 2Cit3−, as demonstrated in eqn (6b), to form more and more Ba3(PO4)2 crystal nuclei before the initially formed Ba3(PO4)2 crystal nuclei grow. According to the growth route, Ba3(PO4)2 nanoparticles with a smaller size can be obtained when the pH value is increased.
Moreover, the SEM images of Ba3(PO4)2 samples prepared by the CSS method, with 0 mass% (G and H) and 5 mass% (I and J) H3BO3, are shown in Fig. 4-2. These indicate that regular and smooth blocks with good distribution could be achieved with the additional 5 mass% H3BO3 added in the raw materials, while irregular and shaggy blocks were observed without H3BO3, which implied that a proper amount of H3BO3 could work as a “shape modifier”, like an organic additive to improve the crystallization, shape and surface smoothness. The possible influencing mechanism is illustrated in Scheme 2. In the growth process, H3BO3 melts into a liquid phase, promoting the mobility and homogeneity of solid reactants to gain products with fewer surface defects on the one hand, and to eliminate the aggregation of solid–solid contact for the formation of well dispersed particles on the other hand.18,19,31
 |
| Scheme 2 Schematic for the formation of the morphologies of the as-prepared Ba3(PO4)2 samples by the CSS method with (a) 0 mass% H3BO3: direct solid–solid boundaries, aggregation nucleation to form irregular and shaggy blocks without liquid surroundings; and (b) 5 mass% H3BO3: sufficient mixing, fewer direct solid–solid boundaries and less homogeneous nucleation to form smooth and well dispersed particles in a liquid environment.18,30 | |
Comparing Fig. 4-1 with 4-2, it should be emphasized that the particle sizes of as-synthesized Ba3(PO4)2 samples using the different methods were on different scales. Obviously, the size of products obtained by HT was on the nanoscale, while that of products obtained by CSS was in the micron range. This difference in size may have a big influence on the luminescence properties of Ba3(PO4)2 as previously reported in the case of ZnO.32,33
3.3. Luminescence properties and mechanism
Fig. 5 exhibits the photoluminescence excitation and emission spectra of the series of as-synthesized samples produced via the CSS and HT methods, respectively. As can be seen in Fig. 5(a) and (b), the Ba5(PO4)3OH, Ba3(PO4)2 and BaHPO4 samples, which were obtained using the HT method at pH values of 10.0, 9.5 and 8.0, respectively, demonstrated similar profiles in both their excitation and emission spectra with different peaks and relative intensities. Moreover, according to the phase order of Ba5(PO4)3OH, Ba3(PO4)2 and BaHPO4, blue shifts of 2–5 nm could be observed in their emission spectra, with peaks at 447, 444 and 442 nm, respectively. In essence, all of these differences may result from the different phase structures.
 |
| Fig. 5 (a) Excitation spectra of the Ba3(PO4)2 sample prepared by the CSS method with 5 mass% H3BO3, and samples of Ba5(PO4)3OH, Ba3(PO4)2 and BaHPO4 obtained by the HT route at pH values of 10, 9.5 and 8, respectively. (b) Emission spectra of Ba5(PO4)3OH, Ba3(PO4)2 and BaHPO4. (c) Emission spectra of a series of Ba3(PO4)2 samples synthesized by the CSS (with 0 and 5 mass% H3BO3) and HT (pH = 9.3, 9.5 and 9.7) methods, respectively. (d) Energy scheme for the luminescence process of a PO43− molecule. | |
As for the as-formed Ba3(PO4)2 phase samples produced via the CSS and HT methods, respectively, there are many differences in their photoluminescence properties. The excitation spectra in Fig. 5(a) illustrate that the excitation spectrum of Ba3(PO4)2 prepared by CSS was composed of two broad bands from 225 to 400 nm with the intense peak at 320 nm, while that synthesized by HT presented only a broad band from 250 to 420 nm centred at 376 nm, between which an obvious red shift of 56 nm existed. At the same time, a similar phenomenon could also be observed in their emission spectra, as shown in Fig. 5(c), which indicate that the emission peaks of the as-obtained Ba3(PO4)2 samples produced by the CSS and HT routes were at 414 and about 444 nm, respectively. The photoluminescence spectra show that the as-prepared blue emission Ba3(PO4)2 phosphor can be applied to the white light emitting method of n-UV conversion tri-color phosphors. Also note that the FWHM values of the emission peaks for the Ba3(PO4)2 samples produced by HT have been broadened and the relative intensities were higher in comparison to those produced by CSS, which is consistent with the XRD results. Moreover, a new sharp emission peak at 403 nm could be observed in the emission spectrum of Ba3(PO4)2 synthesized by the HT route. All these phenomena may be ascribed to their size being on the nanometer scale. As we all know, the small size effect, surface and interface effect, quantum size effect, macroscopic quantum tunnel effect and dielectric confinement effect are the five main specific effects of nanomaterials, among which the first two are the most investigated for their effects on luminescence properties.34,35 Generally, the occurrence of red shifts can probably be attributed to the surface and interface effect. In more detail, the surface tension of nanoparticles will increase due to the surface and interface effect, which could increase the crystal field leading to changes in the energy levels or the narrowing of the band gap. And the small size effect can generate two results. With a decrease in the size of nanomaterials, the crystal periodic boundary conditions will be destroyed, leading to the introduction of an unordered phase resulting in the broadening of emission peaks on the one hand. And on the other hand, the relevant specific surface area will increase promptly, which puts numerous surface atoms in an exposed state, so that many surface defects are inevitable. As a result, the spectral composition may change, leading to, for example, the observed new sharp absorption peak in our case. At the nanometer scale, a material’s properties are highly sensitive to the particle sizes. With an increase in the pH value from 9.3 to 9.7 under HT conditions, there was a gradual increase in the relative intensities and narrowing in the FWHM for the Ba3(PO4)2 samples, as listed in Table 1. From the results of XRD in Fig. 2, it could be seen that the diffraction intensities, especially along the planes (110) and (205), slowly increased according to the sample sequence of HT9.3, HT9.5, and HT9.7, which implied that better and better crystallinity of the particles was achieved as the pH value was increased from 9.3 to 9.7. Combining the above results, it can be concluded that particles with better crystallinity show higher emission intensities in our current work, which can also be used to interpret the phenomenon that CSS5 (with 5 mass% H3BO3) shows a stronger relative intensity than CSS0 (without H3BO3) when produced via CSS. At the same time, all of these phenomena can be supported by the SEM results showing surface smoothness and good graininess.
Table 1 A summary of emission peak positions, FWHM values, relative intensities and particle sizes for the as-synthesized Ba3(PO4)2 samples produced by the CSS and HT routes
Ba3(PO4)2 samples prepared under CSS and HT conditions |
Emission peak (nm) |
FWHM (nm) |
Relative intensity (a.u.) |
Particle size (nm) |
CSS 0% H3BO3 |
414 |
33.44 |
0.2329 |
— |
CSS 5% H3BO3 |
414 |
34.52 |
0.4095 |
— |
HT pH = 9.3 |
435 |
78.53 |
0.3778 |
71 |
HT pH = 9.5 |
444 |
76.35 |
0.6745 |
66 |
HT pH = 9.7 |
443 |
72.91 |
1.0015 |
63 |
The photoluminescence mechanism of the as-prepared BaHPO4, Ba3(PO4)2 and Ba5(PO4)3OH hosts can be described as similar to that of (MoO42−),36 (WO42−),37 and (VO43−).38,39 This involves using the model of the MO4n− (n = 1, 2, 3 and 4) complex, due to the common closed-shell electronic configurations, which is one of the four common kinds of luminescence centers, namely, ns2 type, transition metal, lanthanide metal and complex ions luminescence centers.40 Actually, the outer electron configuration of the P atom is 3s23p3, and in our case, four unequal sp3 hybrid orbitals are formed when bonding with the O atom, of which the one occupied by a pair of electrons has a lower energy and the other three, each occupied by a single electron, have a higher energy, so that a coordination bond and three covalent bonds come into being between P and O. Therefore, the [PO4] group is a deformation tetrahedron with P as the center. Based on the above discussion, the P5+ ion has a closed-shell electronic configuration with an empty 3d orbital in PO43−. Corresponding to the electron charge–transfer transition process from the O2p orbital (t1 symmetry in Td) to the 3d orbital (e and t2 symmetry) of the P5+ ion, a broad blue band ranging from 380 to 625 nm was observed with excitation. To make the luminescence process clearer, the molecular orbital theory41 is usually used. A molecular orbital calculation leads to e and t1 states for the lowest unoccupied molecular orbital (LUMO) and the highest occupied molecular orbital (HOMO), respectively. By taking the e → t1 transition into account, the excited electronic states of the t1e electronic configuration in Td symmetry are found to consist of 3T1 ≦ 3T2 < 1T1 < 1T1, in the order of increasing energy, the ground state being the 1A1 state. The orbital triplets (3T1, 3T2) have degenerate levels in the spectral region of 250 to 500 nm. Herein, Fig. 5(d) gives the three-level energy scheme for the luminescence process of a PO43− molecule. Since the photoluminescence properties of nano-samples produced under HT conditions will have some differences, the CSS-yielded Ba3(PO4)2 sample was used to illustrate the luminescence process of PO43−, which can be described in detail as follows. Combining Fig. 5(a), (c) and (d), when excited at a wavelength of 271/320 nm, electrons can be excited from the ground state 1A1 to the excited states 1T2/1T1, following a non-radiative (NR) transition process among the excited states of PO43− the electrons are then transferred to 3T1, and finally electrons return to the ground state and give the emission of the PO43− ion centred at 414 nm.
Fig. 6 depicts the decay curves of the as-prepared hosts BaHPO4, Ba3(PO4)2 and Ba5(PO4)3OH. The decay curves of BaHPO4 and Ba3(PO4)2 were well fitted with a typical single-order exponential decay mode (eqn (8))42 while that of Ba5(PO4)3OH was second-order (eqn (9)).43
|
I(t) = I0 exp(−t/τ)
| (8) |
|
I(t) = I0 + A1 exp(−t/τ1) + A2 exp(−t/τ2)
| (9) |
|
τ* = (A1τ12 + A2τ22)/(A1τ1 + A2τ2)
| (10) |
where
I0 expresses the initial emission intensity immediately after being excited,
I(
t) is the luminescence intensity at time
t;
A1 and
A2 are the fitting constants, and
τ1 and
τ2 are the decay times for the corresponding components. Based on the above
eqn (8) and
(9), the average decay times were determined to be 13.05, 12.25 and 31.54 ns for BaHPO
4, HT-Ba
3(PO
4)
2 and CSS-Ba
3(PO
4)
2 (HT/CSS-Ba
3(PO
4)
2 denotes the sample generated by the HT/CSS route), respectively, and that of Ba
5(PO
4)
3OH could be calculated by
eqn (10),
37 which was 169.64 ns. Firstly, the decay time of CSS-Ba
3(PO
4)
2 is about 2.5 times that of HT-Ba
3(PO
4)
2. That is, the decay time of nano-Ba
3(PO
4)
2 is dramatically shortened compared with that of bulk-Ba
3(PO
4)
2, which may be ascribed to the increased quenching centers on the nanomaterial’s surface resulting from the interface and surface effect.
35,43,44 Secondly, we can note that the decay times of BaHPO
4 and HT-Ba
3(PO
4)
2 are almost the same, while that of Ba
5(PO
4)
3OH is about 12 times larger than them, even though the spectral compositions are the same with respect to nano-BaHPO
4, -Ba
3(PO
4)
2 and -Ba
5(PO
4)
3OH. These phenomena demonstrate that the change in the anionic groups can accordingly lead to a change in the decay times, further certifying that the main luminescence center comes from the [PO
4] group for the three hosts, ignoring their different structures. It is known that the trigonal Ba
3(PO
4)
2, orthorhombic BaHPO
4 and hexagonal Ba
5(PO
4)
3OH in our work have different electronic structures, so that electrons should accordingly have different transition probabilities from the excited state to ground state, which result in various lifetimes. It is clear that the change in decay mode and the big difference in lifetime between nano-Ba
3(PO
4)
2 and -Ba
5(PO
4)
3OH indicate the big impact of the substitution of three OH
− for one PO
43− on the electronic structures or transition probability, and that this needs to be explored further.
 |
| Fig. 6 Decay curves of host emissions for samples obtained via the HT method (BaHPO4, Ba3(PO4)2 and Ba5(PO4)3OH) and CSS method (Ba3(PO4)2), respectively. | |
4. Conclusions
In summary, this work has revealed a facile HT route for the synthesis of a series of micro/nanomaterials of BaHPO4, Ba3(PO4)2 and Ba5(PO4)3OH. By precisely adjusting the pH values, micro/nanospheres of BaHPO4, nanoparticles of Ba3(PO4)2 and Ba5(PO4)3OH with different sizes could be obtained. A particular mechanism of action governed by pH values was described in the phases and morphologies forming process, meanwhile, the different adsorption/desorption abilities of CA under different pH conditions and its molecular space-specific influences were considered to have a large effect. Interestingly, the as-synthesized three hosts were all found to emit blue light in a broad band from 380 to 625 nm for the first time, for which the complex ions luminescence mode was proposed. For comparison, Ba3(PO4)2 was also prepared by CSS, and the photoluminescence spectrum showed a blue shift. The small volume effect, and the interface and surface effect of nanomaterials were used to interpret this shift. These phenomena are conducive to facilitating the potential application of the Ba3(PO4)2 host in n-UV conversion tri-color phosphors. Furthermore, the decay lifetimes of BaHPO4, Ba5(PO4)3OH, HT-Ba3(PO4)2 and CSS-Ba3(PO4)2 were determined to be 13.05, 169.64, 12.25 and 31.54 ns, respectively. The differences in the decay lifetimes of HT-Ba3(PO4)2 and CSS-Ba3(PO4)2 were discussed to come from the quenching centers on the surface of the nanomaterial HT-Ba3(PO4)2, while those among nano-BaHPO4, -Ba3(PO4)2 and -Ba5(PO4)3OH were ascribed to their different electronic structures and therefore the varying transition probabilities from the excited state to the ground state.
Acknowledgements
This work was supported by the National Natural Science Foundation of China (Grant nos 21171152 and 21301162), the Guangdong Province Enterprise-University-Academy Collaborative Project (no. 2012B091100474), and by Public Service Project of the Chinese Ministry of Land and Resources (201311024).
Notes and references
- I. Tale, J. Lumin., 1979, 20, 343–347 CrossRef CAS.
- S. Poort, H. Reijnhoudt, H. Van der Kuip and G. Blasse, J. Alloys Compd., 1996, 241, 75–81 CrossRef CAS.
- H. Liang, Y. Tao, Q. Zeng, H. He, S. Wang, X. Hou, W. Wang and Q. Su, Mater. Res. Bull., 2003, 38, 797–805 CrossRef CAS.
- F. Chen, X. Yuan, X. Xiong and L. Liu, J. Chin. Rare Earth Soc., 2011, 29, 450–454 CAS.
- G. Li, C. Peng, C. Li, P. Yang, Z. Hou, Y. Fan, Z. Cheng and J. Lin, Inorg. Chem., 2010, 49, 1449–1457 CrossRef CAS PubMed.
- D. Yue, W. Lu, C. Li, X. Zhang, C. Liu and Z. Wang, Nanoscale, 2014, 6, 2137–2145 RSC.
- J. P. Liu, X. T. Huang, Y. Y. Li, K. M. Sulieman, X. He and F. L. Sun, Cryst. Growth Des., 2006, 6, 1690–1696 CAS.
- S. P. Garcia and S. Semancik, Chem. Mater., 2007, 19, 4016–4022 CrossRef CAS.
- C. Mu and J. He, Mater. Lett., 2012, 70, 101–104 CrossRef CAS PubMed.
- G. Li, C. Peng, C. Zhang, Z. Xu, M. Shang, D. Yang, X. Kang, W. Wang, C. Li and Z. Cheng, Inorg. Chem., 2010, 49, 10522–10535 CrossRef CAS PubMed.
- G. Demazeau, Z. Naturforsch., B: Chem. Sci., 2010, 65, 999–1006 CAS.
- L. A. Ramajo, F. Rubio-Marcos, A. D. Campo, J. F. Fernández, M. S. Castro and R. Parra, Ceram. Int., 2014, 40, 14701–14712 CrossRef CAS PubMed.
- M. Yang, H. You, Y. Zheng, K. Liu, G. Jia, Y. Song, Y. Huang, L. Zhang and H. Zhang, Inorg. Chem., 2009, 48, 11559–11565 CrossRef CAS PubMed.
- Q. Zhu, J. G. Li, R. Ma, T. Sasaki, X. Yang, X. Li, X. Sun and Y. Sakka, J. Solid State Chem., 2012, 192, 229–237 CrossRef CAS PubMed.
- C. Zhang, L. Zhang, C. Song, G. Jia, S. Huo and S. Shen, J. Alloys Compd., 2014, 589, 185–191 CrossRef CAS PubMed.
- G. Jia, H. You, M. Yang, L. Zhang and H. Zhang, J. Phys. Chem. C, 2009, 113, 16638–16644 CAS.
- S. Som, P. Mitra, V. Kumar, V. Kumar, J. J. Terblans, H. C. Swart and S. K. Sharma, Dalton Trans., 2014, 9860 RSC.
- Y. Yu, H. Wang, L. Li, Y. Chen and R. Zeng, Ceram. Int., 2014, 40, 14171–14175 CrossRef CAS PubMed.
- T. T. Lai, C. C. Chang, C. Y. Yang, S. Das and C. H. Lu, Ceram. Int., 2013, 39, 159–163 CrossRef CAS PubMed.
- S. Som, A. K. Kunti, V. Kumar, V. Kumar, S. Dutta, M. Chowdhury, S. K. Sharma, J. J. Terblans and H. C. Swart, J. Appl. Phys., 2014, 115, 193101 CrossRef PubMed.
- Y. Wu, Q. Gu, G. Ding, F. Tong, Z. Hu and A. M. Jonas, ACS Macro Lett., 2013, 2, 535–538 CrossRef CAS.
- T. Reimer, I. Paulowicz, R. Roder, S. Kaps, O. Lupan, S. Chemnitz, W. Benecke, C. Ronning, R. Adelung and Y. K. Mishra, ACS Appl. Mater. Interfaces, 2014, 6, 7806–7815 CAS.
- V. Uvarov and I. Popov, Mater. Charact., 2013, 85, 111–123 CrossRef CAS PubMed.
- L. Zhou and B. Yan, J. Phys. Chem. Solids, 2008, 69, 2877–2882 CrossRef CAS PubMed.
- A. K. V. Raj, P. Prabhakar Rao, T. S. Sreena, S. Sameera, V. James and U. A. Renju, Phys. Chem. Chem. Phys., 2014, 16, 23699–23710 RSC.
- H. Lai, Y. Du, M. Zhao, K. Sun and L. Yang, Ceram. Int., 2014, 40, 1885–1891 CrossRef CAS PubMed.
- C. Li, J. Yang, P. Yang, H. Lian and J. Lin, Chem. Mater., 2008, 20, 4317–4326 CrossRef CAS.
- Y. Xu, S. Xu, S. Wang, Y. Zhang and G. Li, Dalton Trans., 2014, 479–485 RSC.
- Y. K. Mishra, S. Kaps, A. Schuchardt, I. Paulowicz, X. Jin, D. Gedamu, S. Wille, A. Kovalev, O. Lupan and R. Adelung, KONA Powder Part. J., 2014, 31, 92–110 CrossRef CAS.
- Z. He, Y. Ueda and M. Itoh, J. Cryst. Growth, 2006, 297, 1–3 CrossRef CAS PubMed.
- L. Cheng, H. Zhong, J. Sun, X. Zhang, Y. Peng, T. Yu and X. Zhao, J. Rare Earths, 2008, 26, 211–214 CrossRef.
- N. Pan, B. Wang, X. P. Wang and J. G. Hou, J. Mater. Chem., 2010, 20, 5567–5581 RSC.
- Y. K. Mishra, S. Kaps, A. Schuchardt, I. Paulowicz, X. Jin, D. Gedamu, S. Freitag, M. Claus, S. Wille, A. Kovalev, S. N. Gorb and R. Adelung, Part. Part. Syst. Charact., 2013, 30, 775–783 CrossRef CAS.
- S. D. Zhu, G. S. Zhou, R. Cai, Y. Han and W. Tian, China. Heat Treat. Technol., Equip., 2010, 31, 1–5 Search PubMed.
- J. L. Zhang and G. Y. Hong, Chin. J. Lumin., 2005, 26, 285–293 CAS.
- T. Skibiński, S. M. Kaczmarek, G. Leniec, T. Tsuboi, Y. Nakai, M. Berkowski, Z. Kowalski and W. Huang, J. Cryst. Growth, 2014, 401, 802–806 CrossRef PubMed.
- X. C. Chu, Y. N. Xu and L. T. Li, J. Mater. Sci.: Mater. Electron., 2014, 25, 2601–2604 CrossRef CAS.
- A. Barros, R. Deloncle, J. Deschamp, P. Boutinaud, G. Chadeyron, R. Mahiou, E. Cavalli and M. G. Brik, Opt. Mater., 2014, 36, 1724–1729 CrossRef CAS PubMed.
- V. Kumar, A. K. Bedyal, J. Sharma, V. Kumar, O. M. Ntwaeaborwa and H. C. Swart, Appl. Phys. A, 2014, 116, 1785–1792 CrossRef CAS.
- Z. Xia, Y. Liang, W. Huang, D. Yu, M. Zhang and M. Tong, Ceram. Int., 2013, 39, 7097–7100 CrossRef CAS PubMed.
- C. J. Ballhausen and A. D. Liehr, J. Mol. Spectrosc., 1958, 2, 342–360 CrossRef CAS.
- Z. Xia, Y. Liang, D. Yu, M. Zhang, W. Huang, M. Tong, J. Wu and J. Zhao, Opt. Laser Technol., 2014, 56, 387–392 CrossRef CAS PubMed.
- A. I. Becerro, S. Rodríguez-Liviano, A. J. Fernández-Carrión and M. Ocaña, Cryst. Growth Des., 2013, 13, 526–535 CAS.
- D. Li, S. Z. Lu, J. S. Zhang, J. Y. Liu, H. Y. Wang, L. D. Sun and S. H. Huang, Chin. J. Lumin., 2002, 21, 134–138 Search PubMed.
|
This journal is © The Royal Society of Chemistry 2015 |
Click here to see how this site uses Cookies. View our privacy policy here.