Effect of ionic composition on the partitioning of organic compounds in octanol–buffer systems

Luisa A. Ferreira a, Andrew Chervenaka, Steve Plackoa, Aimee Kestraneka, Pedro P. Madeirab and Boris Y. Zaslavsky*a
aAnaliza, 3615 Superior Ave., Suite 4407B, Cleveland, Ohio 44114, USA. E-mail: Boris.Zaslavsky@Cleveland-Diagnostics.com; Tel: +1-216-432-2700
bLaboratory of Separation and Reaction Engineering, Dpt. de Engenharia Química, Faculdade de Engenharia da Universidade do Porto, Rua Dr Roberto Frias, s/n 4200-465, Porto, Portugal

Received 3rd November 2014 , Accepted 4th February 2015

First published on 6th February 2015


Abstract

The distribution of 29 drug compounds was examined in octanol–buffer systems with eight different ionic compositions at pH 7.4. It was found that the ionic composition of the octanol–buffer system has a noticeable and unpredictable effect on the log[thin space (1/6-em)]D7.4 values for different compounds. It was established that the response of the compounds to different ionic environments, displayed as log[thin space (1/6-em)]D7.4 values, are linearly interrelated, which is similar to the different properties of compounds in organic solvent-free aqueous solutions reported previously [Ferreira et al., Phys. Chem. Chem. Phys. 2014, 16, 23347]. An analysis of the role of the different structural features of compounds examined in their ionic responsiveness showed that the molecular polarizability and polar surface area are the two most important features. This suggests that the relationships reported here and previously are based on the same physical principles that must be considered in any theoretical model of solute–water interactions in aqueous solutions containing salt additives.

1. Introduction

Lipophilicity is well recognized as an important physicochemical property of chemical compounds. It is commonly used as a compound descriptor in medicinal chemistry, drug design, toxicology, and environmental studies.1–4 Several quantitative structure-biological activity relationships (QSAR) have been reported in the literature based on this descriptor.1–4

Lipophilicity is generally measured by the logarithm of the partition coefficient (log[thin space (1/6-em)]P) of a solute in the octanol–water biphasic system. The log[thin space (1/6-em)]P term represents the partition coefficient of the solute in its un-ionized form, and the distribution coefficient (log[thin space (1/6-em)]D) for the same solute refers to the ratio of the sum of the concentrations of all forms of the compound (ionized plus un-ionized) in each of the two phases. For ionizable compounds, the log[thin space (1/6-em)]D parameter is pH- and ionic strength-dependent.5

A large database of measured log[thin space (1/6-em)]D and log[thin space (1/6-em)]P values is available1 and several calculation methods (see, e.g. in ref. 5–7) provide a prediction of the log[thin space (1/6-em)]P and log[thin space (1/6-em)]D values. Most of the computational techniques are “fragment constant” methods, in which a structure is divided into previously defined fragments and the corresponding contributions are summed together to yield the final log[thin space (1/6-em)]P estimate. The contributions of the fragments used in these calculations are obviously only as good as the experimental data from which they are derived and many correction factors are commonly used. Therefore, the experimental log[thin space (1/6-em)]P, especially log[thin space (1/6-em)]D values, are still viewed as the most reliable source of information on the lipophilicity of organic compounds.

An analysis of the literature data compiled by Hansch et al.1 indicates that the log[thin space (1/6-em)]D values for many compounds reported by different authors vary quite dramatically. For example, the log[thin space (1/6-em)]D values for atenolol at pH 7.4 vary from −2.00 to −0.11 [ref. 1, p. 127], and log[thin space (1/6-em)]D values for chlorpromazine also at pH 7.4 vary from 1.90 to 3.50 [ref. 1, p. 149]. Two questions arise immediately – why do the log[thin space (1/6-em)]D values reported by different authors differ so much, and what are the correct values? To select the correct values it is important to explain the observed discrepancies.

The likely answer seems to be that different authors might use different buffers in the octanol–buffer systems, and only the pH value used is commonly reported in the literature. The ionic composition of an aqueous phase in an octanol–buffer system affects the solute partitioning in the system,8–10 but very limited studies of the salt and buffer effects have been reported.11–14

This study examined and compared the effects of the salt composition on the partitioning of randomly selected drugs in octanol–buffer systems. An additional purpose was to determine if the response of these compounds to different ionic environments in octanol–buffer systems would follow the relationship established previously.15 A linear relationship was observed between the response of the organic compounds15 and even proteins (unpublished data) to the different ionic environments in three or more dimensional space in organic solvent-free aqueous media. An analysis of the data obtained in the study provided a new insight into the effects of the ionic composition on the solute–water interactions, which will be discussed below.

2. Experimental section

2.1 Materials

All compounds were purchased from Sigma-Aldrich (St. Louis, MO) with the exception of atenolol, which was obtained from MP Biomed (Santa Ana, CA), and used as received. The purity of the compounds was ≥95%, as specified in the accompanying documentation. 10 mM stock solutions of all the compounds were prepared in DMSO.

Dimethyl sulfoxide (Cat# D1258) was purchased from Spectrum, Gardena, CA. 1-Octanol (J.T. Baker Cat# 9085-01), and polypropylene 96 well plates (Cat# AWLS-219002) were purchased from Arctic White (Bethleham, Pennsylvania). All inorganic salts and other chemicals used were of analytical-reagent grade or HPLC grade.

2.2 Octanol–buffer partitioning

The universal buffer (UB) was composed of 0.01 M or 0.10 M each of phosphoric, boric, and acetic acids adjusted to pH 7.4 with NaOH. The sodium phosphate buffer (NaPB) was composed of 0.01 M or 0.10 M each of Na2HPO4 and 0.01 M or 0.10 M NaH2PO4 with a final pH of 7.4.

For phase preparation, equal parts of a given buffer and 1-octanol were combined and shaken on a rotary shaker at 200 rpm for 1 hour, after which the mixture was transferred to a separation funnel for 72 h. The phases were separated, and for octanol–buffer partitioning, octanol was saturated with the appropriate buffer and a given buffer solution saturated with octanol were used to prepare the partitioning plates for the assay. Analiza's standard partitioning deep-well plates were used.

The DMSO stock solutions (25 μL) of each compound were added to the octanol–buffer system with a 250 μL total volume in each well of the partitioning plate to a final concentration of 10% DMSO. The plate was sealed, vortexed on a deep-well plate mixer, and centrifuged to accelerate phase settling. The assay was conducted on the Analiza, Inc. ADW workstation with chemiluminescent nitrogen detector (CLND). Aliquots of the octanol and aqueous phases were withdrawn and injected into the CLND detector. Customized software provides automated quantification, calculation and reporting of the data. The log[thin space (1/6-em)]D values reported here for the DMSO-free octanol–buffer system were calculated from the experimentally determined log[thin space (1/6-em)]D values (measured in triplicate and averaged) in the presence of DMSO using the previously established linear relationship between log[thin space (1/6-em)]D values for compounds in octanol–buffer and in octanol–buffer–DMSO (10 mM) systems. The linear relationship between the log[thin space (1/6-em)]D values in the octanol–buffer system without DMSO (log[thin space (1/6-em)]D) and in the system containing 20% DMSO (log[thin space (1/6-em)]DDMSO) is as follows: log[thin space (1/6-em)]D = 0.40±0.03 + 1.14±0.03[thin space (1/6-em)]log[thin space (1/6-em)]DDMSO. The slope and the intercept values of a similar proprietary relationship for octanol–buffer system with 10% DMSO are smaller.

3. Results and discussion

It should be emphasized that in view of the purpose of this study, the peculiarities of the partition behavior of each compound were not considered. The logarithms of the distribution coefficients values for the compounds determined in different octanol–buffer systems are presented in Tables 1 and 2. Only four drugs (5-hydroxytryptophan, amoxicillin, carbamazepine, and harmine) out of 29 explored displayed log[thin space (1/6-em)]D values essentially independent of the buffer composition of the aqueous phase in the systems examined. The average log[thin space (1/6-em)]D values for these compounds were: −2.02 ± 0.05 for 5-hydroxytryptophan (#1); −3.4 ± 0.13 for amoxicillin (#4), 1.42 ± 0.06 for carbamazepine (#6), and 2.49 ± 0.03 for harmine (#13).
Table 1 log[thin space (1/6-em)]D valuesa for the indicated compounds in various octanol–buffer systems (NaPB – sodium phosphate buffer, pH 7.4; UB – universal buffer, pH 7.4)
# Compound pKab 0.01 M NaPB 0.01 M UB 0.10 M NaPB 0.10 M UB
a Values in parenthesis indicate the errors in the presented log[thin space (1/6-em)]D values.b pKa values from multiple literature sources should be viewed as approximate as they may vary with the salt composition and temperature, and may also be affected by the presence of organic solvent.
1 5-Hydroxytryptophan 2.2 −1.95 (0.08) −2.00 (0.09) −1.95 (0.08) −2.09 (0.08)
2 Acebutolol·HCl 9.2 −0.09 (0.01) 0.00 (0.02) 0.04 (0.004) 0.46 (0.02)
3 α-Methyldopa 1.7; 9.8 −2.14 (0.09) −2.35 (0.08) −2.06 (0.09) −3.19 (0.09)
4 Amoxicillin 2.4; 7.1; 9.5 −3.18 (0.09) −3.4 (0.1) −3.05 (0.09) −3.18 (0.08)
5 Atenolol 9.6 −0.21 (0.01) −0.18 (0.01) −1.43 (0.07) −0.81 (0.05)
6 Carbamazepine 2.3 1.48 (0.08) 1.34 (0.05) 1.47 (0.09) 1.39 (0.08)
7 Chlorpromazine·HCl 9.3 2.03 (0.09) 2.20 (0.08) 3.25 (0.08) 3.38 (0.09)
8 Clonidine·HCl 8.0 0.84 (0.07) 0.91 (0.05) 1.20 (0.07) 1.34 (0.06)
9 Desipramine·HCl 10.0 0.81 (0.05) 0.85 (0.06) 1.32 (0.08) 1.70 (0.08)
10 Diclofenac·Na 4.0 0.05 (0.01) −0.04 (0.003) 0.69 (0.05) 0.60 (0.03)
11 Doxepin·HCl 8.0 1.41 (0.06) 1.48 (0.07) 2.46 (0.09) 2.62 (0.07)
12 Furosemide 3.9 −1.77 (0.08) −1.86 (0.09) −1.58 (0.09) −1.59 (0.08)
13 Harmine 7.7 2.51 (0.08) 2.47 (0.07) 2.51 (0.08) 2.48 (0.09)
14 Homochlorcyclizine·2HCl 8.6 0.43 (0.03) 0.92 (0.07) 2.70 (0.09) 2.88 (0.08)
15 Hydrochlorothiazide 7.9 −0.37 (0.02) −0.48 (0.03) −0.35 (0.02) −0.50 (0.03)
16 Imipramine 9.5 1.50 (0.05) 1.60 (0.05) 2.62 (0.09) 2.84 (0.09)
17 Indomethacin 3.8 0.71 (0.06) 0.63 (0.04) 0.63 (0.04) 0.55 (0.04)
18 Maprotiline·HCl 10.5 0.83 (0.05) 0.88 (0.06) 1.28 (0.05) 1.63 (0.07)
19 Mefexamide·HCl 9.0 0.37 (0.02) 0.43 (0.03) 0.85 (0.04) 1.21 (0.04)
20 Metoprolol·(1/2tartrate) 9.6 −0.33 (0.02) −0.19 (0.01) 0.03 (0.002) 0.47 (0.01)
21 Minaprine·2HCl 6.2 −0.46 (0.03) 0.37 (0.05) 2.04 (0.08) 2.03 (0.09)
22 Piroxicam 4.7 −0.31 (0.02) −0.39 (0.04) −0.83 (0.06) −0.90 (0.02)
23 Propranolol·HCl 9.5 0.71 (0.05) 0.77 (0.06) 1.39 (0.05) 1.67 (0.04)
24 Sulfamethizole 5.4 −1.07 (0.05) −1.18 (0.08) −2.18 (0.09) −2.48 (0.07)
25 Terbutaline·(1/2SO4) 8.8; 10.1 −1.23 (0.04) −1.09 (0.09) −1.33 (0.07) −0.87 (0.03)
26 Terfenadine 8.5 >4.77 >4.85 4.7 (0.3) 3.9 (0.2)
27 Theophylline 8.7 0.08 (0.01) 0.11 (0.01) 0.13 (0.008) 0.00 (0.002)
28 Thioridazine·HCl 9.5 2.07 (0.08) 2.40 (0.08) 3.45 (0.09) 3.60 (0.18)
29 Verapamil·HCl 9.6 1.65 (0.05) 1.79 (0.08) 2.79 (0.08) 3.03 (0.10)


Table 2 log[thin space (1/6-em)]D valuesa for indicated compounds in various octanol–buffer systems (NaPB – sodium phosphate buffer, pH 7.4; UB – universal buffer, pH 7.4)
# Compound 0.15 M NaCl in
0.01 M NaPB 0.01 M UB 0.10 M NaPB 0.10 M UB
a Values in parenthesis indicate the errors in the presented log[thin space (1/6-em)]D values.
1 5-Hydroxytryptophan −2.03 (0.09) −2.05 (0.08) −1.98 (0.08) −2.07 (0.09)
2 Acebutolol·HCl −0.19 (0.01) −0.10 (0.01) 0.08 (0.01) 0.40 (0.02)
3 α-Methyldopa −2.24 (0.07) −2.28 (0.08) −2.13 (0.07) −3.09 (0.09)
4 Amoxicillin −3.37 (0.08) −3.38 (0.09) −3.11 (0.09) −3.21 (0.09)
5 Atenolol −0.08 (0.01) −0.25 (0.02) −1.38 (0.06) −0.85 (0.04)
6 Carbamazepine 1.44 (0.03) 1.37 (0.05) 1.49 (0.05) 1.41 (0.06)
7 Chlorpromazine·HCl 2.35 (0.09) 2.17 (0.06) 3.18 (0.08) 3.49 (0.09)
8 Clonidine·HCl 0.64 (0.05) 0.66 (0.04) 1.13 (0.07) 1.29 (0.08)
9 Desipramine·HCl 1.03 (0.05) 1.01 (0.05) 1.40 (0.07) 1.60 (0.09)
10 Diclofenac·Na 0.62 (0.03) 0.55 (0.02) 0.85 (0.04) 0.78 (0.04)
11 Doxepin·HCl 1.47 (0.06) 1.35 (0.07) 2.40 (0.08) 2.62 (0.09)
12 Furosemide −1.46 (0.07) −1.51 (0.08) −1.47 (0.06) −1.49 (0.06)
13 Harmine 2.51 (0.09) 2.45 (0.08) 2.53 (0.09) 2.49 (0.08)
14 Homochlorcyclizine·2HCl 1.43 (0.06) 1.36 (0.05) 2.67 (0.09) 2.8 (0.1)
15 Hydrochlorothiazide −0.42 (0.03) −0.50 (0.03) −0.37 (0.04) −0.53 (0.02)
16 Imipramine 1.69 (0.08) 1.58 (0.06) 2.58 (0.08) 2.85 (0.09)
17 Indomethacin 1.02 (0.03) 0.94 (0.03) 0.81 (0.04) 0.74 (0.04)
18 Maprotiline·HCl 1.22 (0.04) 1.13 (0.05) 1.42 (0.04) 1.65 (0.05)
19 Mefexamide·HCl 0.25 (0.01) 0.29 (0.02) 0.78 (0.03) 1.06 (0.05)
20 Metoprolol·(1/2tartrate) −0.30 (0.03) −0.20 (0.01) 0.11 (0.01) 0.39 (0.04)
21 Minaprine·2HCl 0.05 (0.01) 0.38 (0.02) 1.99 (0.09) 2.01 (0.08)
22 Piroxicam −0.24 (0.02) −0.21 (0.01) −0.73 (0.05) −0.79 (0.03)
23 Propranolol·HCl 0.84 (0.04) 0.83 (0.04) 1.35 (0.06) 1.56 (0.08)
24 Sulfamethizole −1.15 (0.05) −1.16 (0.07) −2.17 (0.09) −2.33 (0.09)
25 Terbutaline·(1/2SO4) −1.29 (0.06) −1.20 (0.05) −1.24 (0.06) −0.92 (0.05)
26 Terfenadine 3.90 (0.09) >4.9 4.6 (0.3) >4.9
27 Theophylline 0.13 (0.01) 0.11 (0.007) 0.15 (0.008) 0.02 (0.005)
28 Thioridazine·HCl 2.56 (0.07) 2.49 (0.09) 3.40 (0.08) 4.33 (0.09)
29 Verapamil·HCl 1.79 (0.08) 1.67 (0.06) 2.76 (0.08) 3.04 (0.09)


For all other compounds studied here, noticeable differences between their log[thin space (1/6-em)]D values in different octanol–buffer systems were observed. For example, for chlorpromazine HCl (#7), the log[thin space (1/6-em)]D value increased from ca. 2.0 in octanol–0.01 M NaPB to ca. 3.3 in octanol–0.10 M NaPB. Similarly, for verapamil HCl (#29), the log[thin space (1/6-em)]D value changed from ca. 1.7 in octanol–0.01 M NaPB to ca. 2.8 in octanol–0.10 M NaPB, i.e. by an order of magnitude in terms of the distribution coefficient, D.

The presence or inorganic salts in the aqueous phase of the octanol–buffer system may affect the water content in the octanol phase.16 This effect is generally displayed at salt concentrations of 0.5 M and higher. In all the systems used here, the ratios of the organic phase volume to that of the aqueous phase were unaffected by the ionic composition of the aqueous phase, and it was assumed that the water content of the octanol phase was similar in all the systems examined.

To analyze the general trends in the changes of distribution coefficients with the change in the buffer composition, the data listed in Tables 1 and 2 was examined using the so-called Collander linear solvent regression relationship:8,17–21

 
log[thin space (1/6-em)]Dji = aio[thin space (1/6-em)]log[thin space (1/6-em)]Djo + bio (1)
where Dji and Djo are distribution coefficients for any given jth solute in the ith and oth solvent–water systems; aio and bio are constants, the values of which depend upon the particular composition of the ith and oth systems under comparison.

The Collander equation8,17–21 typically describes a linear correlation between the distribution coefficients of the solutes of a similar chemical nature in different organic solvent–water biphasic systems. The coefficients of the relationship (slope and intercept) depend on the particular systems under comparison as well as on the type of the solutes being examined. It was suggested8 that these coefficients represent the distinctive features of the interactions of the solute functional moieties with the solvents being compared.

Wang and Lien11 were the first to our knowledge to show that the effects of different buffers on distribution of drugs in octanol–buffer systems could be analyzed using the Collander relationship. It was shown later that the Collander relationship may be used to compare the partition coefficients for different organic compounds22 and even proteins23 in aqueous PEG–Na2SO4 two-phase systems with different salt additives.

Although the Collander relationship was described as an empirical observation, it is possible to explain the physical meaning of the coefficients based on a simple model.8 For this purpose, we may consider the general partition behavior of a homologous series of compounds, such as aliphatic alcohols, aliphatic acids or amines.8 The distribution of such a series of compounds is generally described by the following linear relationship:

 
log[thin space (1/6-em)]Dj = Cj + ENj(CH2) (2)
where log[thin space (1/6-em)]Dj is the logarithm of a jth compound in the homologous series, Nj(CH2) is the number of methylene groups in the alkyl chain of the jth compound, E is the contribution of a CH2 group into log[thin space (1/6-em)]Dj value, and Cj is the contribution of a polar group into log[thin space (1/6-em)]Dj value for the compounds in the homologous series.

Comparison of the log[thin space (1/6-em)]Dj values for compounds with the same length of alkyl chain in two different octanol–buffer systems shows that the Collander relationship for such compounds may be expressed as:

 
log[thin space (1/6-em)]Dji = CjiCjo(Ei/Eo) + (Ei/Eo)log[thin space (1/6-em)]Djo (3)
where superscripts i and o denote the two octanol–bufferi and octanol–buffero systems under comparison. It follows from eqn (9) and eqn (2) that the slope in the Collander relationship can be expressed as:
 
aio = Ei/Eo (4)
and the intercept as:
 
bio = CiCoEi/Eo = CiCoaio (5)
suggesting that the slope of the Collander relationship is determined by the ratio of the differences between the relative hydrophobic character of the octanol and aqueous phases in the two systems under comparison, while the intercept characterizes the differences between polar interactions of the functional moiety of the compound in the phases of the systems.24,25 This is obviously an oversimplified model of the distribution of organic compounds in octanol–buffer systems but it provides a reasonable approach to interpret the results from this study.

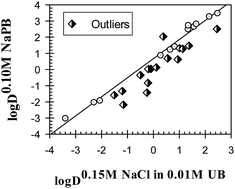
One of the effects of a change in the ionic composition of the aqueous phase may be an alteration of the solvent properties of the phase. The results of an analysis of the Collander linear relationships between the distribution coefficients of drugs in all different octanol–buffer systems examined are presented in Table S1. Two examples are graphically shown in Fig. 1 and 2. The distribution coefficients for the drugs studied in octanol–0.15 M NaCl in 0.10 M NaPB and in octanol–0.10 M NaPB (see data in Tables 1 and 2) are linearly interrelated, as illustrated in Fig. 1. The interrelationship observed may be described as:

 
log[thin space (1/6-em)]D0.15 M NaCl+0.10 M NaPBj = −0.01±0.02 + 1.01±0.01[thin space (1/6-em)]log[thin space (1/6-em)]D0.10 M NaPBj (6)

N = 26; r2 = 0.9989; SD = 0.071; F = 21[thin space (1/6-em)]087
where D0.10 M NaPBj and D0.15 M NaCl+0.10 M NaPBj are the distribution coefficients for the same jth compound in the octanol–0.10 M NaPB and in octanol–0.15 M NaCl in 0.10 M NaPB systems, respectively; N is the number of compounds fitting the relationship; r is the correlation coefficient; SD is the standard deviation; and F is the ratio of the variance. Three compounds (#2, 17 and 20) deviate from the relationship by more than 25% and are considered to behave as outliers.


image file: c5ra01402f-f1.tif
Fig. 1 Distribution coefficients for the compounds in the octanol–0.15 M NaCl in 0.10 M NaPB system plotted versus the distribution coefficients for the same compounds in an octanol–0.10 M NaPB. NaPB – sodium phosphate buffer, pH 7.4.

image file: c5ra01402f-f2.tif
Fig. 2 Distribution coefficients for the compounds in the octanol–0.10 M NaPB system plotted versus the distribution coefficients for the same compounds in octanol–0.15 M NaCl in 0.01 M NaPB. NaPB – sodium phosphate buffer, pH 7.4; UB – universal buffer, pH 7.4.

It should be emphasized that the term outlier is used to denote the compounds with polar interactions in the aqueous phase of one of the octanol–buffer systems different from those in the other octanol buffer systems under comparison. A comparison of the distribution coefficients for the drugs in octanol–buffer systems with significant differences between the ionic compositions of aqueous phases, such as octanol–0.15 M NaCl in 0.01 M UB and octanol–0.10 M NaPB (see data in Table 2) is illustrated in Fig. 2. The Collander relationship observed may be described as

 
log[thin space (1/6-em)]D0.10 M NaPBj = 0.68±0.07 + 1.18±0.04[thin space (1/6-em)]log[thin space (1/6-em)]D0.15 M NaCl+0.01 M UBj (7)

N = 12; r2 = 0.9904; SD = 0.23; F = 1027
where D0.15 M NaCl+0.01 M UBj is the distribution coefficient for the jth compound in the octanol–0.15 M NaCl in 0.01 M UB system, D0.10 M NaPBj; N; r; SD; and F are as defined above. Sixteen compounds (#2, 5, 6, 9, 10, 12, 13, 15, 17, 18, 20, 21, 22, 24, 25, and 27) deviated from the relationship by more than 25% and were considered to behave as outliers, i.e. compounds with polar interactions different from those typical for the compounds fitting the relationship.

Similar interrelationships were observed between the distribution coefficients for the drugs in all combinations of the octanol–buffer systems differing in their ionic composition (see data in Table S1). Note that different compounds behave as outliers in many cases. The number of outliers varied from three to seventeen depending on the ionic composition of the aqueous phase in the particular octanol–buffer systems compared.

The slopes of the linear relationships described by eqn (1) (aio) varied from 1.0 ± 0.02 to 1.44 ± 0.04 depending on the particular octanol–buffer systems compared and the intercept (bio) varied from 0 ± 0.02 to 0.78 ± 0.07 (see in Table S1). If we assume that the properties of the octanol phase are not altered under the changes in the ionic composition of the aqueous phase, the variability of both aio and bio coefficients indicate significant changes in both the hydrophobic character of the aqueous phase and the polar interactions in the phase.

The most important practical conclusion from the data obtained in this study is that to compare the lipophilicities of different compounds it is necessary to measure experimentally the distribution coefficients of the compounds in an octanol–buffer system with a fixed buffer composition. The variability of log[thin space (1/6-em)]P values presented in ref. 1 may be explained by the fact that different authors performed their measurements in systems with different ionic compositions of the aqueous phase and the particular composition was not reported. Therefore, the log[thin space (1/6-em)]P values used as a basis for the current software packages are questionable and experimental measurements should be used to make a reliable estimation of the lipophilicity of chemical compounds.

If the aforementioned assumption that differences in the ionic composition of octanol–buffer systems affect the properties of the aqueous phase only is correct, we may consider different log[thin space (1/6-em)]D values for a given compound as resulting from the different responses of the compound to different ionic environments.

It was reported15 that various properties of organic compounds in the presence of different salt additives are interrelated. To determine if a similar linear relationship holds for the distribution coefficients of drugs in octanol–buffer systems, we analyzed the relationship between the log[thin space (1/6-em)]D values in octanol–0.10 M UB, octanol–0.15 M NaCl in 0.01 M NaPB, and octanol–0.15 M NaCl in 0.10 M UB (see data in Tables 1 and 2). The three systems selected were those with the greatest number of outliers for each possible combination of pairs of systems (see Table S1). The linear relationship between the log[thin space (1/6-em)]D values in the three systems under consideration is shown graphically in Fig. 3, and can be described as

 
log[thin space (1/6-em)]D0.15 M NaCl+0.10 M UBj = 0.11±0.06[thin space (1/6-em)]log[thin space (1/6-em)]D0.15 M NaCl+0.01 M NaPBj + 0.93±0.04[thin space (1/6-em)]log[thin space (1/6-em)]D0.10 M UBj (8)

N = 28; r2 = 0.9944; SD = 0.16; F = 2211
where all the parameters are as defined above.


image file: c5ra01402f-f3.tif
Fig. 3 Interrelationship between the distribution coefficients log[thin space (1/6-em)]D7.4 for the drug compounds studied (Tables 1 and 2) in the octanol–buffer systems indicated (eqn (8)).

It is easy to verify that similar linear relationships hold for the compounds examined in all different combinations of the three various ionic compositions employed. It may be concluded that the linear relationship between the responses of various organic compounds to different ionic environments is fulfilled in octanol–buffer systems as well as in organic solvent-free aqueous solutions. Therefore, it is possible to suggest that these relationships are based on the same physical principles, which should be taken into account in any theoretical model of solute–water interactions in aqueous solutions containing salt additives.

It should be mentioned that essentially all the compounds used are ionized at pH 7.4. The pKa values are presented for each compound in Table 1. It should be emphasized that these values are to be viewed as approximate because they may vary with the salt composition and may be affected by the presence of octanol in the aqueous phase. The observed dependence of the log[thin space (1/6-em)]D values of the ionic composition cannot be explained solely by the formation of ionic pairs as indicated by the different log[thin space (1/6-em)]D values measured for the same compound in the presence of different concentrations of the same buffer. Therefore, it is reasonable to suggest that the responses of each compound to different ionic environments are governed by each particular environment and by the compound structure. The responses to different ionic composition for each compound are represented by the log[thin space (1/6-em)]D values for the compound. The set of log[thin space (1/6-em)]Dji values for the jth compound observed in different ith ionic compositions of aqueous phases in the octanol–buffer systems may be considered a signature of the compound's responsiveness to different ionic environments. To examine what properties of the compound structure are important for the jth compound ionic composition responsiveness it is important to reduce the signature (set of log[thin space (1/6-em)]Dji values) to a single numerical parameter.

It was shown26,27 for proteins that the protein 3D structure in solution may be represented as a vector of the protein partition coefficients in several (four or more) aqueous two-phase systems of the same polymer and different ionic compositions. These vectors can then be used to estimate the differences between the structures of different proteins, but only after a reference sample is chosen. A similar approach may be used for organic compounds. Any compound may be used as a reference, and we selected α-methyldopa (compound #3) as the reference compound. The logarithms of the distribution coefficients for all drugs were normalized to the log[thin space (1/6-em)]Doi for α-methyldopa in each octanol–ith buffer system chosen to characterize the drugs ionic responsiveness (see below). The normalized Euclidian distance between the normalized ionic responsiveness signatures in the multi-dimensional space represented by the log[thin space (1/6-em)]Dji-values in the octanol–buffer systems with different ionic compositions for each compound and α-methyldopa was then evaluated. This distance was calculated as

 
image file: c5ra01402f-t1.tif(9)
where djo is the distance between the ionic responsiveness signature of drug j to that of α-methyldopa, log[thin space (1/6-em)]Dji and log[thin space (1/6-em)]Doi are the logarithms of the distribution coefficients for compound j and the reference compound o (α-methyldopa) in system i, respectively.

The ionic responsiveness distances for all of the compounds were calculated using eqn (9) and (i) log[thin space (1/6-em)]Dji in octanol–buffer systems with sodium phosphate buffer (NaPB); (ii) log[thin space (1/6-em)]Dji in octanol–buffer systems with universal buffer (UB); and (iii) log[thin space (1/6-em)]Dji in all octanol–buffer systems employed. The distances are listed in Table 3. Note that the range of djo values calculated from the log[thin space (1/6-em)]D values in the octanol–buffer systems with NaPB and those with UB are similar, up to 4.73 and up to 4.33, respectively. The range of djo values calculated from the log[thin space (1/6-em)]D values in all octanol–buffer systems employed is significantly larger, up to 6.41. A linear relationship can be observed between the distances determined in the octanol–buffer systems with both types of buffers. The relationship between the d8 dimensionsjo values determined in all octanol–buffer systems used and the d4 dimensions (NaPB)jo values determined in the systems with NaPB are illustrated graphically in Fig. 4, and may be described as:

 
d8 dimensionsjo = 0.31±0.03 + 1.27±0.01d4 dimensions (NaPB)jo (10)

N = 28; r2 = 0.9967; SD = 0.10; F = 7903
where all parameters are as defined above.

Table 3 Distances, djo, between ionic responsiveness of the indicated compounds and α-methyldopa calculated with eqn (9) from the data obtained in various octanol–buffer systems (NaPB – sodium phosphate buffer, pH 7.4; UB – universal buffer, pH 7.4)
# Compound djo (NaPB) djo (UB) djo (all conditions)
1 5-Hydroxytryptophan 0.16 0.51 0.53
2 Acebutolol·HCl 1.97 2.12 2.89
3 α-Methyldopa 0 0 0
4 Amoxicillin 0.97 0.66 1.17
5 Atenolol 1.40 1.65 2.17
6 Carbamazepine 3.37 3.03 4.54
7 Chlorpromazine·HCl 4.57 4.04 6.10
8 Clonidine·HCl 2.91 2.76 4.01
9 Desipramine·HCl 3.08 2.93 4.25
10 Diclofenac·Na 2.53 2.34 3.45
11 Doxepin·HCl 3.85 3.45 5.17
12 Furosemide 0.55 0.82 0.99
13 Harmine 4.35 3.86 5.82
14 Homochlorcyclizine·2HCl 3.81 3.43 5.13
15 Hydrochlorothiazide 1.65 1.62 2.31
16 Imipramine 4.00 3.60 5.38
17 Indomethacin 2.74 2.55 3.74
18 Maprotiline·HCl 3.12 2.96 4.30
19 Mefexamide·HCl 2.54 2.53 3.58
20 Metoprolol·(1/2tartrate) 1.90 2.06 2.80
21 Minaprine·2HCl 3.06 2.85 4.18
22 Piroxicam 1.52 1.61 2.22
23 Propranolol·HCl 3.02 2.87 4.17
24 Sulfamethizole 0.70 0.77 1.04
25 Terbutaline·(1/2SO4) 0.81 1.24 1.48
26 Terfenadine n/a n/a n/a
27 Theophylline 2.11 2.05 2.95
28 Thioridazine·HCl 4.73 4.33 6.41
29 Verapamil·HCl 4.15 3.72 5.57


image file: c5ra01402f-f4.tif
Fig. 4 Ionic responsiveness distances, d8 dimensionsjo, for all compounds (calculated with eqn (9) and compound #3 as a reference from the log[thin space (1/6-em)]Dji values in all octanol–buffer systems employed) plotted versus the ionic responsiveness distances, d4 dimensionsjo, for all compounds (calculated with eqn (9) and compound #3 as a reference from the log[thin space (1/6-em)]Dji values in octanol–buffer systems with NaPB). NaPB – sodium phosphate buffer, pH 7.4.

The distances calculated with the data obtained in all of the octanol–buffer systems are an obvious choice in view of the extended range of djo values. This data is listed in Table 4 together with several various structural features of the compounds calculated using ChemAxon software at http://www.chemspider.com.

Table 4 Distances, djo, between the ionic responsiveness of the indicated drugs and the α-methyldopa and structural properties of drugs indicated calculated with ChemAxon software at http://www.chemspider.com
# Compound d8 dimensionsjo PSAa, A2 SASAa, A2 Molecular polarizability
a PSA – Polar Surface Area; SASA – Solvent Accessible Surface Area.
1 5-Hydroxytryptophan 0.53 99.34 297.59 23.69
2 Acebutolol·HCl 2.89 87.66 651.14 36.50
3 α-Methyldopa 0 103.78 303.29 20.99
4 Amoxicillin 1.17 132.96 472.99 35.52
5 Atenolol 2.17 84.58 440.41 29.09
6 Carbamazepine 4.54 46.33 312.24 26.95
7 Chlorpromazine·HCl 6.10 6.48 456.76 35.97
8 Clonidine·HCl 4.01 36.42 273.87 21.94
9 Desipramine·HCl 4.25 15.27 443.34 32.82
10 Diclofenac·Na 3.45 52.16 359.64 28.92
11 Doxepin·HCl 5.17 12.47 443.41 34.18
12 Furosemide 0.99 122.63 397.83 29.50
13 Harmine 5.82 37.91 311.33 26.53
14 Homochlorcyclizine·2HCl 5.13 6.48 444.43 33.39
15 Hydrochlorothiazide 2.31 118.36 338.61 25.35
16 Imipramine 5.38 6.48 478.35 34.67
17 Indomethacin 3.74 68.53 476.27 37.34
18 Maprotiline·HCl 4.30 12.03 455.16 34.66
19 Mefexamide·HCl 3.58 50.80 488.46 30.99
20 Metoprolol·(1/2tartrate) 2.80 50.72 474.87 30.34
21 Minaprine·2HCl 4.18 50.28 476.25 34.96
22 Piroxicam 2.22 99.60 411.40 32.63
23 Propranolol·HCl 4.17 41.49 426.96 31.77
24 Sulfamethizole 1.04 97.97 336.84 25.13
25 Terbutaline·(1/2SO4) 1.48 72.72 375.66 24.73
26 Terfenadine n/a 43.70 796.52 57.33
27 Theophylline 2.95 69.30 235.19 16.13
28 Thioridazine·HCl 6.41 6.48 556.55 43.83
29 Verapamil·HCl 5.57 63.95 781.45 51.54


An analysis of the admittedly limited variety of structural descriptors listed in Table 4 shows that there is a linear regression illustrated graphically in Fig. 5 and described as

 
d8 dimensionsjo = 1.9±0.47 − 0.034±0.003PSAj + 0.11±0.02αj. (11)

N = 24; r2 = 0.9169; SD = 0.53; F = 116
where PSAj and αj are the polar surface area and the molecular polarizability for the jth compound; all the other parameters as defined above; the distances for four compounds (#1, 13, 15, 27) out of 28 do not fit the relationship and were not used.


image file: c5ra01402f-f5.tif
Fig. 5 Ionic responsiveness distances, d8 dimensionsjo, for compounds (calculated with eqn (9) and compound #3 as a reference from the log[thin space (1/6-em)]Dji values in all octanol–buffer systems employed) plotted versus polar surface area, PSAj, and molecular polarizability, αj, of the compounds (both parameters calculated with ChemAxon software at http://www.chemspider.com). Compounds #1, 13, 15, 27 do not fit the relationship.

This follows from the above relationship that a polar surface area and molecular polarizability are the most important structural characteristics with regard to the responsiveness to an ionic environment for most of the compounds examined. These characteristics, however, do not cover all the important structural features as the eleven “outliers” clearly imply. It should be mentioned that the same structural features for a different set of polar organic compounds were found to be most important for their susceptibility to the salting-out and salting-in effects of different inorganic salts.15

The most important practical conclusion follows from the experimental fact established here that the distribution of 24 out of 28 randomly selected drugs in octanol–buffer change noticeably with rather small changes in the ionic composition of the aqueous phase. That explains why the log[thin space (1/6-em)]D values listed for certain compounds at the same pH in ref. 1 vary so much, and shows that the log[thin space (1/6-em)]D values for different compounds used in QSAR analysis should be measured under the same standardized conditions. The data obtained in this study suggests that the ionic environment influences the compound lipophilicity (measured in terms of the log[thin space (1/6-em)]D values) in a compound structure specific manner. This means that the relative affinity of a compound to the biological membranes and possibly its transport across the membranes in vivo may depend on the ionic composition of the aqueous media inside and outside of the membrane. Similarly, the drug–receptor interactions, especially those affected significantly by drug lipophilicity, should be studied in vitro under ionic composition conditions close to those existing in the receptor environment in vivo.

4. Conclusions

The ionic composition of octanol–buffer system may have a significant effect on the distribution of an organic compound in the system. The log[thin space (1/6-em)]P values calculated with standard commercial software packages are questionable if the data on the basis of which the software operates is not checked with regard to which specific ionic composition of octanol–water system was used. The responses of the organic compounds to the ionic environment in octanol–buffer systems follow the relationships established previously in organic solvent-free aqueous solutions. These relationships should be considered in any theoretical model of solute–water interactions in aqueous solutions with salt additives.

Notes

The authors declare no competing financial interest.

References

  1. C. Hansch and A. Leo, Exploring QSAR. Hydrophobic, Electronic, and Steric constants, American Chemical Society, Washington, DC, 1995 Search PubMed.
  2. V. Pliska, B. Testa and H. van de Waterbeemd, Lipophilicity in Drug Action and Toxicology, VCH Weinheim, Weinheim, 1996 Search PubMed.
  3. J. Devillers, Comparative QSAR, Taylor and Francis, Washington, DC, 1998 Search PubMed.
  4. J. Sangster, Octanol–Water Partition Coefficients: Fundamentals and Physical Chemistry, John Wiley and Sons, New York, 1997 Search PubMed.
  5. M. Kah and C. D. Brown, Chemosphere, 2008, 72, 1401 CrossRef CAS PubMed.
  6. L. Xing and R. C. Glen, J. Chem. Inf. Comput. Sci., 2002, 42, 796 CrossRef CAS PubMed.
  7. S. G. Machatha and S. H. Yalkowsky, Int. J. Pharm., 2005, 294, 185 CrossRef CAS PubMed.
  8. B. Y. Zaslavsky and L. M. Mikheeva, J. Chromatogr., 1981, 216, 103 CrossRef.
  9. A. A. Masimov, B. Y. Zaslavsky, A. A. Gasanov and S. V. Rogozhin, J. Chromatogr., 1984, 284, 337 CrossRef CAS.
  10. A. A. Masimov, B. Y. Zaslavsky, A. A. Gasanov, Yu. A. Davidovich and S. V. Rogozhin, J. Chromatogr., 1984, 284, 349 CrossRef CAS.
  11. P.-H. Wang and E. J. Lien, J. Pharm. Sci., 1980, 69, 662 CrossRef CAS.
  12. C. J. Mbah, Pharmazie, 2005, 60, 345 CAS.
  13. N. K. Pandit, J. M. Strykowski and L. Shtohryn, Int. J. Pharm., 1989, 50, 7 CrossRef CAS.
  14. S. Wille, M. Buggert, L. Mokrushina, W. Arit and I. Smirnova, Chem. Eng. Technol., 2010, 33, 1075 CrossRef CAS.
  15. L. A. Ferreira, A. Chervenak, S. Placko, A. Kestranek, P. P. Madeira and B. Y. Zaslavsky, Phys. Chem. Chem. Phys., 2014, 16, 23347 RSC.
  16. A. Moubigh, M. Abderrabba and E. Provost, J. Iran. Chem. Soc., 2009, 6, 168 CrossRef.
  17. R. Collander, Acta Physiol. Scand., 1947, 13, 363 CrossRef CAS PubMed.
  18. A. Leo and C. Hansch, J. Org. Chem., 1971, 36, 1539 CrossRef CAS.
  19. A. Leo, C. Hansch and D. Elkins, Chem. Rev., 1971, 71, 525 CrossRef CAS.
  20. C. Hansch and W. J. Dunn, J. Pharm. Sci., 1972, 61, 1 CrossRef CAS.
  21. C. Hansch and A. Leo, Exploring QSAR: Fundamentals and Applications in Chemistry and Biology; American Chemical Society, Washington, DC, 1995, pp. 100–103 Search PubMed.
  22. L. A. Ferreira, P. Parpot, J. A. Teixeira, L. M. Mikheeva and B. Y. Zaslavsky, J. Chromatogr. A, 2012, 1220, 14 CrossRef CAS PubMed.
  23. L. Ferreira, P. P. Madeira, L. Mikheeva, V. N. Uversky and B. Zaslavsky, Biochim. Biophys. Acta, Proteins Proteomics, 2013, 1834, 2859 CrossRef CAS PubMed.
  24. R. F. Rekker, The Hydrophobic Fragmental Constant: Its Derivation and Application. A Means of Characterizing Membrane Systems, Elsevier, Amsterdam, 1977 Search PubMed.
  25. B. Zaslavsky, Aqueous Two-Phase Partitioning: Physical Chemistry and Bioanalytical Applications; Marcel Dekker, New York, 1994, pp. 268–271 Search PubMed.
  26. A. Zaslavsky, P. Madeira, L. Breydo, V. N. Uversky, A. Chait and B. Zaslavsky, Biochim. Biophys. Acta, 2013, 1834, 583 CrossRef CAS PubMed.
  27. L. Ferreira, X. Fan, L. M. Mikheeva, P. P. Madeira, L. Kurgan, V. N. Uversky and B. Y. Zaslavsky, Biochim. Biophys. Acta, 2014, 1844, 694 CrossRef CAS PubMed.

Footnotes

Electronic supplementary information (ESI) available: Table S1: coefficients aio and bio (eqn (1)) of the analysis of the Collander linear relationships between the distribution coefficients of drugs in all different octanol–buffer systems examined (NaPB – sodium phosphate buffer, pH 7.4; UB – universal buffer, pH 7.4, r is the regression coefficient, SD is the standard deviation and N is the number the number of compounds fitting the relationship). See DOI: 10.1039/c5ra01402f
The manuscript was written through the contributions of all authors. All authors have given approval to the final version of the manuscript.

This journal is © The Royal Society of Chemistry 2015