Insight into the structural and functional features of myoglobin from Hystrix cristata L. and Rangifer tarandus L.

Antonella M. A. Di Giuseppea, Jolanda V. Casoa, Valeria Severinob, Sara Raguccia, Angela Chamberya, Rosita Russoa, Roberto Fattorussoa, José M. Ferrerasc, Luigi Russoa and Antimo Di Maro*a
aDepartment of Environmental, Biological and Pharmaceutical Sciences and Technologies (DiSTABiF), Second University of Naples, Via Vivaldi 43, 81100-Caserta, Italy. E-mail: antimo.dimaro@unina2.it; Fax: +39 0823 274571; Tel: +39 0823 274535
bDepartment of Internal Medicine Specialties, Geneva University, Rue Michel-Servet 1, 1211-Genève, Switzerland
cDepartment of Biochemistry and Molecular Biology and Physiology, University of Valladolid, Campus Miguel Delibes, Paseo de Belén 17, 47011-Valladolid, Spain

Received 22nd January 2015 , Accepted 6th March 2015

First published on 6th March 2015


Abstract

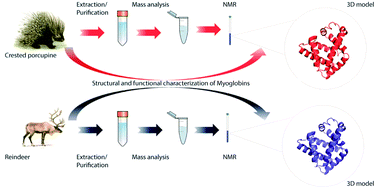
The amino acid sequence, structural and functional features of two novel myoglobins (Mbs) isolated from a crested porcupine (Hystrix cristata L.) and reindeer (Rangifer tarandus L.) were determined. The primary structure was achieved by using a combined approach based on de novo sequencing by ESI-Q-TOF MS/MS and peptide mapping by MALDI-TOF MS. This strategy allowed us to determine the primary structure of crested porcupine and reindeer Mbs. To go deeper, 3D modeling studies followed by structural characterization by NMR on both myoglobins demonstrate that reindeer Mb shows slightly different orientation of F, G and H α-helices. As a consequence, reindeer Mb may differently modulate the heme environment, facilitating oxygenation as well as ensuring that the heme iron remains in a ferrous state. Finally, reindeer Mb shows a less stable conformation with respect to crested porcupine Mb (Tm 353.7 K vs. Tm 356.3 K, respectively).

1. Introduction

The oxygen requirement by tissues demands the evolution of macromolecules necessary for its transport and/or storage.1 This necessity is particularly enhanced in vertebrate muscles since the high oxygen demand cannot be only satisfied by a continuous passive or active transport. A particularly specialized family of proteins, the globins,2 has been evolved to reversibly bind to molecular oxygen, due to the presence of the heme group. During the evolution of the circulatory system, the globins family has given rise to tetrameric proteins, as hemoglobin, that carry oxygen,3 and monomeric proteins, as myoglobin, that are necessary in the storage and cellular diffusion of oxygen.4

Myoglobin (Mb) is expressed in cardiac myocytes and oxidative skeletal muscle fibers5 and consists of eight alpha helices connected by various loops.6 Mb binds oxygen by its heme residue, a porphyrin ring–iron ion complex. The polypeptide chain (∼150 amino acids) is folded and cradles the heme prosthetic group, positioning it between two histidinyl residues, His64 and His93. The iron ion interacts with six ligands, four of which are provided by the nitrogen atoms of the four pyrroles. The imidazole side chain of His93 provides the fifth ligand, stabilizing the heme group and slightly displacing the iron ion away from the plane of the heme. The sixth ligand position, unoccupied in deoxymyoglobin, serves as binding site for O2, as well as for other potential ligands such as CO or NO.

Mb has been studied for long time because of: (i) its role in several human diseases;7,8 (ii) understanding structure–function relationships in proteins;9 and (iii) its scavenging activity against reactive oxygen species and bioactive nitric oxide.10 Furthermore, myoglobin is extensively studied in food and quality control fields considering its role in determining the meat colour and consequently its attractiveness for the consumers.11 Indeed, Mbs of skeletal and cardiac muscle can assume three forms: oxymyoglobin (OxyMb), deoxymyoglobin (deoxyMb) and metmyoglobin (metMb), whose relative amounts determine the colour of fresh meat. In vivo the metMb is in low amount due to the presence of a specific reducing system. The amount of metMb increases in the absence of metabolic energy when this system does not work.12 Moreover, Mbs isolated from several species have been studied by our research group because of their potential use as molecular markers for the detection of fraudulent addition of undeclared species in raw meat.13,14

In this framework, the characterization of Mbs isolated from species whose meats is used in human diet is challenging, especially if integrated with studies on their structural features. In fact, these proteins result attractive in phylogenetic studies, since few residue substitutions can alter their structural and functional properties.15,16

In this work, primary structures of two novel myoglobins isolated from crested porcupine (Hystrix cristata L.) and reindeer (Rangifer tarandus L.) were determined by using a combined approach based on LC-ESI MS/MS and MALDI-TOF MS. At first, in order to fully describe the structural characteristics, 3D modeling analysis was performed for both Mbs. Next, the 3D models were validated using experimental data obtained by Nuclear Magnetic Resonance (NMR) spectroscopy. Our data showed that the two myoglobins adopt a similar compact structure with small but significant structural differences. In particular, due to a displacement of helices F, G and H, reindeer Mb is characterised by a slightly less compact fold with respect to crested porcupine. Moreover, to characterize the functional properties of both Mbs a series of autoxidation kinetics and thermal stability measurements were performed. The higher autoxidation rate of reindeer Mb with respect to that of crested porcupine one could be explained by its less stable conformation as confirmed by 3D models analysis. Our results suggest that the highlighted structural differences between reindeer and crested porcupine myoglobins might play an important role, facilitating oxygenation, in the modulation process of the heme environment.

2. Experimental

2.1. Meat species

Crested porcupine (thigh muscles) meat was collected from local hunters and kept at −20 °C until use. Reindeer (thigh muscles) meat was purchased from a London (UK) food store and kept at −20 °C until use.

2.2. Enzymes and chemicals

Cyanogen bromide and endoproteinases (trypsin, chymotrypsin, Asp-N and Glu-C) were purchased from Sigma-Aldrich (Milan, Italy). Solvents for RP-HPLC were supplied by Carlo Erba (Milan, Italy). Bicinchoninic acid (BCA) kit was purchased from Pierce (Rockford, IL, USA). Materials for chromatography were described elsewhere.17,18 The following solvents were used for RP-HPLC: solvent A, 0.1% TFA in water; solvent B, acetonitrile containing 0.1% TFA. All other reagents and chemicals were of analytical grade.

2.3. Extraction and purification procedure

Mbs were isolated from crested porcupine and reindeer muscles as previously described.19,20 Briefly, following partial removal of the fat and connective tissues, meat samples (about 50 g) were homogenized in 10 mM Tris·HCl buffer, pH 8.8 (1[thin space (1/6-em)]:[thin space (1/6-em)]2; w[thin space (1/6-em)]:[thin space (1/6-em)]v) using a Waring blender (Waring Products, Torrington, CT, USA), at 4 °C. The homogenate was centrifuged, filtered through Miracloth paper (Calbiochem, San Diego, CA, USA) and dialysed in the same buffer. Mbs were then gel-filtered on Sephacryl S-100 HR (GE Healthcare, Milan, Italy), and subjected to anion exchange chromatography on Source™ 15Q FPLC column (GE Healthcare), using the AKTA prime 100 FPLC (GE Healthcare). During purification procedure the absorbance was measured at 280 and 409 nm to monitoring heme-proteins, and the protein homogeneity was checked by SDS-PAGE.21

2.4. Preparation of apomyoglobin

The separation of apo-Mb from the heme group was performed by reversed-phase HPLC (RP-HPLC) on a C-4 column (4.6 × 150 mm, Alltech, Sedriano, Milan, Italy) as previously reported.20

2.5. Analytical procedures and peptides separation

Chemical fragmentation with cyanogen bromide (CNBr) was performed in 70% formic acid.22 Digestions with trypsin and chymotrypsin were performed as previously reported.23,24 Digestion with endoproteinase Glu-C was performed by two additions of the enzyme with a final enzyme-to-substrate ratio of 1[thin space (1/6-em)]:[thin space (1/6-em)]50 (w[thin space (1/6-em)]:[thin space (1/6-em)]w). Following incubation (37 °C for 24 h), digested samples were centrifuged at 15[thin space (1/6-em)]800g for 10 min (GS-15R centrifuge; Beckman Coulter, Milan, Italy).

When needed, separation of endoproteinase and CNBr peptides by RP-HPLC was performed on a Breeze instrument (Waters SpA, Vimodrone, Milan, Italy), equipped with a symmetry C-18 column (0.46 × 150 mm; 5 μm particle size; Waters SpA) or C-4 column (0.46 × 250 mm; 5 μm particle size; Phenomenex, Castel Maggiore, BO, Italy), respectively, as previously reported.17,25

2.6. Mass spectrometry analysis

The relative molecular masses (Mr) of whole myoglobins were determined by mass spectrometry using a quadrupole time of flight (Q-TOF) mass spectrometer (Q-TOF Micro, Waters, Manchester, UK) equipped with an electrospray ionisation (ESI) source. The capillary source voltage and the cone voltage were set at 3000 and 43 V, respectively. The source temperature was kept at 80 °C and nitrogen was used as drying gas (flow rate about 50 L h−1). Samples from RP-HPLC were diluted to a concentration of 10 pmol L−1 with acetonitrile containing 0.1% formic acid in water (50[thin space (1/6-em)]:[thin space (1/6-em)]50, v/v) and infused into the system at a flow rate of 20 L min−1. Peptides were separated by means of a modular CapLC system (Waters) directly connected with the ESI source. Samples were loaded onto a C-18 precolumn (5 mm length × 300 μm ID) at a flow rate of 20 μL min−1 and desalted for 5 min with solution of 0.1% formic acid. Peptides were then directed onto a symmetry C-18 analytical column (10 cm × 300 μm ID) using 5% CH3CN, containing 0.1% formic acid at a flow rate of 5 μL min−1. Elution was obtained by increasing the CH3CN/0.1% formic acid concentration from 5% to 55% over 60 min. The precursor ion and the associated fragment ions present in the mass spectra of the tryptic peptides were measured with the mass spectrometer directly coupled to the chromatographic system. The time-of-flight analyser of the mass spectrometer was externally calibrated with a multi-point calibration using selected fragment ions of the collision induced dissociation (CID) of human [Glu1]-fibrinopeptide B [500 fmol μL−1 in CH3CN[thin space (1/6-em)]:[thin space (1/6-em)]H2O (50[thin space (1/6-em)]:[thin space (1/6-em)]50), 0.1% formic acid] at an infusion rate of 5 μL min−1 in the TOF MS/MS mode. Electrospray mass spectra and tandem MS/MS data were acquired on the Q-TOF mass spectrometer operating in the positive ion mode.

For MALDI-TOF analysis, 1 μL of digestion mixtures or each peptide solution was mixed with 1 μL of saturated α-cyano-4-hydroxycinnamic acid matrix solution [10 mg mL−1 in acetonitrile[thin space (1/6-em)]:[thin space (1/6-em)]0.1% TFA (1[thin space (1/6-em)]:[thin space (1/6-em)]1; v/v)] or sinapinic acid [10 mg mL−1 in acetonitrile/0.1% TFA (2[thin space (1/6-em)]:[thin space (1/6-em)]3; v/v)].26 Thus, a droplet of the resulting mixture (1 μL) was placed on the mass spectrometer's sample target and dried at room temperature. Once the liquid was completely evaporated, samples were loaded into the mass spectrometer and analysed. The instrument was externally calibrated using a tryptic alcohol dehydrogenase digest (Waters) in reflectron mode. For linear mode, a four-point external calibration was applied using an appropriate mixture (10 pmol mL−1) of insulin, cytochrome C, horse Mb and trypsinogen as standard proteins (Sigma). A mass accuracy near to the nominal (50 and 300 ppm in reflectron and linear modes, respectively), was achieved for each standard.

All spectra were processed and analysed using MassLynx 4.0 software.

2.7. Autoxidation rate measurement

The autoxidation of OxyMb to metMb was monitored by recording the changes of the absorption spectrum in the 500–700 nm range and estimating the absorbance decrease at 582 nm and 581 nm (the OxyMb α-peak) for crested porcupine and reindeer Mbs, respectively,20 using Synergy HT Multi-Mode Microplate Reader (BioTek, Bad Friedrichshall, Germany). All experiments were performed in triplicate with freshly prepared OxyMb. For the characterisation of the autoxidation process, spectra were collected every 10 min for 5.5 h. Ferrous and ferric Mb derivatives were prepared as previously described.27

2.8. 3D structure modeling method

The 3D models for both Mbs were predicted by the I-TASSER software on the basis of their amino acid sequences. I-TASSER (Interactive Threading ASSEmbly Refinement) is a computational method that uses a combinatorial approach, employing all three conventional methods for structure modeling: comparative modeling, threading, and ab initio modeling.28 The obtained models were evaluated and visualized using the softwares PROCHECK,29 MolProbity,30 PyMol,31 MOLMOL32 and Chimera.33 The estimation of the secondary structure using the predicted models was performed using the software DSSP.34 The cavity volumes were estimated by CASTp35 and Kfinder36 software.

2.9. NMR spectroscopy

All NMR experiments were carried out at 500 MHz using a Varian Unity 500 spectrometer located at the DiSTABiF in Caserta (Italy). NMR samples typically contained 0.5 mM of crested porcupine or reindeer Mbs, 20 mM phosphate buffer (pH 6.8), 0.2 M NaCl and 90% H2O/10% 2H2O. NMR experiments for collecting structural information were performed at 298 K referenced to external TMS (δ = 0 ppm). Deuterium oxide (2H2O) was purchased from Cambridge Isotope Laboratories (Andover, MA, USA). Mono (1D) and two dimensional (2D) spectra were accumulated with a spectral width of 7000 Hz. 2D experiments TOCSY37 and NOESY38 were recorded using the States–Haberkorn method. Water suppression was achieved by DPFGSE sequence.39 TOCSY and NOESY were acquired with mixing times of 70 and 100 ms, respectively. Typically, 64 transients of 1K data points were collected for each of the 256 increments; the data were zero filled to 2K in ω1. Squared shifted sine-bell functions were applied in both dimensions prior to Fourier transformation and baseline correction. Data were processed and analyzed using NMRPIPE40 and CARA software.41 The hydrodynamic proprieties were estimated using the translational diffusion coefficient (Dt) measured by Pulsed-field gradient spin–echo DOSY experiments.39 The Rh was estimated from the Stokes–Einstein equation: (kBT)/6πηDt, where kB is the Boltzmann constant, T is the temperature in Kelvin and η is the viscosity of the solution in Pa s. The rotational correlation time (τc) was estimated, considering a spherical globular protein, through the hydrodynamic radius (Rh) from the Stokes–Einstein equation: τc ∼ (4ηπRh3)/3kBT. The hydrodynamic proprieties (Dt, Rh) were also evaluated from the predicted 3D models using the software HYDROPRO.42–44

2.10. CD spectroscopy

Crested porcupine and reindeer Mb samples were prepared in 4 mL of 20 mM phosphate buffer containing 0.2 M NaCl at pH 6.8. The thermal denaturation of the two proteins was evaluated using a JASCO-815 CD spectropolarimeter equipped with Peltier temperature control. CD spectra were measured at 5 K intervals in the 278–368 K range (additional point at 371 K). After the final measurement at 371 K, the samples were cooled to 298 K, and final spectra were acquired. The data were collected using a quartz cuvette with a 1 cm path-length in the 200–260 nm wavelength range with a data pitch of 1 nm. All data were recorded with a bandwidth of 1 nm with a scanning speed of 50 nm min−1 and normalized against reference spectra to remove the background contribution of buffer. The data obtained were fitted into two-state folding model. The fraction of unfolded protein at each temperature was calculated from the observed ellipticity (θobs) and the ellipticity of the folded (θF) and the unfolded (θU) species using the following equation:
Keq = (θFθobs)/(θobsθU)

Next the standard Gibbs energy (ΔuG°) for unfolding of myoglobin at each temperature was calculated using: |ΔuG° = RT[thin space (1/6-em)]ln[thin space (1/6-em)]Keq| where R is the ideal gas constant and T is the specific temperature. Then from the plot of ln[thin space (1/6-em)]Keq versus 1/T the van't Hoff equation was employed to obtain ΔuH°. The estimation of the secondary structure content was performed using the K2D3 server.45

2.11. Bioinformatic tools and homology studies

All the used amino acid sequences of myoglobins were retrieved and analysed using the BLAST software (http://blast.ncbi.nlm.nih.gov/Blast.cgi) and the NCBI taxonomy browser (http://www.ncbi.nlm.nih.gov/taxonomy/). Alignments were performed by ClustalW at EMBnet-CH (http://www.ch.embnet.org/software/ClustalW.html) and with MEGA46 software. The similarity–identity matrix was obtained using the BOXSHADE program (http://mobyle.pasteur.fr/cgi-bin/MobylePortal/portal.py?form=boxshade). The standard one-letter code was used for the amino acid residues.

Homo sapiens L. (human, AC: P02144); Sus scrofa L. (pig, AC: P02189), Physeter microcephalus L. (physeter catodon, AC: P02185), Equus caballus L. (horse, AC: P68082); Caretta caretta L. (loggerhead sea turtle, AC: P56208), Thunnus albacares L. (yellowfin tuna, AC: P02205) myoglobin sequences have been used.

3. Results and discussion

3.1. Myoglobin isolation

Mbs were purified from Hystrix cristata L. and Rangifer tarandus L. as described in the Experimental section. Total proteins were extracted from meat homogenates in Tris·HCl buffer. Soluble proteins were fractionated by gel-filtration and anion exchange chromatography according to a previously published procedure.19,20 Homogeneity of both purified Mbs was confirmed by the presence of single peaks eluted from analytical FPLC and by SDS-PAGE analysis (Fig. 1A and B). Primary structural studies were carried out on the apo-Mbs, isolated by RP-HPLC as reported in the Experimental section.
image file: c5ra01316j-f1.tif
Fig. 1 FPLC elution profiles of crested porcupine (A) and reindeer Mbs (B) on an AKTA Purifier System from anion exchange chromatography using a Source 15Q PE 4.6/100 column. Experimental conditions are described in the text. In the insets are reported SDS-PAGE analyses of the same purified Mbs (lanes 1 and 2, 1.5 and 3 μg, respectively; M, protein markers).

3.2. Determination of the primary structure of crested porcupine Mb

The amino acid sequence of crested porcupine Mb was obtained by a general strategy based on the combined use of tandem mass spectrometry (ESI-MS/MS) and peptide mapping by MALDI-TOF MS.20 In particular, the following experimental steps were carried out: (i) determination of accurate relative molecular masses (Mr) by ESI/Q-TOF MS of apo-Mbs; (ii) enzymatic cleavage with trypsin followed by ESI-MS/MS analysis of the resulting tryptic peptides; (iii) alignment of the sequenced peptides with the homologous reference proteins and, (iv) sequence completion by MALDI-TOF MS mapping of peptides from chymotrypsin, endoproteinase Glu-C hydrolysis or chemical fragmentation (CNBr).

The first step was to determine the Mr of crested porcupine Mb by ESI/Q-TOF mass spectrometry (Mr 16867.25 ± 0.02; Fig. 2A). In the second step, apo-myoglobin was subjected to tryptic cleavage, and the resulting tryptic peptides were analyzed by tandem mass spectrometry. The tryptic mixture was analyzed by LC ESI-Q-TOF tandem MS, recording automatically the MS/MS spectra on the three most intense mass peaks generated in each scan. The MS/MS data were first processed automatically by using the Biolynx application of MassLynx 4.0 software and then all MS/MS spectra leading to protein identification were manually double checked to verify sequence assignments. Amino acid sequences of crested porcupine Mb peptides obtained by tandem mass spectrometry are reported in Table 1. The de novo sequencing was supported by comparative homology analyses with the Ctenodactylus gundi Mb (gundi; AC: P20856), on the basis of the high sequence identity with crested porcupine Mb. Considering the gundi Mb sequence as reference protein, a coverage of about 61% was obtained from de novo sequencing analysis. Since the amino acid residues at positions 32–62, 78–79, 97–102 and 134–153 were not determined, we decided to map the entire sequence by analysing a new set of peptides obtained from chymotrypsin and endoproteinase Glu-C hydrolysis or chemical fragmentation with CNBr (Table S1 and Fig. 3A). The crested porcupine Mb sequence accounts for a calculated molecular mass of 16867.36 Da, which is in good agreement with the value obtained ESI/Q-TOF MS on the apo-myoglobin (16867.25 ± 0.02 Da). Finally, the amino acid sequences of crested porcupine and gundi Mbs were compared each other (Fig. 3A). The primary structure of both Mbs have 83.7% identity (88.2% similarity). In particular, with respect to gundi Mb, we found nine amino acid substitutions (A13V, T19G, S51A, K56R, N74G, E83A, E116Q, G121A and A127T), whereas proximal (position 93, α-helix F) and distal histidinyl residues (position 64, α-helix E7) are conserved.


image file: c5ra01316j-f2.tif
Fig. 2 Deconvoluted ESI/Q-TOF mass spectra of HPLC-purified apo-Mbs from crested porcupine (A) and reindeer (B).
Table 1 Amino acid sequences of tryptic peptides from crested porcupine myoglobin, obtained by tandem mass spectrometry. Sequence position, experimental masses of precursor ions, charge state and molecular weight of tandem MS/MS sequence deduced from y series, together with mass accuracy, are reported
  Tryptic peptide Sequence position Precursor ion (Da) Charge state MW from de novo sequence Δ (Da)
T-1 GLSDGEWQLVLNVWGK 1–16 1799.92 2 1799.86 −0.06
T-2 VEGDLGGHGQEVLIR 17–31 1577.82 2 1577.79 −0.03
T-3 KHGTTVLTALGGILK 63–77 1507.91 2 1507.88 −0.03
T-4 GQHAAELAPLAQSHATK 80–96 1728.89 2 1728.85 −0.04
T-5 YLEFISEAIIQVLQSK 103–118 1880.03 2 1879.91 −0.12
T-6 HPADFGADTQGAMSK 119–133 1531.67 2 1531.59 −0.08


image file: c5ra01316j-f3.tif
Fig. 3 Amino acid sequences of crested porcupine Mb compared with the gundi one (A) and of reindeer Mb compared with the red deer one (B). The overlapping peptides used for assembling protein sequences are reported. Residues differing among Mbs are in bold. Proximal (position 93, α-helix F) and distal histidinyl residues (position 64, α-helix E7) are reported in red. Abbreviations: CB, cyanogen bromide; C, chymotrypic peptide; E, endoproteinase Glu-C; T, tryptic peptides.

The crested porcupine Mb sequence data reported in this paper will appear in the UniProt Knowledgebase under the accession number C0HJQ9.

3.3. Determination of the primary structure of reindeer Mb

The strategy employed for the determination of the primary structure of reindeer Mb was basically similar to that used for crested porcupine Mb. ESI/Q-TOF mass spectrometry analysis of reindeer apo-myoglobin showed that its Mr was 16923.46 ± 0.02. The transformed mass spectrum is reported in Fig. 2B. The structural characterization was initially performed by de novo peptide sequencing by tandem MS as reported in paragraph 3.2. Amino acid sequences of reindeer Mb peptides obtained by tandem mass spectrometry are reported in Table 2. The de novo sequencing was supported by comparative homology analyses with the Cervus elaphus L. Mb (red deer; AC: P02191), on the basis of the high sequence identity with reindeer Mb. All tryptic peptides shown in Table 2 have the same amino acid sequence of the corresponding peptides from red deer Mb with the exception of peptide T-5. In Fig. 4 is reported the tandem mass spectrum of the doubly charged ion at m/z 759.80 (precursor ion: 1517.58 Da, expected molecular mass: 1517.66 Da; Δ = 0.08) from T-5 peptide (sequence position 119–133), containing the substitution N122D. The de novo sequencing data allowed us to obtain a coverage of about 57%. The complete overlapping of Mb peptides was achieved by MALDI-TOF MS analysis of peptides from chymotrypsin digestions or CNBr fragmentation (Table S2). The final sequence of reindeer Mb shows an experimental Mr (16923.46 ± 0.08) that is in very good agreement with theoretical one (Mr 16923.38). As reported in Fig. 3B, one residue substitution (N122D) was found in reindeer Mb with respect to the red deer Mb. On the other hand, proximal (position 93, α-helix F) and distal histidinyl residues (position 64, α-helix E7) are conserved.
Table 2 Amino acid sequences of tryptic peptides from reindeer myoglobin, obtained by tandem mass spectrometry. Sequence position, experimental masses of precursor ions, charge state and molecular weight of tandem MS/MS sequence deduced from y series, together with mass accuracy, are reported
  Tryptic peptide Sequence position Precursor ion (Da) Charge state MW from de novo sequence Δ (Da)
a Missed cleavage.
T-1 GLSDGEWQLVLNAWGK 1–16 1771.89 2 1772.82 −0.07
T-2 VEADVAGHGQEVLIR 17–31 1591.83 2 1591.82 −0.01
T-3 LFTGHPETLEK 32–42 1270.65 2 1270.57 −0.08
T-4 YLEFISDAIIHVLHAK 103–118 1868.03 3 1868.07 0.04
T-5 HPSDFGADAQGAMSK 119–133 1517.66 2 1517.58 −0.08
T-6 ALELFRNDMAAQYKa 134–147 1668.84 3 1668.77 −0.07


image file: c5ra01316j-f4.tif
Fig. 4 Fragmentation spectrum of the doubly charged precursor ion at m/z 759.80 (precursor ion: 1517.58 Da) mapped on sequence position 119–133. (A) MS/MS spectrum annotated with the y and b ion series. (B) Fragmentation table showing the ion series matching the spectrum. The matched and unmatched a, b, y and z ions are shown, along with the mass differences between the theoretical and experimental values. The matching probability is also reported below the three-letter amino acid code for the sequenced peptide.

The reindeer Mb sequence data reported in this paper will appear in the UniProt Knowledgebase under the accession number C0HJR0.

3.4. Crested porcupine and reindeer Mbs autoxidation rate

Metmyoglobin formation from oxymyoglobins at pH 7.2 and 37 °C (physiological condition) is presented in Fig. 5 for crested porcupine and reindeer. The metmyoglobin percentages increased over time in both Mb species with different autoxidation rates. A higher autoxidation rate was observed in reindeer OxyMb with respect to the crested porcupine one. In particular, the first order rate constants (k) were 0.0429 h−1 and 0.0336 h−1 for reindeer and crested porcupine, respectively.
image file: c5ra01316j-f5.tif
Fig. 5 Autoxidation rates of reindeer and crested porcupine Mbs.

These findings showed a higher autoxidation rate for reindeer Mb with respect to the crested porcupine one, and that several amino acid residues (i.e., Leu29, Lys45, Thr67, Val68)47 involved in the autoxidation mechanism are conserved. Thus, the variations observed in the primary structure (twenty five amino acid substitutions: Ala/Asp, Glu/Ala, Lys/Ala and His/Pro at position 53, 83, 87 and 88, respectively; Fig. S1) of reindeer Mb may induce a different functional behaviour. In this framework, further investigations in the primary structure of both Mbs are needed to identify specific differences that could potentially influence their autoxidation time course.

3.5. The 3D structural model of reindeer and crested porcupine Mbs

The three-dimensional structure of a protein can be very informative and useful to understand functional characteristics of proteins. Therefore, in order to provide the molecular details of reindeer and crested porcupine Mbs, we computationally determined the 3D structure of both proteins using the I-TASSER algorithm which builds 3D models on the base of multiple threading alignment Lometes and Illterative Tasser simulations.28 In particular, the structure prediction by I-TASSER rely on template proteins with known structures obtained from database and the prediction procedures is based on matching the query sequence against a non-redundant sequence database. The computational modeling of reindeer Mb and crested porcupine Mb structures were performed and five models for both proteins were generated using the I-TASSER algorithm with C-scores ranging from −5 to 1.28 and from −5 to 1.29, respectively. The C-score is a confidence score for estimating the quality of predicted models and ranges from −5 to 2, with higher scores representing higher confidence in the model. The model 1 for reindeer (C-score 1.28) and crested porcupine Mbs (C-score 1.29) was used as reference structure for all analysis described below (Fig. 6A and B). The good quality of the predicted models for both Mbs were determined by evaluating the Ramachandran plot (Fig. SI2) using the software PROCHECK.28 A comparison of reindeer (RMSDbb1–153 = 0.708 Å) and crested porcupine (RMSDbb1–153 = 0.729 Å) Mbs predicted models with the structure of myoglobin (PDB code: 1MBN)48 resolved by X-ray crystallography indicates that both proteins show the classical globular fold of Mbs. Notably, the three myoglobins share a similar hydrophobic cleft, in terms of structural features, in which is inserted the heme prosthetic group (Fig. 6C).
image file: c5ra01316j-f6.tif
Fig. 6 The 3D models of reindeer (blue) and crested porcupine (red) Mb superimposed to the X-ray structure (PDB code: 1MBN) of the sperm whale (Physeter macrocephalus L.) Mb (light gray) in two orientation (A and B) rotated of 180° around z-axis. The heme prosthetic group is shown in magenta. (C) Close-up view of the heme hydrophobic pocket. The distal and proximal histidinyl residues are shown in stick style. (D) Helix–helix angles and distances for the three myoglobins under investigation.

Overall, reindeer and crested porcupine Mbs exhibit the typical topology of myoglobins with most of the hydrophobic amino acid residues buried in the interior and many of the polar residues on the surface. The tertiary structure is composed of eight α-helices joined by short non-helical regions (Fig. 6A and B) that provide a rigid structural framework for the heme pocket. As expected, the two myoglobins adopt a similar compact structure (RMSDbb1–153 = 0.306 Å) with small but significant structural differences. Therefore, in order to quantify the conformational dissimilarity between both Mbs, we evaluated the orientation of the secondary structure elements by measuring the inter-helical angles and inter-helical distances of reindeer and crested porcupine Mbs, respectively. Based on the data reported in the table (Fig. 6D), due to a different orientation of α-helices that produce a slightly displacement, helices F, G and H display the most important structural variations. On the contrary, the hydrophobic pocket in which is located the heme prosthetic group, considering also the side-chain orientation of the distal and proximal histidinyl residues (His64, His93), does not show any significant structural difference. All together our data demonstrate that reindeer Mb, while retaining the typical structural organization of Mbs, adopts a fold that appears to be slightly less compact of crested porcupine Mb. As a consequence of these structural observations combined with the faster autoxidation rate of reindeer OxyMb with respect to porcupine, we can hypothesize that in the porcupine Mb, the Fe–O2 group is more protected in the cavity than in the structure of reindeer Mb. This scenario is further supported by computational data, reported in a previous publication,49,50 demonstrating that the residues of helix F, G and H (I99, I107, S108, F138 and Y146) have a significant impact on internal gas migration rates since they have a strong influence to the cavity network topology.

3.6. NMR spectroscopy

To further investigate the structural characteristics of reindeer and crested porcupine Mbs, we performed a solution structural characterization by Nuclear Magnetic Resonance spectroscopy. The 1H monodimensional spectra (Fig. 7A) acquired at 298 K indicate that both Mbs adopt a stable tertiary structure considering the good chemical shifts dispersion in the amide, aromatic, or methyl regions.
image file: c5ra01316j-f7.tif
Fig. 7 NMR structural investigation. (A) 1D 1H NMR spectrum acquired at pH 6.8, 298 K on 500 MHz spectrometer of reindeer (upper) and crested porcupine (lower) Mbs. (B) 2D 1H–1H NOESY spectrum of reindeer (left) and crested porcupine (right) Mbs. (C) Hydrodynamic parameters of crested porcupine and reindeer Mbs. The values are obtained by DOSY NMR measurements and by HYDRO software using the predicted 3D models.

This finding was further confirmed by two dimensional NMR experiments as NOESY38 (Fig. 7B) that represent a powerful method to obtain structural information regarding protein. In particular, in spite of the low resolution of spectra, 2D NOESY experiments of both Mbs in the amide region, show a considerable number of inter-residue HN–HN connectivities indicating that Mbs adopt in solution a folded conformation with the presence of α-helix secondary structure. In order to characterize the size and shape of reindeer and crested porcupine Mbs we investigated the hydrodynamic proprieties by Nuclear Magnetic Resonance experiments. The translational diffusion coefficients (Dt) of both Mbs were measured by diffusion-order spectroscopy (DOSY) NMR experiments at different concentrations. The measured diffusion coefficients of reindeer and crested porcupine Mbs are concentration independent (Fig. 7C), with a mean ± SD value of 1.16 ± 0.04 10−10 m2 s−1 and 1.17 ± 0.05 10−10 m2 s−1, respectively. These results clearly indicate that both myoglobins exist predominantly in a single state under the analysis conditions. By use of the Stokes–Einstein equation, the measured diffusion coefficients for reindeer and crested porcupine Mbs correspond to a hydrodynamic radius (Rh) of 2.06 nm and 2.04 nm, respectively (Fig. 7C). Moreover, we calculated, as reported in the Material and methods section, the correlation time (τc) that represents the time for a protein to rotate one radian. The obtained correlation time by the NMR data, using Stokes–Einstein equation as reported in the Experimental part, for reindeer (τc = 8.11 ± 0.06 ms) and crested porcupine (τc = 7.89 ± 0.06 ms) Mbs (Fig. 7C) are in a excellent agreement with that reported for different Mb from other species in a previous publication.51,52 Then, to estimate the molecular weight (MW) using the NMR experimental data we compared the obtained correlation time for both Mbs to a standard curve of τc versus protein molecular weight measured at the same temperature on a series of known monomeric proteins of varying size (Fig. SI3).53 The molecular weight of both Mbs (MWreindeer Mb ∼ 16.9 kDa, MWcrested porcupine Mb ∼ 16.5 kDa) obtained from NMR data is in good agreement with that measured by gel-filtration (data not-shown) or by mass spectrometry analysis. In conclusion, hydrodynamic data clearly indicate that reindeer and crested porcupine Mbs are monomeric under the analysed conditions.

3.7. Validation of porcupine and reindeer structural models

One strategy for assessing the accuracy of calculated ensemble conformers is the cross-validation. We performed a cross-validation analysis for crested porcupine and reindeer Mbs predicted models using the hydrodynamic properties that were not considered in the computational modeling. In particular, we back-calculated for both myoglobins the hydrodynamic radius using the HYDROPRO software.42–44 A comparison for both Mbs of the calculated hydrodynamic radius (Fig. 7C; Rh = 2.11 nm for reindeer or Rh = 2.10 nm for crested porcupine Mb) with the experimental value (Rh = 2.06 ± 0.09 nm for reindeer, Rh = 2.04 ± 0.09 nm for crested porcupine Mb) indicates that the predicted models can properly describe the experimental data observed in solution. Moreover, to further validate the predicted models, we estimated from CD data (Fig. 8) the protein secondary structure for both Mbs. The data indicate that the α-helix secondary structure content for reindeer (72.7%) and crested porcupine (72.6%) is in a good agreement with the α-helix amount (Mb reindeer = 72.5%, Mb crested porcupine = 71.2%) obtained from the predicted Mb models using the software DSSP.54 Overall, our analysis demonstrated that the predicted models for reindeer and crested porcupine Mbs represent a realistic picture of the tertiary structure that the proteins adopt in solution.
image file: c5ra01316j-f8.tif
Fig. 8 Thermal unfolding of reindeer and crested porcupine Mbs followed by circular dichroism. (A and C) Thermal unfolding of reindeer and crested porcupine Mbs carried out in the range of 278–371 K. (B and D) Melting curve of reindeer and crested porcupine Mbs monitored by CD at 222 nm. The data were fitted using a two-state model.

3.8. Thermal stability monitored by CD spectroscopy

Thermal unfolding of reindeer (Fig. 8A and B) and crested porcupine (Fig. 8C and D) Mbs has been investigated by CD spectroscopy. In both cases, the reversible thermal unfolding encompassing the temperature range between 283 and 371 K can be fitted to a classical two-state model with melting temperature of Tm = 353.7 K for reindeer Mb and Tm = 356.3 K for crested porcupine Mb (Table 3). Assuming a two-state mechanism for the thermal denaturation of both Mbs, the Gibbs free energies of protein unfolding (ΔuG) were calculated as reported in Materials and methods. As a criterion of the thermal stability of the two Mbs we estimated the Gibbs free energy at 298 K. Our data, illustrated in the Table 3, indicate that the two Mbs under investigation, while having a similar globular structure, show a different thermal stability. Overall, the thermal unfolding data indicate that reindeer Mb adopts a less stable conformation than the crested porcupine Mb. This finding may be due to the small but significant structural differences highlighted by the predicted and validated 3D models. Thus, reindeer Mb presents a slightly less compact fold with respect to the crested porcupine Mb.
Table 3 Summary of thermodynamic data for the unfolding of crested porcupine and reindeer myoglobins
Protein Tm (K) ΔuH° (kJ mol−1) ΔuG° (298 K) (kJ mol−1)
Reindeer Mb 353.7 257 38.8
Crested porcupine Mb 356.3 267 42.2


3.9. Comparison of myoglobins across species

The amino acid sequences of crested porcupine and reindeer Mbs were compared each other and with Mbs isolated from H. sapiens, S. scrofa, P. microcephalus, E. caballus, C. caretta and T. albacares (Fig. 9A). The analysis shows that proximal (position 93) and distal (position 64) histidinyl residues are present in both sequences, whereas several amino acid residues characterising the binding site for heme (i.e., Thr39, Lys42, Phe43, Ser92, His97, Ile99, Tyr103, Leu104)55 are conserved. Furthermore, the primary structure of crested porcupine and reindeer Mbs have 83.7% identity (88.2% similarity). When compared with other myoglobins (Fig. 9B), they showed a range of identity/similarity between 43.8 and 92.2% identity (54.9 and 96.1% similarity).
image file: c5ra01316j-f9.tif
Fig. 9 (A) Multiple alignment of myoglobin sequences from H. cristata, R. tarandus, P. microcephalus, S. scrofa, E. caballus, H. sapiens, C. caretta and T. albacares. Asterisk *, identical, double dots :, conserved and single dot., semiconserved amino acid residues. Proximal (position 93) and distal histidinyl residues (position 64) are reported in red. (B) Identity–similarity matrix of myoglobin sequences reported above. (C) Structure of the studied myoglobins aligned and superimposed, demonstrating the high conservation of their secondary structures. The structures showed are from H. sapiens (light gray) PDB ID: 3RGK, Physeter macrocephalus (orange) PDB ID: 1J52, S. scrofa (light pink) PDB ID: 1PMB, E. caballus (light green) PDB ID: 1WLA, T. albacares (yellow) PDB ID: 1MYT, C. caretta (violet) PDB ID: 1LHS, H. cristata (red), R. tarandus (blue). The Xe binding sites of P. microcephalus Mb are shown as dark gray spheres. The heme group is depicted in magenta.

In order to further understand the relationship between structure–function for reindeer and crested porcupine Mbs we analyzed the tertiary structure and investigated the network of O2 pathways for a set of myoglobins from different species. The main structural characteristic of myoglobin is the presence of four internal cavities in its native state, as depicted in Fig. 9C.56 The X-ray structure (PDB code 1J52) of the sperm-whale myoglobin obtained in the presence of 7 atm of Xenon demonstrated the occupation by Xe of the internal cavities (named Xe1, Xe2, Xe3, Xe4). These cavities with a radius larger than 1.2 Å, are lined by hydrophobic residues and are recognized to play an important role for the uptake of ligands.57 Moreover, an additional cavity is located in proximity of the distal histidine (DP). Several studies demonstrated the ability of myoglobin to reversibly combine with small ligands such as O2, CO and NO.49,58–61 For the case of O2 pathways Cohen and co-workers,49 using a computational approach for studying gas migration, identified the residues that affect gas ligand transport (Fig. S4). As illustrated in the Fig. 9B, the sequence identity of the myoglobins under investigation is between 50% and 95%. Additionally, the superposition of 3D structures indicates that the globular fold is well conserved among the analyzed myoglobins and their secondary and tertiary structures are near identical with only small structural differences. Moreover, according to the results reported by Cohen and Schulten60 we analyzed for reindeer and crested porcupine Mbs the content of less solvent exposed residues having a high propensity to create O2 favorable regions. Interestingly, our investigation indicates that reindeer Mb with respect to the crested porcupine Mb presents a larger number of residues promoting the formation of cavities. Therefore, since the tertiary structure is mainly conserved across the species we explored for the studied myoglobins the dimension of the internal cavities close to the residues having an important role in the O2 migration pathways. Interestingly, our analysis indicates that the various myoglobins exhibit cavity locations and dimensions which are completely different.

At first, in order to better explore the structural differences between myoglobins we analyzed the 3D structures evaluating the dimension of the internal cavities located close to the networks of O2 pathways. As reported in the table (Fig. S5), despite to a similar tertiary structure all myoglobins show high variability considering the volume of the cavities. Then, we compared the cavities detected for reindeer and crested porcupine Mbs. Notably, our analysis shows (Fig. 10) that reindeer Mb presents a larger number of cavities than the crested porcupine. This finding appears to be correlated to the different amino acid composition, as mentioned above, of the two myoglobins and may partially explain the different functional behaviour in terms of autoxidation rate. Of course, to fully understand the functional properties of both myoglobins a detailed dynamical description is required. In fact, due to the thermal fluctuations of the residues there is a possibility to have additional random cavities where oxygen molecules can fit in.


image file: c5ra01316j-f10.tif
Fig. 10 The 3D models of reindeer (A) and crested porcupine (B) Mbs in two orientation rotated of 180° around z-axis. The detected cavities are reported in dark gray. The volume of each cavity is also reported in parenthesis.

4. Conclusions and perspectives

Myoglobins isolated from crested porcupine (Hystrix cristata L.) and reindeer (Rangifer tarandus L.) with MW of 16867 Da and 16923 Da, respectively, show different functional properties. In particular, the reindeer Mb has a higher autoxidation rate with respect to the crested porcupine Mb. This finding, may be related to the differences observed in the primary structure of the two proteins. Moreover, the 3D models predicted and successively validated using experimental NMR data indicate that reindeer Mb presents a slightly less compact fold with respect to the crested porcupine Mb. Additionally, thermal unfolding measurements demonstrated that reindeer Mb adopts a less stable conformation than the crested porcupine Mb. Overall, our study suggests that, considering the small but significant structural differences combined with the conformational motions, reindeer Mb with respect to crested porcupine Mb may differently modulate the heme environment, facilitating oxygenation. In fact, our results may be useful to deeply understand the very complex gas diffusion process for both Mbs. Finally, our study may represent a suitable model to describe how proteins modulate the response activity to different external environmental conditions.

Acknowledgements

This research was supported by funds from the Second University of Naples.

References

  1. D. L. Gilbert, in Oxygen in the Animal Organism, ed. F. Dickens and E. Neil, Pergamon Press, New York, 1964, vol. 31, pp. 641–654 Search PubMed.
  2. S. N. Vinogradov, D. Hoogewijs, X. Bailly, R. Arredondo-Peter, J. Gough, S. Dewilde, L. Moens and J. R. Vanfleteren, BMC Evol. Biol., 2006, 6, 31 CrossRef PubMed.
  3. A. Maton, J. Hopkins, C. W. McLaughlin, S. Johnson, M. Q. Warner, D. LaHart and J. D. Wright, Human Biology and Health, Prentice Hall, Englewood Cliffs, New Jersey, USA, 1993 Search PubMed.
  4. D. L. Nelson and M. M. Cox, Lehninger Principles of Biochemistry, Freeman, W. H. & Company, New York, USA, 6th edn, 2013 Search PubMed.
  5. G. A. Ordway and D. J. Garry, J. Exp. Biol., 2004, 207, 3441–3446 CrossRef CAS PubMed.
  6. J. C. Kendrew, G. Bodo, H. M. Dintzis, R. G. Parrish, H. Wyckoff and D. C. Phillips, Nature, 1958, 181, 662–666 CrossRef CAS.
  7. M. Weber, M. Rau, K. Madlener, A. Elsaesser, D. Bankovic, V. Mitrovic and C. Hamm, Clin. Biochem., 2005, 38, 1027–1030 CrossRef CAS PubMed.
  8. D. W. Kehl, N. Iqbal, A. Fard, B. A. Kipper, A. De La Parra Landa and A. S. Maisel, Transl. Res., 2012, 159, 252–264 CrossRef CAS PubMed.
  9. M. Brunori, Protein Sci., 2010, 19, 195–201 CrossRef CAS PubMed.
  10. U. Flogel, M. W. Merx, A. Godecke, U. K. Decking and J. Schrader, Proc. Natl. Acad. Sci. U. S. A., 2001, 98, 735–740 CrossRef CAS.
  11. S. P. Suman and P. Joseph, Annu. Rev. Food Sci. Technol., 2013, 4, 79–99 CrossRef CAS PubMed.
  12. M. N. Antoniewski and S. A. Barringer, Crit. Rev. Food Sci. Nutr., 2010, 50, 644–653 CrossRef CAS PubMed.
  13. N. Giarretta, A. M. Di Giuseppe, M. Lippert, A. Parente and A. Di Maro, Food Chem., 2013, 141, 1814–1820 CrossRef PubMed.
  14. A. M. Di Giuseppe, N. Giarretta, M. Lippert, V. Severino and A. Di Maro, Food Chem., 2015, 169, 241–245 CrossRef CAS PubMed.
  15. J. T. Lecomte, D. A. Vuletich and A. M. Lesk, Curr. Opin. Struct. Biol., 2005, 15, 290–301 CrossRef CAS PubMed.
  16. L. Ma, X. Shao, Y. Wang, Y. Yang, Z. Bai, Y. Zhao, G. Jin, Q. Ga, Q. Yang and R. L. Ge, Gene, 2014, 533, 532–537 CrossRef CAS PubMed.
  17. A. Di Maro, A. Chambery, A. Daniele, P. Casoria and A. Parente, Phytochemistry, 2007, 68, 767–776 CrossRef CAS PubMed.
  18. A. Di Maro, I. Terracciano, L. Sticco, L. Fiandra, M. Ruocco, G. Corrado, A. Parente and R. Rao, J. Biotechnol., 2010, 147, 1–6 CrossRef CAS PubMed.
  19. R. Dosi, A. Di Maro, A. Chambery, G. Colonna, S. Costantini, G. Geraci and A. Parente, Comp. Biochem. Physiol., Part B: Biochem. Mol. Biol., 2006, 145, 230–238 CrossRef PubMed.
  20. R. Dosi, A. Carusone, A. Chambery, V. Severino, A. Parente and A. Di Maro, Food Chem., 2012, 133, 1646–1652 CrossRef CAS PubMed.
  21. U. K. Laemmli, Nature, 1970, 227, 680–685 CrossRef CAS.
  22. E. Gross, Methods Enzymol., 1967, 11, 238–255 CAS.
  23. A. Chambery, A. Di Maro, M. M. Monti, F. Stirpe and A. Parente, Eur. J. Biochem., 2004, 271, 108–117 CrossRef CAS.
  24. A. Di Maro, A. Chambery, V. Carafa, S. Costantini, G. Colonna and A. Parente, Biochimie, 2009, 91, 352–363 CrossRef CAS PubMed.
  25. A. Di Maro, P. Ferranti, M. Mastronicola, L. Polito, A. Bolognesi, F. Stirpe, A. Malorni and A. Parente, J. Mass Spectrom., 2001, 36, 38–46 CrossRef CAS PubMed.
  26. V. Severino, A. Chambery, M. Vitiello, M. Cantisani, S. Galdiero, M. Galdiero, L. Malorni, A. Di Maro and A. Parente, J. Proteome Res., 2010, 9, 1050–1062 CrossRef CAS PubMed.
  27. E. E. Di Iorio, Methods Enzymol., 1981, 76, 57–72 CAS.
  28. A. Roy, A. Kucukural and Y. Zhang, Nat. Protoc., 2010, 5, 725–738 CrossRef CAS PubMed.
  29. R. A. Laskowski, J. A. Rullmannn, M. W. MacArthur, R. Kaptein and J. M. Thornton, J. Biomol. NMR, 1996, 8, 477–486 CrossRef CAS.
  30. I. W. Davis, A. Leaver-Fay, V. B. Chen, J. N. Block, G. J. Kapral, X. Wang, L. W. Murray, W. B. Arendall, J. Snoeyink, J. S. Richardson and D. C. Richardson, Nucleic Acids Res., 2007, 35, W375–W383 CrossRef PubMed.
  31. W. L. DeLano, The PyMOL Molecular Graphics System, DeLano Scientific, San Carlos, CA, USA, 2002 Search PubMed.
  32. R. Koradi, M. Billeter and K. Wüthrich, J. Mol. Graphics, 1996, 14, 51–55 CrossRef CAS , 29–32.
  33. E. F. Pettersen, T. D. Goddard, C. C. Huang, G. S. Couch, D. M. Greenblatt, E. C. Meng and T. E. Ferrin, J. Comput. Chem., 2004, 25, 1605–1612 CrossRef CAS PubMed.
  34. R. P. Joosten, T. A. te Beek, E. Krieger, M. L. Hekkelman, R. W. Hooft, R. Schneider, C. Sander and G. Vriend, Nucleic Acids Res., 2011, 39, D411–D419 CrossRef CAS PubMed.
  35. J. Dundas, Z. Ouyang, J. Tseng, A. Binkowski, Y. Turpaz and J. Liang, Nucleic Acids Res., 2006, 34, W116–W118 CrossRef CAS PubMed.
  36. S. H. Oliveira, F. A. Ferraz, R. V. Honorato, J. Xavier-Neto, T. J. Sobreira and P. S. de Oliveira, BMC Bioinf., 2014, 15, 197 CrossRef PubMed.
  37. R. Brüschweiler and R. R. Ernst, J. Magn. Reson., 1983, 53, 521–528 Search PubMed.
  38. A. Kumar, R. R. Ernst and K. Wüthrich, Biochem. Biophys. Res. Commun., 1980, 95, 1–6 CrossRef CAS.
  39. Y. Cohen, L. Avram and L. Frish, Angew. Chem., Int. Ed. Engl., 2005, 44, 520–554 CrossRef CAS PubMed.
  40. F. Delaglio, S. Grzesiek, G. W. Vuister, G. Zhu, J. Pfeifer and A. Bax, J. Biomol. NMR, 1995, 6, 277–293 CrossRef CAS.
  41. R. L. J. Keller, Optimizing the process of nuclear magnetic resonance spectrum analysis and computer aided resonance assignment, Dissertation, Swiss Federal Institute of Technology, Zürich, Switzerland, 2004.
  42. J. García De la Torre, M. L. Huertas and B. Carrasco, J. Magn. Reson., 2000, 147, 138–146 CrossRef PubMed.
  43. J. García De la Torre, M. L. Huertas and B. Carrasco, Biophys. J., 2000, 78, 719–730 CrossRef.
  44. A. Ortega, D. Amorós and J. García de la Torre, Biophys. J., 2011, 101, 892–898 CrossRef CAS PubMed.
  45. S. M. Kelly, T. J. Jess and N. C. Price, Biochim. Biophys. Acta, 2005, 1751, 119–139 CrossRef CAS PubMed.
  46. E. Pizzo, P. Buonanno, A. Di Maro, S. Ponticelli, S. De Falco, N. Quarto, M. V. Cubellis and G. D'Alessio, J. Biol. Chem., 2006, 281, 27454–27460 CrossRef CAS PubMed.
  47. R. E. Brantley Jr, S. J. Smerdon, A. J. Wilkinson, E. W. Singleton and J. S. Olson, J. Biol. Chem., 1993, 268, 6995–7010 CAS.
  48. H. C. Watson, Prog. Stereochem., 1969, 4, 299 CAS.
  49. J. Cohen, A. Arkhipov, R. Braun and K. Schulten, Biophys. J., 2006, 91, 1844–1857 CrossRef CAS PubMed.
  50. X. Huang and S. G. Boxer, Nat. Struct. Biol., 1994, 1, 226–229 CrossRef CAS PubMed.
  51. D. Wang, U. Kreutzer, Y. Chung and T. Jue, Biophys. J., 1997, 73, 2764–2770 CrossRef CAS.
  52. G. Gros, B. A. Wittenberg and T. Jue, J. Exp. Biol., 2010, 213, 2713–2725 CrossRef CAS PubMed.
  53. P. Rossi, G. V. Swapna, Y. J. Huang, J. M. Aramini, C. Anklin, K. Conover, K. Hamilton, R. Xiao, T. B. Acton, A. Ertekin, J. K. Everett and G. T. Montelione, J. Biomol. NMR, 2010, 46, 11–22 CrossRef CAS PubMed.
  54. R. P. Joosten, T. A. te Beek, E. Krieger, M. L. Hekkelman, R. W. Hooft, R. Schneider, C. Sander and G. Vriend, Nucleic Acids Res., 2011, 39, D411–D419 CrossRef CAS PubMed.
  55. S. V. Evans and G. D. Brayer, J. Mol. Biol., 1990, 213, 885–897 CrossRef CAS.
  56. R. F. Tilton Jr, I. D. Kuntz Jr and G. A. Petsko, Biochemistry, 1984, 23, 2849–2857 CrossRef CAS.
  57. M. Brunori, D. Bourgeois and B. Vallone, J. Struct. Biol., 2004, 147, 223–234 CrossRef CAS PubMed.
  58. C. Bossa, A. Amadei, I. Daidone, M. Anselmi, B. Vallone, M. Brunori and A. Di Nola, Biophys. J., 2005, 89, 465–474 CrossRef CAS PubMed.
  59. E. E. Scott, Q. H. Gibson and J. S. Olson, J. Biol. Chem., 2001, 276, 5177–5188 CrossRef CAS PubMed.
  60. J. Cohen and K. Schulten, Biophys. J., 2007, 93, 3591–3600 CrossRef CAS PubMed.
  61. M. Ceccarelli, R. Anedda, M. Casu and P. Ruggerone, Proteins: Struct., Funct., Bioinf., 2008, 71, 1231–1236 CrossRef CAS PubMed.

Footnote

Electronic supplementary information (ESI) available. See DOI: 10.1039/c5ra01316j

This journal is © The Royal Society of Chemistry 2015
Click here to see how this site uses Cookies. View our privacy policy here.