Study of ion dynamics in lanthanum aluminate probed by conductivity spectroscopy
Onkar Nath Verma,
Nitish Kumar Singh,
Raghvendra and
Prabhakar Singh*
Department of Physics, Indian Institute of Technology (BHU), Varanasi-221005, India. E-mail: psingh.app@iitbhu.ac.in
First published on 19th February 2015
Abstract
Ion conducting lanthanum aluminate, LaAlO3 was synthesized via a citrate nitrate auto combustion route. Phase formation of LaAlO3 was studied by thermal and powder X-ray diffraction techniques. The conductivity spectra of LaAlO3 were investigated in the frequency range 20 Hz to 1 MHz at different temperatures. The conductivity data were analyzed in terms of Jonscher's power law. The dc conductivity and hopping frequency of the charge carrier were extracted from the analysis of conductivity spectra. The corresponding value of activation energy implies that the conductivity is mainly dependent on the mobility of the charge carriers. The conductivity spectra were scaled according to Ghosh scaling. Moreover, the modulus spectra were also scaled. Both the scaling behaviours reflected the temperature independent conduction mechanism in the system.
1. Introduction
Perovskite oxides are of great research interest due to their wide applicability as dielectric thermistors, barrier layer capacitors, dielectric amplifiers,1–5 oxygen sensors, humidity sensors6,7 and anodes, cathodes, electrolytes or interconnects for solid oxide fuel cells8–14 etc. These oxides have the general formula ABO3. An ideal perovskite has a cubic structure. The cubic structure often distorts to tetragonal, rhombohedral or orthorhombic symmetry due to tilting of BO6 octahedra.Among the various perovskite oxides, LaAlO3 and its derivatives have found application in the fields of high frequency capacitors, magneto hydrodynamic generators, substrates for super conducting, ferroelectric thin films and colossal magneto resistance15–21 and electrolytes for solid oxide fuel cells.22 Pure LaAlO3 is rhombohedral at room temperature and transforms to cubic at 450 °C. LaAlO3 derivatives arising from substitution by different dopants either on the La or Al sites are known to be mixed ionic and p-type electronic conductors at high oxygen partial pressure and good ionic conductors at low partial pressure.23 Also these materials have low cost, moderate thermal expansion and higher stability with respect to reduction and volatilization.24
To tailor the properties of ion conducting materials understanding of their ion dynamics is necessary. Thus the different groups and authors have tried various approaches to understand the ion dynamics in number of systems, such as glasses, polymers, semiconductors, nano-composites and poly-crystals etc., and succeed to explore mechanism of conduction.25–28 The ion dynamics can be extracted with the help of either conductivity spectra29 or modulus spectra.30 In the former description, the real part of ac conductivity, σ′ of ionic conductor could be described in term of Jonscher's power law:31,32
 | (1) |
The above expression consists of two parts: (i) frequency independent part commonly known as dc conductivity, σdc and (ii) frequency dependent ac component. νp is the cross over frequency from dc to the dispersive conductivity region and n is power-law exponent represent the electric relaxation behavior of the material with value generally smaller than unity. Almond and West proposed crossover frequency as hopping frequency in their work.33 The hopping frequency, ωH can be also correlated with dc conductivity through Nernst–Einstein relation
 | (2) |
It has been proven that conductivity spectra of ion conducting materials at different temperature follow the scaling law known as time temperature superposition principle (TTSP). It means, for a material, the conductivity isotherm can be superimposed to a single curve using appropriate scaling parameters with respect to conductivity and frequency. This principle can be mathematically expressed as34,35
 | (3) |
In the present paper, auto-combustion synthesis and structure of ion conducting LaAlO3 have been described. Besides this, to understand the ion dynamics for this material in the measured temperature range, scaling of the conductivity spectra has been done and discussed. To the best of our knowledge no literature is available on the scaling behavior of this system and this is the first report on the scaling of conductivity spectra for LaAlO3.
2. Experimental
Lanthanum aluminate (LaAlO3) was prepared by auto-combustion synthesis using lanthanum nitrate, La(NO3)3·6H2O (Alfa Aesar), aluminium nitrate, Al(NO3)3·6H2O (Alfa Asear) as cation precursors and citric acid (C6H8O7·H2O) (Merck) as a fuel. All the precursors having purity more than 99% was used. Ammonia solution was used to achieve particular value of pH. Aqueous solutions of lanthanum nitrate, aluminium nitrate, and citric acid were prepared separately and mixed in appropriate amounts. The optimized molar ratio of the fuel (citrate) to oxidizer (nitrate) equal to 0.4 was used for the controlled combustion. The above value of pH 6 was maintained to avoid phase segregation and to provide a true homogeneous distribution of all the cations at atomic level. The solution was evaporated on a hotplate at ∼200 °C with constant stirring. During evaporation, the homogeneously mixed solution became viscous and turned into a gel. In the course of time, the formed gel slowly foamed, swelled, and finally burnt on its own. The whole process was completed within a few seconds, giving rise to dark grey voluminous powder (ash). This ash was grounded and calcined at 700 °C for 4 h in air with heating and cooling rate of 5 °C min−1. This powder was then pressed into pellets (thickness 1–2 mm and diameter 12 mm) using a uniaxial hydraulic press at a load of 7 ton. These pellets were sintered at 1300 °C for 8 h in air with heating and cooling rate of 5 °C min−1.Simultaneous differential thermal analysis (DTA) and thermogravimetric analysis (TGA) of the ash prepared powder was carried out using Netzsch STA 449 F3, Germany at a heating rate of 10 °C min−1 up to 1000 °C in the oxygen atmosphere. Powder X-ray diffraction (XRD) pattern was recorded using Rigaku Miniflex II Desktop X-ray Diffractometer, Japan employing CuKα radiation and Ni filter. Sintered pellet was polished using emery papers of grade 1/0, 2/0, 3/0, 4/0, and 5/0 (Sia, Switzerland). Electrical measurements were performed on the silver coated pellet using two probe method in the frequency range 20 Hz to 1 MHz using Wayne Kerr 6500P LCR meter, U.K. in the temperature range 300–750 °C in air.
3. Results and discussion
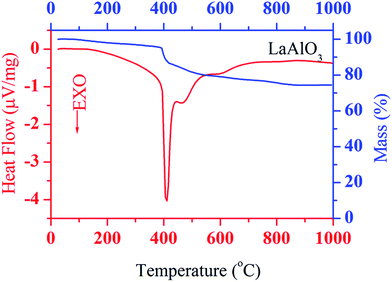
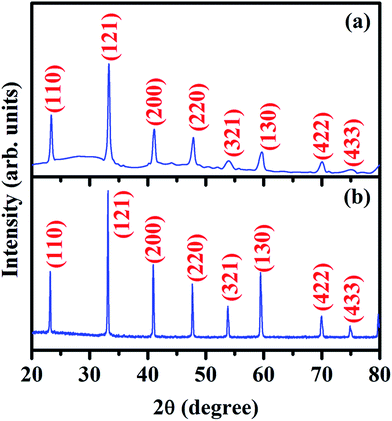
Plots of simultaneous DTA and TGA of ash prepared powder, in the temperature range 25–1000 °C are shown in Fig. 1. TGA curve shows that the sample loses weight rapidly at 400 °C followed by gradual decrease in weight up 700 °C. Also, it shows loss in weight of sample about 25% of its original weight. Corresponding to weight loss in TGA curve, a series of three exothermic peaks are also observed in the DTA curve, one pronounced peak at about 400 °C and two broad peaks at about 470 °C and 600 °C, respectively. These may be attributed to the crystallization, loss of residual citric acid and burning off the carbonaceous materials. No change is found in DTA and TGA curves above 700 °C. This shows the formation of well crystallized LaAlO3 at about 700 °C. Based on DTA and TGA results, ash was ground and calcined at 700 °C for 4 h.To observe the phase purity and crystal structure of the calcined and sintered samples, powder X-ray diffraction measurement were performed. The obtained XRD patterns for the calcined and sintered powders of LaAlO3 are shown in Fig. 2a and b, respectively. XRD pattern of calcined sample shows some minor phase in addition to major phase of LaAlO3 whereas XRD pattern of the sintered sample clearly reflects the single phase formation of LaAlO3, as all the peaks of the XRD pattern could be indexed on the basis of rhombohedral perovskite structure with space group R![[3 with combining macron]](https://www.rsc.org/images/entities/char_0033_0304.gif) c using JCPDS file no. 82-0478. The minor phase present in the calcined sample was eliminated during sintering process at high temperature. The similar structure is also reported by Derighetti et al.42 Miller indices, hkl, corresponding to each peak are shown in the Fig. 2a and b. The only difference in the X-ray patterns of the calcined and sintered samples are the sharpness of their peaks. The broader peaks in the X-ray pattern of the calcined sample show smaller crystallite size whereas the sharper peaks in the X-ray pattern of the sintered sample show bigger crystallite size. The bigger crystallite of the sintered sample is a consequence of collapse of smaller crystallites of calcined powder during sintering to obtain dense and compact pellets for further characterizations. Lattice parameters were obtained using full pattern Lebail refinement of powder X-ray diffraction pattern of sintered powder of LaAlO3 with rhombohedral structure in the R
c using JCPDS file no. 82-0478. The minor phase present in the calcined sample was eliminated during sintering process at high temperature. The similar structure is also reported by Derighetti et al.42 Miller indices, hkl, corresponding to each peak are shown in the Fig. 2a and b. The only difference in the X-ray patterns of the calcined and sintered samples are the sharpness of their peaks. The broader peaks in the X-ray pattern of the calcined sample show smaller crystallite size whereas the sharper peaks in the X-ray pattern of the sintered sample show bigger crystallite size. The bigger crystallite of the sintered sample is a consequence of collapse of smaller crystallites of calcined powder during sintering to obtain dense and compact pellets for further characterizations. Lattice parameters were obtained using full pattern Lebail refinement of powder X-ray diffraction pattern of sintered powder of LaAlO3 with rhombohedral structure in the R![[3 with combining macron]](https://www.rsc.org/images/entities/char_0033_0304.gif) c space group and found to be a = b = 5.3545(19); c = 13.1276(93), α = β = 90; γ = 120.
c space group and found to be a = b = 5.3545(19); c = 13.1276(93), α = β = 90; γ = 120.
The electrical relaxation and ion dynamics of LaAlO3 was probed by conductivity spectroscopy. It is well known fact that in polycrystalline materials, grain, grain-boundary, and electrode–specimen interface contribute to the conductivity relaxation. The conductivity spectra of these materials consist of two plateau and two dispersion regions in the absence of electrode polarization.43 The first plateau in low-frequency region represents total or bulk conductivity (σdc) and the successive dispersion region is due to the combined effect of the grain conductivity and grain-boundary dielectric relaxation processes. The second plateau after this dispersion region corresponds to the grain contribution to the bulk conductivity. The successive dispersion after second plateau, in the high frequency regime, is due to the dielectric contribution of the grain relaxation. The frequency dependent conductivity spectra of LaAlO3 at various temperatures are shown in Fig. 3. The symbols in this figure represent the experimental data and the solid lines represent fit to the data points by eqn (1). The above figure clearly show the first plateau corresponding to bulk conductivity, σdc caused by the random motion of the mobile charge carriers, and the dispersion regime assigned to the ac conductivity caused by the correlated forward–backward hopping motion of the charge carriers. In the present case, the second plateau in the higher frequency regime, as mentioned earlier, could not be observed due to limited frequency range available. The variables σdc, and the exponent factor, n were obtained by fitting of data points to the eqn (1) at all the measured temperatures.
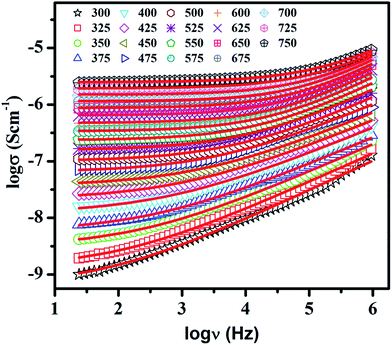 | ||
| Fig. 3 Conductivity spectra of LaAlO3 at a few temperatures. Symbols denote the experimental data points and the solid lines represent the fit to the data points with eqn (1). The temperature is shown in degree Celsius. | ||
The reciprocal of temperature dependence of bulk conductivity, σdc and hoping frequency, νH are shown in Fig. 4a and b. These plots show the Arrhenius behavior. The activation energy (EH = 0.93 eV) for hopping obtained by least square linear fit of data points of Fig. 4b is close to the activation energy (Eσ = 0.99 eV) of the bulk conductivity, σdc, found from the least square linear fit of the data points of Fig. 4a. This indicates that the concentration of the mobile charge carriers is independent of temperature and hence, the conductivity is determined primarily by the mobility of the charge carriers.44 The value of activation energy for bulk conductivity implies conduction is due to oxide ion through oxygen vacancies.19
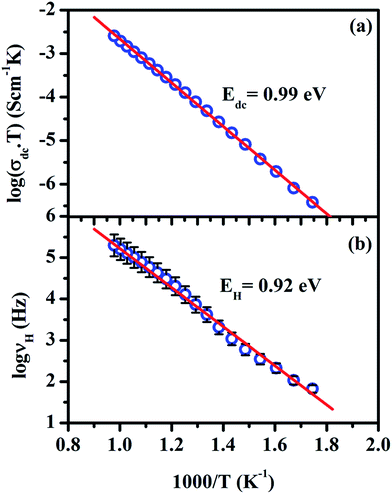 | ||
| Fig. 4 Arrhenius representation of (a) dc conductivity and (b) the hopping frequency for LaAlO3. Symbols denote the data points obtained from the best fit of eqn (1) to the conductivity spectra and the solid lines represent the liner fit to the data points. The error bars of 5% are also shown to account the error in the determination of hopping frequency. | ||
Moreover, to examine the correlation between bulk conductivity, σdc and hoping frequency, νH the logarithmic plot were drawn between these two parameters as shown in Fig. 5. The above figure clearly shows the linear dependence of these parameters on each other with slope of almost unity. This implies that the dc and ac conductions are correlated in LaAlO3. This type of behavior is also reported by Ahmad et al. in polycrystalline PbSnF4 (ref. 45) and by Ghosh et al. in lithium telluride glasses.40
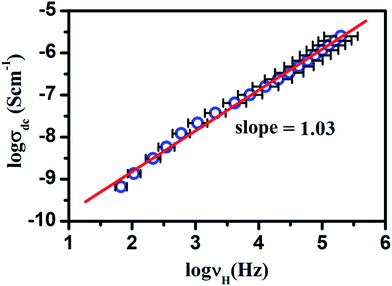 | ||
| Fig. 5 The dc conductivity, σdc vs. hopping frequency, νH for LaAlO3. Symbols denote the data points obtained from the best fit of eqn (1) to the conductivity spectra and the solid lines represent the liner fit to the data points. The error bars of 5% are also shown to account the error in the determination of hopping frequency. | ||
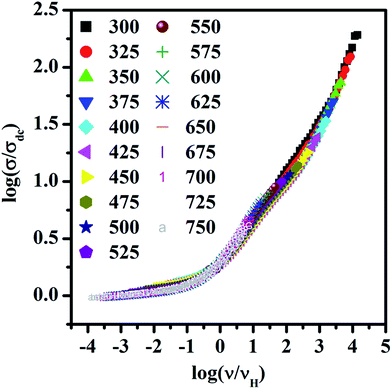
To gain insight into temperature dependence of conduction mechanism the scaling behavior of frequency dependent conductivity has been studied. For the present investigation Ghosh scaling has been applied in which hopping frequency has been taken as a scaling factor. The scaled spectra of LaAlO3 at different temperatures are shown in Fig. 6. It can be seen that all the spectra at different temperature merge onto a single master curve with negligible deviation. The negligible deviation may have been observed due to window effect as consequence of limited available frequency range.35,46 The merger of different curve onto a single master curve indicates that LaAlO3 obey the time temperature superposition principle in the entire temperature and frequency ranges. Thus, the dynamics of oxide ion in LaAlO3 is independent of temperature. Also, the superposition of different spectra to a master curve for LaAlO3 may be result of unchanged dimensionality of the conduction pathways.47
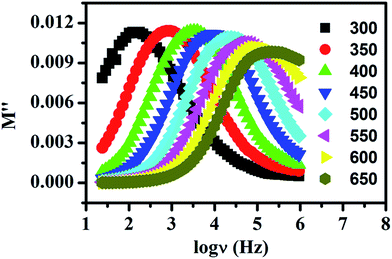
It has been mentioned in introduction that some groups prefer interpretation of ion dynamics with the help of modulus spectra. This method was introduced by Macedo et al.48 to explore the ion dynamics in ion conducting materials by eliminating the electrode polarization effect. Fig. 7 shows the imaginary part of the modulus spectra for LaAlO3 at few temperatures. This spectrum shows a single relaxation peak which is asymmetric in nature. It is also seen that M′′ spectra is much border than the Debye peak which can be attributed to the distributed relaxation times. The conductivity relaxation frequency, νmax, corresponding to M′′max, gives the most probable relaxation time, τmax, and can be obtained by the relation νmaxτmax = 1 which holds at the peak of the relaxation curve. The region to the left of this peak represents the region in which the long range motion of ions takes place while the region to the right of this peak corresponds to the localized forward–backward hopping of the ions.49 With increasing temperature movement of the charge carriers becomes faster and consequently they possess decreased relaxation time and hence shift of the peak value towards higher frequencies observed. Thus it can be concluded that the relaxation process is thermally activated and charge carrier hopping is taking place in LaAlO3.
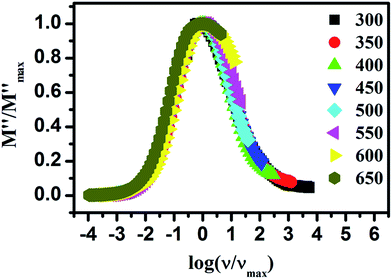
For the better understanding of relaxation dynamics, here scaling behaviour of the modulus spectra have also been utilized. Fig. 8 shows scaled spectra of LaAlO3 in which axis of the imaginary modulus has been scaled by M′′max and axis of the frequency has been scaled by νmax. From the figure it can be seen that the spectra at different temperature are nearly overlapped onto a single master curve. This indicates that the dynamical process controlling the conductivity relaxation is same over the entire temperature range of measurement.
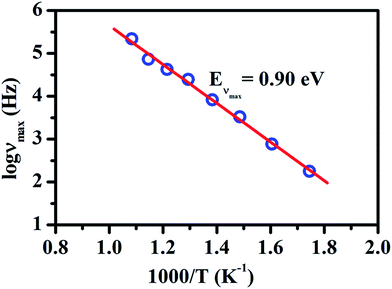
Fig. 9 represents the Arrhenius plot of νmax for LaAlO3. The symbol show the data point corresponding to peak frequency obtain from the Fig. 7 and solid line shows the linear fit to the data points. The activation energy, Eνmax calculated from the slope was found to be 0.90 eV. When comparing it with the values of the activation energy shown in Fig. 4a and b for dc conductivity and hopping frequency then one can see that these values are closer to each other. The closer value of activation energy of EH and Eνmax indicate that the hoping frequency, νH, and the peak frequency, νmax, provide the limit at which short range hoping motion is changing into the long range percolation.
Thus from the above discussion it can be concluded that scaling behaviour of the modulus spectra supplements the findings obtained by the scaling behaviour of the conductivity spectra.
4. Conclusion
Lanthanum aluminate has been prepared successfully by citrate nitrate auto combustion route. The thermal analysis and powder X-ray diffraction pattern showed the single phase formation of LaAlO3 at 700 °C with rhombohedral perovskite structure with space group R![[3 with combining macron]](https://www.rsc.org/images/entities/char_0033_0304.gif) c. In this system, the charge carriers are temperature independent and the conductivity is mainly depending on the mobility of the charge carriers. Oxide ions are mainly involved in the conduction as the charge carrier. The dc and ac conductions are correlated in LaAlO3. The scaling of the conductivity spectra follows the Ghosh scaling. This indicates that the hopping frequency is a suitable scaling parameter for LaAlO3. The scaling property is also observed in the modulus spectra of LaAlO3.
c. In this system, the charge carriers are temperature independent and the conductivity is mainly depending on the mobility of the charge carriers. Oxide ions are mainly involved in the conduction as the charge carrier. The dc and ac conductions are correlated in LaAlO3. The scaling of the conductivity spectra follows the Ghosh scaling. This indicates that the hopping frequency is a suitable scaling parameter for LaAlO3. The scaling property is also observed in the modulus spectra of LaAlO3.
Acknowledgements
The authors are thankful to Naval Research Board for financial support through Project no. NRB-293/MAT/12-13.Notes and references
- J. Felz, J. Eur. Ceram. Soc., 2000, 20, 2367 CrossRef.
- K. Preis, O. Bíró, P. Supancic and I. Ticar, IEEE Trans. Magn., 2003, 39, 1733 CrossRef.
- A. R. West, T. B. Adams, F. D. Morrison and D. C. Sinclair, J. Eur. Ceram. Soc., 2004, 24, 1439 CrossRef CAS.
- A. K. Rai, N. K. Singh, S. K. Acharya, L. Singh and K. D. Mandal, Mater. Sci. Eng., B, 2012, 177, 1213 CrossRef CAS PubMed.
- W. P. Masont and R. F. Wick, Proc. Inst. Radio Eng., 1954, 1606 Search PubMed.
- M. L. Post, J. J. Tunney, D. Yang, X. Du and D. L. Singleton, Sens. Actuators, B, 1999, 59, 190 CrossRef CAS.
- M. Viviani, M. T. Buscaglia, V. Buscaglia, M. Leoni and P. Nanni, J. Eur. Ceram. Soc., 2001, 21, 1981 CrossRef CAS.
- A. Atkinson, S. Barnett, R. J. Gorte, J. T. S. Irvine, A. J. McEvoy, M. Mogensen, S. C. Singhal and J. Vohs, Nat. Mater., 2004, 3, 17 CrossRef CAS PubMed.
- B. A. Boukamp, Nat. Mater., 2003, 2, 294 CrossRef CAS PubMed.
- Raghvendra, R. K. Singh and P. Singh, Ceram. Int., 2014, 40, 7177 CrossRef CAS PubMed.
- J. H. Kim, Y. Kim, P. A. Connor, J. T. S. Irvine, J. Bae and W. Zhou, J. Power Sources, 2009, 194, 704 CrossRef CAS PubMed.
- A. Tarancón, S. J. Skinner, R. J. Chater, F. H. Ramírez and J. A. Kilner, J. Mater. Chem., 2007, 17, 3175 RSC.
- B. C. H. Steele and A. Heinze, Nature, 2001, 414, 345 CrossRef CAS PubMed.
- Raghvendra, R. K. Singh and P. Singh, Solid State Ionics, 2014, 262, 428 CrossRef CAS PubMed.
- W. Berkstresser, A. J. Valentino and C. D. Brandle, J. Cryst. Growth, 1993, 128, 684 CrossRef.
- G. Y. Sung, K. Y. Kang and S. C. Park, J. Am. Ceram. Soc., 1991, 74, 437 CrossRef CAS PubMed.
- T. Y. Chen and K. Z. Fung, J. Alloys Compd., 2004, 368, 106 CrossRef CAS PubMed.
- M. Nieminen, T. Sajavaara, E. Rauhala, M. Putkonen and L. Niisisto, J. Mater. Chem., 2001, 11, 2340 RSC.
- T. L. Nguyen, M. Donkiya, S. Wang, H. Togawa and T. Hashimoto, Solid State Ionics, 2000, 130, 229 CrossRef CAS.
- B. J. Kennedy, C. J. Howard, A. K. Prodlosantoso and B. C. Chakoumakos, Appl. Phys. A: Mater. Sci. Process., 2002, 74, 1660 CrossRef.
- R. Guo, D. Guo, Y. Chen, Z. Yang and Q. Yuan, Ceram. Int., 2002, 28, 699 CrossRef CAS.
- C. B. Alcock, J. W. Fergus and L. wang, Solid State Ionics, 1992, 51, 291 CrossRef CAS.
- D. Lybye, F. W. Pouisen and M. Mogensen, Solid State Ionics, 2000, 128, 91 CrossRef CAS.
- V. V. Kharton, F. M. B. Marques and A. Atkinson, Solid State Ionics, 2004, 174, 135 CrossRef CAS PubMed.
- K. Funke, B. Heimann, M. Vering and D. Wilmer, J. Electrochem. Soc., 1998, 148, 395 CrossRef PubMed.
- K. Funke, P. Singh and R. D. Banhatti, Phys. Chem. Chem. Phys., 2007, 9, 5582 RSC.
- M. M. Ahmad and K. Yamada, J. Chem. Phys., 2007, 127, 124507 CrossRef PubMed.
- A. Karmakar and A. Ghosh, J. Appl. Phys., 2011, 110, 034101 CrossRef PubMed.
- J. C. Dyre, J. Appl. Phys., 1988, 64, 2456 CrossRef PubMed.
- K. L. Ngai and C. T. Moynihan, Mater. Res. Soc. Bull., 1998, 23, 51 CAS.
- A. K. Jonscher, Nature, 1977, 267, 267 CrossRef.
- D. P. Almond and A. R. West, Nature, 1983, 306, 456 CrossRef CAS.
- D. P. Almond, G. K. Duncan and A. R. West, Solid State Ionics, 1983, 8, 159 CrossRef CAS.
- S. Murugavel and B. Roling, Phys. Rev. Lett., 2002, 89, 1959021 CrossRef.
- H. Kahnt, Ber. Bunsen-Ges., 1991, 95, 1021 CrossRef CAS.
- S. Summerfield, Philos. Mag. B, 1985, 52, 9 Search PubMed.
- B. Roling, A. Happe, K. Funke and M. D. Ingram, Phys. Rev. Lett., 1997, 7, 82160 Search PubMed.
- D. L. Sidebottom, Phys. Rev. Lett., 1999, 82, 3653 CrossRef CAS.
- S. D. Baranovskii and H. Cordes, J. Chem. Phys., 1999, 111, 7546 CrossRef CAS PubMed.
- A. Ghosh and A. Pan, Phys. Rev. Lett., 2000, 84, 2188 CrossRef CAS.
- A. Ghosh and M. Sural, J. Chem. Phys., 2001, 114, 3243 CrossRef CAS PubMed.
- B. Derighetti, J. E. Drumheller, F. Laves, K. A. Müller and F. Waldner, Acta Crystallogr., 1965, 18, 557 CrossRef CAS.
- R. Wasser, J. Am. Ceram. Soc., 1991, 74, 1934 CrossRef PubMed.
- E. F. Hairetdinov, N. F. Uvarov, H. K. Patel and S. W. Martin, Phys. Rev. B: Condens. Matter Mater. Phys., 1994, 50, 13259 CrossRef CAS.
- M. M. Ahmad, K. Yamada and T. Okuda, Solid State Ionics, 2004, 167, 285 CrossRef CAS PubMed.
- H. Jain and C. H. Hsieh, J. Non-Cryst. Solids, 1994, 172–174, 1408 CrossRef CAS.
- D. L. Sidebottom, Phys. Rev. Lett., 1999, 83, 983 CrossRef CAS.
- P. B. Macedo, C. T. Moynihan and R. Bose, Phys. Chem. Glasses, 1972, 13, 171 CAS.
- J. M. Bose, J. M. Reau, J. Senegas and M. Poulain, Solid State Ionics, 1995, 82, 39 CrossRef.
| This journal is © The Royal Society of Chemistry 2015 |

