Green synthesized silver nanoparticles decorated on reduced graphene oxide for enhanced electrochemical sensing of nitrobenzene in waste water samples†
Chelladurai Karuppiaha,
K. Muthupandib,
Shen-Ming Chen*ac,
M. Ajmal Alic,
Selvakumar Palanisamya,
A. Rajanb,
P. Prakash*b,
Fahad M. A. Al-Hemaidc and
Bih-Show Lou*d
aElectroanalysis and Bioelectrochemistry Lab, Department of Chemical Engineering and Biotechnology, National Taipei University of Technology, No. 1, Section 3, Chung-Hsiao East Road, Taipei 106, Taiwan, People's Republic of China. E-mail: smchen78@ms15.hinet.net; Fax: +886-2-27025238; Tel: +886-2-27017147
bDepartment of Chemistry, Thiagarajar College, Madurai-625009, Tamilnadu, India. E-mail: kmpprakash@gmail.com; Fax: +91-4522312375; Tel: +91-9842993931 Tel: +91-4522456783
cDepartment of Botany and Microbiology, College of Science, King Saud University, Riyadh 11451, Saudi Arabia
dChemistry Division, Center for General Education, Chang Gung University, Tao-Yuan, Taiwan. E-mail: blou@mail.cgu.edu.tw
First published on 23rd March 2015
Abstract
In the present work, an electrochemical sensor for nitrobenzene (NB) has been developed based on a green synthesized silver nanoparticles (AgNPs) decorated reduced graphene oxide (RGO) modified glassy carbon electrode (GCE). The AgNPs were synthesized using Justicia glauca leaf extract as a reducing and stabilizing agent. A RGO–AgNPs composite modified electrode was prepared by a simple electrochemical reduction of AgNPs dispersed GO solution. FESEM of RGO–AgNPs composite confirms that AgNPs are firmly attached on the RGO sheets and the average size of AgNPs is found to be 40 ± 5 nm. The modified electrode shows good efficiency with lower overpotential for electrocatalytic reduction of NB than that of other modified electrodes (AgNPs and RGO). The DPV response confirms that the reduction peak current of NB is linear over the concentrations from 0.5 to 900 μM. The sensitivity of the sensors is found to be 0.836 μA μM−1 cm−2 with the detection limit of 0.261 μM for NB. In addition, the RGO–AgNPs composite modified electrode shows good selectivity in the presence of potentially interfering similar compounds and good practicality in the waste water samples.
1. Introduction
Nitrobenzene (NB) is a highly toxic carcinogenic compound and has been listed as one of the priority pollutants by the United States Environmental Protection Agency (USEPA).1 It has also been used as a raw material for the preparation of explosives, herbicides, insecticides, aniline and dyes.2–4 Even in very low concentration, NB may pose a great threat to human health and the environment. Large amounts of NB are released from industries resulting in high toxicity of water bodies. It is very stable in aqueous solution due to the presence of the NO2 group.5–7 Therefore, the sensitive determination of NB in environmental samples is of great importance for human health. The well known methods for NB determination are based on chromatographic, spectrophotometric and electrochemical methods.8–10 In recent years, electrochemical methods have been widely used for the quantitative determination of NB due to their high sensitivity, easy handling and low cost.11Compared to unmodified electrodes, the nanomaterials modified electrodes have been widely used for the electrochemical determination of NB owing to their high surface area and excellent electrochemical property.12 In addition, these modified electrodes enhance the sensitivity and selectivity of the NB detection more than that of conventional electrodes. Researchers have paid much attention on reduced graphene oxide (RGO) owing to its unique properties such as high specific surface area and high chemical stability.13–15 The unique properties of RGO combined with other nanomaterials have been used for different potential applications, such as energy storage, antibacterial, electrochemical sensor and biosensors, gas sensors etc.16–23 Among the variety of metal and metal oxide nanoparticles, AgNPs have received considerable interest due to their unique structural properties including sensing of nitro compounds.24–27 Recently, our group has found that the green synthesized nanoparticles have high electrocatalytic activity towards NB.27 However, the green synthesized AgNPs have some limitations on the detection of nitro compounds, such as low sensitivity, lower response range and narrow potential window. In order to improve the sensitivity, the AgNPs have been combined with RGO and used for the ultrasensitive detection of NB.
Herein, we report the electrochemical determination of NB using AgNPs decorated RGO (RGO–AgNPs) modified glassy carbon electrode (GCE). The modified electrode exhibits good sensitivity and lower overpotential compared to AgNPs and RGO modified electrodes. Moreover, the analytical performance of the modified electrode has been evaluated in waste water samples and the selectivity of the fabricated sensor has also been determined in the presence of potentially interfering compounds such as nitro and phenolic compounds and metal ions.
2. Experimental
Materials
Silver nitrate (AgNO3) and nitrobenzene were purchased from Sigma-Aldrich. The leaves of Justicia glauca were collected from Sirumalai hills region, Tamil Nadu, India. Raw graphite with average diameter about >20 μm was obtained from Sigma Aldrich. The supporting electrolyte used for all experiments was prepared by using 0.05 M Na2HPO4 and NaH2PO4 solutions. All other chemicals were of analytical grade and the solutions were prepared with double-distilled water.Methods
Cyclic voltammetry (CV) and differential pulse voltammetry (DPV) experiments were carried out using CHI 750a work station. A conventional three-electrode cell containing the modified GCE was used as a working electrode. Pt wire and saturated Ag/AgCl were used as a counter and reference electrodes, respectively. Surface morphological study was carried out using JSM-6500F field emission scanning electron microscope (FESEM) and the elemental analysis was performed using Hitachi S-3000H scanning electron microscope attached with Energy Dispersive X-ray Analyzer. Jasco V-560 double-beam spectrophotometer was used for UV-visible spectral analysis. All the electrochemical measurements were carried out at room temperature in a nitrogen (N2) atmosphere.Green synthesis of AgNPs
The 50 mL of Justicia glauca leaf extract was mixed with 100 mL of aqueous solution of 1 mM AgNO3 at room temperature. The pale greenish yellow colour solution becomes deeper brown within an hour and no noticeable difference in the colour of aqueous silver colloids is observed, which indicates that the bio-reduction process is over within an hour. The colour changes indicate the formation of AgNPs in aqueous solution due to excitation of Surface Plasmon vibration in the metal nanoparticles as shown in Fig. S1.† The synthesized AgNPs were collected by centrifugation and washing several times with double distilled water. The dried AgNPs were lyophilized in ambient condition. After lyophilisation, the AgNPs were stored in screw cap bottle for further characterization.Fabrication of RGO–AgNPs modified GCE
The GO was synthesized according to our previous report using Hummers method.24 1 mg mL−1 of GO solution was taken to synthesize the present nanocomposite. In order to prepare the RGO–AgNPs composite, the as-synthesized AgNPs with different concentrations (0.5, 1, 2 and 3 mg mL−1) were mixed with GO (1 mg mL−1) solution and sonicated for 30 min. About 6 μL (optimum) of GO–AgNPs solution was drop casted on pre-cleaned GCE surface. 10 consecutive cyclic voltammograms were performed using the GO–AgNPs modified electrode in the potential range of 0 to −1.3 V in pH 5 solution at a scan rate of 50 mV s−1. After 10 successive consecutive cycles the GO–AgNPs modified electrode was reduced to RGO–AgNPs modified electrode.28 The resulting RGO–AgNPs modified electrode was further used for the detection of NB.3. Results and discussion
Characterization of synthesized RGO–AgNPs composite
UV-Vis spectroscopy is an important technique to verify the size, shape, and stability of the nanoparticles. The formation of AgNPs was visually identified by means of change in colour from pale greenish yellow to brown.29 Fig. S1† illustrates the UV-Vis spectra of silver colloid with different time intervals of 10, 30, 60 min. The spectral values were recorded at 445, 452, 453 nm and they were indexed as S1, S2, S3, respectively. The surface plasmon resonance (SPR) peak occurs at 453 nm with high absorbance for AgNPs.30 The absorption peak has steadily increased up to 1 h after that it was unchanged, which indicates that the reaction is completed within 1 h. The intensity of colour does not intensify after 1 h which is established by UV-Vis spectra. The size and morphology of the synthesized AgNPs on RGO were determined by FESEM. Fig. 1 displays the FESEM image of AgNPs (A), GO–AgNPs (B) and RGO–AgNPs (C).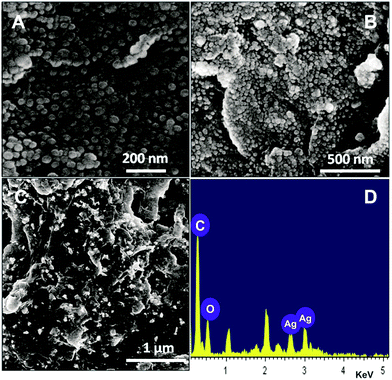 | ||
| Fig. 1 FESEM images of AgNPs (A), GO–AgNPs (B) and RGO–AgNPs (C). The corresponding EDX of RGO–AgNPs. | ||
As shown in Fig. 1C, the spherical and uniform sized AgNPs are observed on RGO. The morphology and size of the AgNPs are in close agreement with the AgNPs on GO (B). The EDX results also further confirm the presence of metallic Ag, carbon and oxygen in the RGO–AgNPs composite. The particle size distribution histogram for AgNPs in GO–AgNPs and RGO–AgNPs composites are shown in Fig. 2A and B. The histogram of AgNPs in RGO–AgNPs composite indicates that the size of the AgNPs is 40 nm and the observations are in close agreement with the size of AgNPs in RGO. These findings further confirm that the size of the AgNPs is not affected after the electrochemical preparation of RGO–AgNPs.
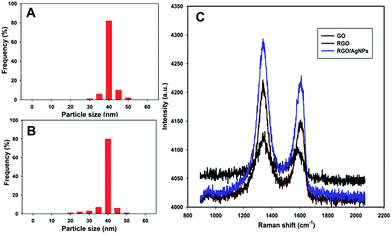 | ||
| Fig. 2 The size distribution histogram of AgNPs in GO–AgNPs (A) and RGO–AgNPs (B). (C) Raman spectra of GO (black line), RGO (brown line) and RGO–AgNPs (blue line). | ||
Raman spectroscopy is widely used for the confirmation of the transformation of GO to RGO. Fig. 2C shows the Raman spectra of GO (black line), RGO (brown line) and RGO–AgNPs (blue line). The Raman spectra of GO, RGO and RGO–AgNPs show the D and G band at about 1338 and 1509 cm−1, 1339 and 1606 cm−1 and 1339 and 1608 cm−1, respectively. The D and G bands are attributed to the vibrations of sp3 carbon atoms of disordered graphene nanosheets and vibrations of sp2 carbon atom domains of graphite. The RGO and RGO–AgNPs show higher intensity (1.06) of the D to G band (ID/IG) than that of GO (1.0). The result indicates that the high ability for the recovery of the hexagonal network of carbon atoms and formation of new graphitic domains. Furthermore, the observed intensity of the G band of RGO–AgNPs is higher than RGO, which is attributed to the polar interaction of AgNPs with RGO. However, the interaction of AgNPs with RGO is relatively low compared to GO due to the less oxygen-containing groups of RGO. These observations further confirm the transformation GO–AgNPs to RGO–AgNPs after the electrochemical reduction process.
Fig. S2† shows the FT-IR spectral data was obtained from the powdered samples of untreated leaf (b) and green synthesized AgNPs (a), respectively. The band around 3752 and 3652 cm−1 can be assigned to the –C– of carboxylic group.29 Band around 3569 and 3371 cm−1 can be assigned for the O–H stretching vibration indicating the presence of hydroxyl group.30 The minor as well as sharp band observed in the region 2925 and 2850 cm−1 is due to the stretching vibration of –C–H–.31 The band observed at 1741 cm−1 is attributed to a carbonyl group. The strong as well as broad band observed at 1649 cm−1 may be assigned to the –OH bending modes. The band observed at 1514 cm−1 is assigned to C–C aromatic vibrations.32 The weak band observed at 1400 cm−1 is due to C–H deformation vibrations. The band observed at 1153 cm−1 can be attributed to carbonyl group as in aldehydic or ketonic group. The band observed at 1028 cm−1 is due to the vibrational stretching frequency modes of C–O–C of phenolic compounds.33 After the bioreduction of silver ion with the Justicia glauca extract, the bands at 3652, 3752 and 3569 cm−1 remain unaffected but the band intensities have reduced. It suggests the possible involvement of –C– of carboxylic group and hydroxyl group during the nanoparticles synthesis. The band at 3371 cm−1 is shifted to 3429 cm−1 with broad band intensity, suggesting that the hydroxyl group plays a vital role during the nanoparticles synthesis. The sharp band at 2925 cm−1 and minor band at 2850 cm−1 are unaffected but the band intensities have decreased. This suggests the possible involvement of –C–H– of aromatic ring during the nanoparticles synthesis. The band at 1741 cm−1 is shifted to 1751 cm−1, suggesting the possible involvement of carbonyl group in the nanoparticles synthesis. The sharp and narrow band at 1649 cm−1 is shifted to 1697 cm−1 with diminished band intensity, suggesting that the excess of hydroxyl groups in aromatic ring involve throughout the nanoparticles synthesis. The sharp and narrow band at 1514 cm−1 is shifted to 1600 cm−1 with reduced band intensity, confirming the possible involvement of C–C aromatic group during the synthesis. The band at 1400 cm−1 is shifted to 1425 cm−1 with reduced band intensity, suggesting the involvement of C–H group in aromatic ring. The band at 1153 cm−1 remains unaffected but the band intensity has reduced, which suggests the possible involvement of carbonyl group. The broad band at 1028 cm−1 is shifted to 1018 cm−1 with reduced band intensity, suggesting the involvement of C–O–C of phenolic compound during the bioreduction process.34–36
Electrochemical properties of RGO–AgNPs composite
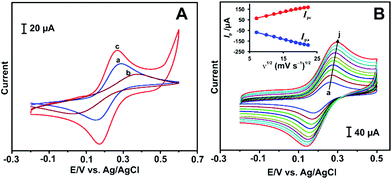
To evaluate the electrochemical properties of RGO–AgNPs composite, cyclic voltammetry was performed in a 5 mM K3[Fe(CN)6] solution with 0.1 M KCl at a scan rate of 100 mV s−1. Fig. 3A represents the electrochemical behaviour of redox couple of Fe(III)/Fe(II) at bare GCE (a), GO–AgNPs/GCE (b) and RGO–AgNPs/GCE (c). At bare GCE, a well-defined redox peaks appear with a peak-to-peak separation (ΔEp) of 136 mV, which indicates that the electrochemical process of Fe(III)/Fe(II) at bare GCE is reversible.In contrast, the current intensities decrease with higher ΔEp (374 mV) observed at GO–AgNPs/GCE, which is attributed to the low surface area that retards the electrochemical activity of GO–AgNPs. However, the Fe(III)/Fe(II) redox couple is highly active on RGO–AgNPs/GCE with increased peak current response with low ΔEp (97 mV). This result indicates that the electron transfer kinetics of Fe(III)/Fe(II) is greatly enhanced by RGO–AgNPs composite compared to other modified electrodes. This is because of the high conductivity of RGO–AgNPs thus improving the electron transfer of redox couple towards electrode surface. In addition, CVs were also recorded for the influence of scan rate at the RGO–AgNPs/GCE under similar experimental conditions and are shown in Fig. 3B. The redox peak current of Fe(III)/Fe(II) increases with increasing the scan rate from 50 to 500 mV s−1 (a–j), and the anodic and cathodic peak currents are linear with the square roots of the scan rates (Fig. 3B inset). This result indicates that the electrochemical behaviour of Fe(III)/Fe(II) at the modified electrode is a typical diffusion controlled electrochemical process.
Electrochemical behaviour of NB on RGO–AgNPs modified electrode
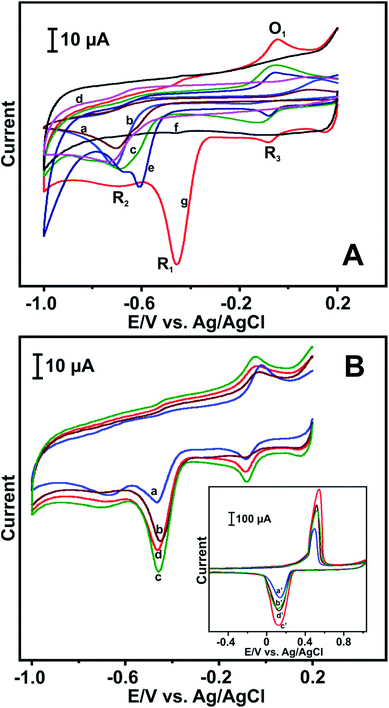
The electrochemical behaviour of NB on different modified electrodes was studied by using CV. Fig. 4A depicts the electrochemical behaviour of NB on (a) bare, (b) AgNPs, (c) GO, (d) RGO, (e) GO–AgNPs, (g) RGO–AgNPs modified GCEs in 100 μM NB containing PBS at a scan rate of 50 mV s−1. As can be seen in curve (f) (RGO–AgNPs), there is no significant peak appeared in the absence of 100 μM NB, whereas a well-defined reduction peak (R1) is clearly observed at −0.458 V in the presence of 100 μM NB (curve g). The corresponding peak is related to the reduction of NB to phenyl hydroxylamine. Although three more peaks are observed at RGO–AgNPs modified GCE and designated as R2, R3 and O1. The peak R2 is due to the formation of aniline from phenyl hydroxylamine (R1) and the redox peak R3/O1 is the reversible behaviour of phenyl hydroxylamine to nitrosobenzene.37 The peak current of R2 is lower than R1, which indicates that the NB reduction at RGO–AgNPs/GCE is more favoured to form a phenyl hydroxylamine in neutral or alkaline medium. On the other hand, the enhanced reduction peak current response is observed on RGO–AgNPs modified GCE compared to other modified GCEs. Moreover, the reduction peak potential of NB shifts toward positive direction at RGO–AgNPs modified electrode by 151, 276, 255 and 250 mV compared to GO–AgNPs (e), RGO (d), AgNPs (b) and (a) bare GCEs, respectively. The result demonstrates that the decrease in overpotential of RGO–AgNPs electrode toward NB is attributed to the strong π–π interaction between the NB and RGO and more active sites of AgNPs.38 The firm attachment of AgNPs on RGO nanosheets is due to the polar interaction of AgNPs with oxygen functional groups of RGO.The effect of different concentrations of AgNPs on the electrochemical response of NB in RGO was further studied by using CV. The different concentrations of GO–AgNPs dispersions were prepared by dispersing AgNPs (0.5, 1, 2 and 3 mg mL−1) in GO solution by sonication. Fig. 4B shows the CV response of 100 μM NB containing PBS at different concentrations of AgNPs loaded RGO modified electrode at a scan rate of 50 mV s−1. The utmost cathodic peak current response is observed for 2 mg mL−1 AgNPs dispersed RGO. As shown in Fig. 4B inset, the maximum anodic and cathodic peak current of AgNPs at RGO is observed for 2 mg mL−1 AgNPs dispersion. The current response of AgNPs decrease in the concentration of AgNPs above or below 2 mg mL−1 dispersion. Hence 2 mg mL−1 AgNPs dispersed GO solution was used for the RGO–AgNPs electrode fabrication and chosen as an optimum for further electrochemical studies for NB.
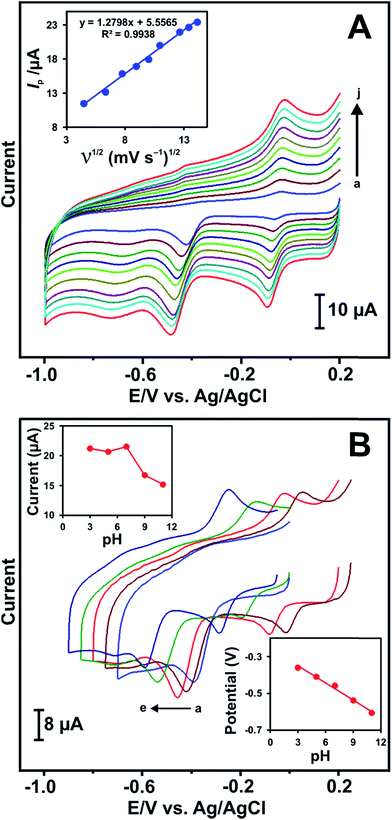
Fig. 5A shows the CV responses of RGO–AgNPs modified electrode in 100 μM NB containing PBS at a scan rate of 50 mV s−1. The reduction peak current of NB increases with increasing the scan rates from 20 to 200 mV s−1 (a–j) and the peak potential (Epc) shifts slightly towards higher negative potential. The reduction peak current response of NB has a linear relationship with the square root of scan rates (Fig. 5A inset). The linear regression equation is found to be Ip (μA) = 1.2798ν1/2 (mV s−1)1/2 + 5.5565; R2 = 0.9938. The result indicates that the electrochemical reduction of NB at RGO–AgNPs/GCE is a diffusion controlled irreversible electrode process. The irreversible electrochemical behaviour NB is confirmed from the plot of Epc vs. log![[thin space (1/6-em)]](https://www.rsc.org/images/entities/char_2009.gif) ν (Fig. S3†) and the corresponding linear regression equation can be expressed as, Epc (V) = −0.0899
ν (Fig. S3†) and the corresponding linear regression equation can be expressed as, Epc (V) = −0.0899![[thin space (1/6-em)]](https://www.rsc.org/images/entities/char_2009.gif) log
log![[thin space (1/6-em)]](https://www.rsc.org/images/entities/char_2009.gif) ν − 0.2858; R2 = 0.9983. According to the Tafel equation, the above relationship can be expressed as:
ν − 0.2858; R2 = 0.9983. According to the Tafel equation, the above relationship can be expressed as:
 | (1) |
![[thin space (1/6-em)]](https://www.rsc.org/images/entities/char_2009.gif) 485C mol−1) and α value is calculated as 0.66. The Tafel slope, b = 2.303RT/αnF, value is calculated to be 89.9 mV per decade which is higher than 60 mV.39,40 The obtained b value clearly indicates that one electron is involved in the rate determining step. The electrochemical reduction of NB is evaluated by CV at RGO–AgNPs modified electrode in the presence of 100 μM NB containing different pH solutions (pH 3, 5, 7, 9 and 11(a–e)) as depicted in Fig. 5B. Upon increasing the pH from 3 to 7 (upper inset), the Ipc increases gradually up to 7 and then decreases at higher pH with negative potential shift (lower inset). This result suggests that the electrochemical reduction of NB is pH dependent and hydrogen ion concentration may affect the rate of reduction reaction. In addition, the reduction product of NB, phenyl hydroxylamine, is more active in neutral and/or higher pH range.41 Hence, the pH 7 was chosen as an optimum pH for further analytical studies of NB.
485C mol−1) and α value is calculated as 0.66. The Tafel slope, b = 2.303RT/αnF, value is calculated to be 89.9 mV per decade which is higher than 60 mV.39,40 The obtained b value clearly indicates that one electron is involved in the rate determining step. The electrochemical reduction of NB is evaluated by CV at RGO–AgNPs modified electrode in the presence of 100 μM NB containing different pH solutions (pH 3, 5, 7, 9 and 11(a–e)) as depicted in Fig. 5B. Upon increasing the pH from 3 to 7 (upper inset), the Ipc increases gradually up to 7 and then decreases at higher pH with negative potential shift (lower inset). This result suggests that the electrochemical reduction of NB is pH dependent and hydrogen ion concentration may affect the rate of reduction reaction. In addition, the reduction product of NB, phenyl hydroxylamine, is more active in neutral and/or higher pH range.41 Hence, the pH 7 was chosen as an optimum pH for further analytical studies of NB.
Electrochemical determination of NB at RGO–AgNPs modified electrode
The electrochemical determination of NB was done at RGO–AgNPs modified electrode in PBS by using DPV. Fig. 6 depicts that the DPV response of RGO–AgNPs modified electrode in different concentrations of NB from 0.5 to 900 μM (a–r) containing PBS. It can be seen that a sharp reduction peak is observed for the addition of 0.5 μM NB and the reduction current increases with increasing the concentration of NB. The reduction peak current response increases linearly up to 900 μM (Fig. 6B inset). The calibration plot for Ipc versus different concentrations of NB is found to be Ipc = 0.0663 [NB]/μM + 1.5981 with the correlation coefficient of 0.9965. The sensitivity is calculated as 0.836 μA μM−1 cm−2. The limit of detection (LOD) is estimated to be 0.261 μM.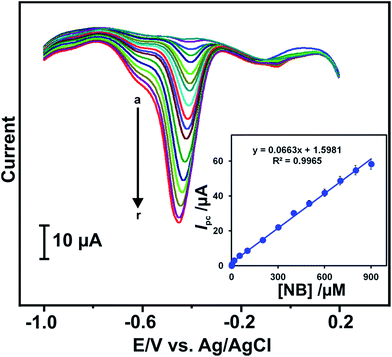 | ||
| Fig. 6 DPV response of RGO–AgNPs/GCE for PBS containing different concentrations of NB in the concentration range of 0.5–900 μM (a–r). Inset: the calibration plot of Ipc vs. [NB]/μM. | ||
The analytical performance such as LOD, sensitivity, linear response range of the sensor was compared with previously reported NB sensors and the comparative results are shown in Table 1. It can be seen that the developed NB is more comparable with the previously reported NB sensors.42–48 Thus, it can be used for sensitive detection of NB in environment samples.
| Modified electrode | Linear range (μM) | Sensitivity (μA μM−1 cm−2) | LODa (μM) | Ref. |
|---|---|---|---|---|
| a LOD – limit of detection.b OMC – ordered mesoporus carbon.c DDAB – didodecyldimethylammonium bromide.d GCE – glassy carbon electrode.e BiF – bismuth-film.f CPE – carbon paste electrode.g ATP-Ag – attapulgite-silver nanocomposites.h PNMPC – platinum nanoparticles/macroporous carbon.i OMCN – ordered mesoporous carbon nitride.j TMPP – tetra(4-methoxyphenyl) porphyrin.k N-OMC – N-doped ordered mesoporous carbon.l Pd – palladium nanoparticles.m GG-g-PAM – guar gum grafted polyacrylamide.n RGO – reduced graphene oxide.o AgNPs – silver nanoparticles. | ||||
| OMCb/DDABc/GCEd | 20–2900 | — | 10 | 42 |
| BiFe/CPEf | 1–100 | 0.289 | 0.83 | 43 |
| ATP-Agg/GCE | 3–30 | — | 1.1 | 44 |
| PNMPCh/Nafion/GCE | 1–200 | 6.93 | 0.05 | 45 |
| OMCNi/GCE | 0.5–1000 | 0.675 | 0.18 | 46 |
| TMPPj/N-OMCk/GCE | 0.528–132 | — | 0.38 | 47 |
| Pdl-GG-g-PAMm-silica/GCE | 1–3900 | 0.026 | 0.06 | 48 |
| RGOn–AgNPso/GCE | 0.5–900 | 0.836 | 0.26 | Present work |
Selectivity study
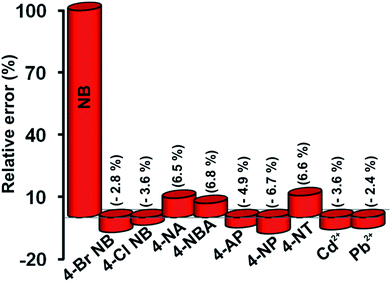
In order to study the effect of interference, the DPV was performed at RGO–AgNPs modified electrode for the response of 100 μM NB in the presence of different nitroaromatic compounds and some potentially interfering metal ions. Fig. 7 represents the percentage of relative error for the determination of NB with 5-fold of organic and 10-fold of metal ions, such as 4-bromo nitrobenzene (4-Br NB), 4-chloro nitrobenzene (4-Cl NB), 4-nitroaniline (4-NA), 4-nitrobenzoic acid (4-NBA), 4-acetamido phenol (4-AP), 4-nitro phenol (4-NP), 4-nitro toluene (4-NT), cadmium (Cd2+) and lead (Pb2+), respectively. The nitroaromatic compounds such as 4-Br NB, 4-Cl NB, Cd2+ and Pb2+ show less interfering effect of about 3.6% on the NB detection.Whereas the other nitroaromatic compounds significantly affect the peak current response of NB owing to their similar structural activity, the response current of NB is changed only 6.8% in the presence of 5-folds concentration of nitroaromatic compounds, which indicate that the fabricated modified electrode is more suitable for selective determination of NB in the presence of nitroaromatic compounds and metal ions.
Determination of NB in real sample analysis
The practical viability of the fabricated RGO–AgNPs modified electrode was evaluated for the determination of NB in waste water samples. The waste water samples were collected from outside the university premise. The DPV was used for the determination of NB and the waste water did not show any response for NB, which reveals that no NB contamination was found in the collected waste water samples. Under similar experimental conditions, the different concentration of NB was spiked into the waste water samples and the recovery results were calculated by the standard addition method. The recovery result along with relative standard deviation (RSD) is summarized in Table 2. The good recovery results with a range of about 98.2–100.8% is obtained using the fabricated electrode and the RSD values for three samples are of 2.96, 2.63 and 3.22%, respectively. These good recovery results and RSDs of the developed sensor prove the good practicality towards the determination of NB in waste water samples.Stability, repeatability and reproducibility studies
The electrode stability is most significant factor for all newly developed sensors. The reduction peak current response of 100 μM NB at RGO–AgNPs modified electrode was examined up to 52 days by CV and stored in PBS when not in use. The modified electrode retains about 90.15% of its initial current response after 52 days, which indicates the excellent storage stability of the sensor. To evaluate the repeatability and reproducibility of the developed sensor, the CVs were performed for the reduction of 100 μM NB in PBS. The acceptable repeatability with the RSD of 4.2% is found for single electrode in 5 different measurements. The fabricated sensor shows a satisfactory reproducibility with the RSD of 3.80% for determination of NB using 5 different sensors.4. Conclusions
In conclusion, green synthesized AgNPs decorated RGO modified GCE has been used for the sensitive detection of NB. The RGO–AgNPs modified electrode exhibits a high sensitivity and lower overpotential for the detection of NB compared to other modified electrodes. The fabricated electrode shows many advantages, such as good sensitivity, low LOD, wide linear response range along with good selectivity for NB determination. A good recovery result of NB in waste water samples indicates the good practicality of the developed sensor. The fabricated sensor can be further extended for the sensitive trace level detection of NB in environmental samples.Acknowledgements
The support of the visiting professorship to SMC at the King Saud University is gratefully acknowledged.Notes and references
- A. Agrawal and P. G. Tratnyek, Environ. Sci. Technol., 1996, 30, 153–160 CrossRef CAS.
- Y. Mu, H. Q. Yu, J. C. Zheng, S. J. Zhang and G. P. Sheng, Chemosphere, 2004, 54, 789–794 CrossRef CAS PubMed.
- A. Zosel, K. Rychter and J. B. Leikin, Am. J. Therapeut., 2007, 14, 585–587 CrossRef PubMed.
- L. Zhao, J. Ma and Z. Z. Sun, Appl. Catal., B, 2008, 79, 244–253 CrossRef CAS PubMed.
- B. E. Haigler and J. C. Spain, Appl. Environ. Microbiol., 1991, 57, 3156–3162 CAS.
- P. S. Majumder and S. K. Gupta, Water Res., 2003, 37, 4331–4336 CrossRef CAS.
- P. Roy, A. P. Periasamy, C. T. Liang and H. T. Chang, Environ. Sci. Technol., 2013, 47, 6688–6695 CAS.
- S. P. Wang and H. J. Chen, J. Chromatogr. A, 2002, 979, 439–446 CrossRef CAS.
- H. Ebrahimzadeh, Y. Yamini and F. Kamarei, Talanta, 2009, 79, 1472–1477 CrossRef CAS PubMed.
- Y. Mu, R. A. Rozendal, K. Rabaey and J. Keller, Environ. Sci. Technol., 2009, 43, 8690–8695 CrossRef CAS PubMed.
- Y. Zhang, L. Zeng, X. Bo, H. Wang and L. Guo, Anal. Chim. Acta, 2012, 752, 45–52 CrossRef CAS PubMed.
- J. Tang, D. P. Tang, Q. F. Li, B. L. Su, B. Qiu and G. N. Chen, Anal. Chim. Acta, 2011, 697, 16–22 CrossRef CAS PubMed.
- A. K. Geim and K. S. Novoselov, Nat. Mater., 2007, 6, 183–191 CrossRef CAS PubMed.
- M. Pumera, A. Ambrosi, A. Bonanni, E. L. K. Chng and H. L. Poh, Trends Anal. Chem., 2010, 29, 954–965 CrossRef CAS PubMed.
- V. Singh, D. Joung, L. Zhai, S. Das, S. I. Khondaker and S. Seal, Prog. Mater. Sci., 2011, 56, 1178–1271 CrossRef CAS PubMed.
- S. Bai and X. Shen, RSC Adv., 2012, 2, 64–98 RSC.
- X. Z. Tang, Z. W. Cao, H. B. Zhang, J. Liu and Z. Z. Yu, Chem. Commun., 2011, 47, 3084–3086 RSC.
- S. Kumar, C. Selvaraj, L. G. Scanlon and N. Munichandraiah, Phys. Chem. Chem. Phys., 2014, 16, 22830–22840 RSC.
- L. Yu, Y. Zhang, B. Zhang and J. Liu, Sci. Rep., 2014, 4, 4551, DOI:10.1038/srep04551.
- W. P. Xu, L. C. Zhang, J. P. Li, Y. Lu, H. H. Li, Y. N. Ma, W. D. Wang and S. H. Yu, J. Mater. Chem., 2011, 21, 4593–4597 RSC.
- Y. L. Chen, Z. A. Hu, Y. Q. Chang, H. W. Wang, Z. Y. Zhang, Y. Y. Yang and H. Y. Wu, J. Phys. Chem. C, 2011, 115, 2563–2571 CAS.
- S. Cui, S. Mao, Z. Wen, J. Chang, Y. Zhang and J. Chen, Analyst, 2013, 138, 2877–2882 RSC.
- J. Salamon, Y. Sathishkumar, K. Ramachandran, Y. S. Lee, D. J. Yoo, A. R. Kim and G. Gnana kumar, Biosens. Bioelectron., 2015, 64, 269–276 CrossRef CAS PubMed.
- V. K. Sharma, R. A. Yngard and Y. Lin, Adv. Colloid Interface Sci., 2009, 145, 83–96 CrossRef CAS PubMed.
- M. Rai, A. Yadav and A. Gade, Biotechnol. Adv., 2009, 27, 76–83 CrossRef CAS PubMed.
- C. Karuppiah, S. Palanisamy, S. M. Chen, R. Emmanuel, M. Ajmal Ali, P. Muthukrishnan, P. Prakash and F. M. A. Al-Hemaid, J. Solid State Electrochem., 2014, 18, 1847–1854 CrossRef CAS.
- R. Emmanuel, C. Karuppiah, S. M. Chen, S. Palanisamy, S. Padmavathy and P. Prakash, J. Hazard. Mater., 2014, 279, 117–124 CrossRef CAS PubMed.
- S. Palanisamy, S. M. Chen and R. Sarawathi, Sens. Actuators, B, 2012, 166–167, 372–377 CrossRef CAS PubMed.
- L. Lina, W. Wang, J. Huang, Q. Li, D. Sun, X. Yang, H. Wang, N. He and Y. Wang, Chem. J., 2010, 16, 852–858 Search PubMed.
- U. Schillinger and F. K. Lucke, Appl. Environ. Microbiol., 1989, 55, 1901–1906 CAS.
- A. Doss, V. Parivuguna, M. V. Santhi and S. Surendran, Indian J. Sci. Technol., 2011, 4, 550–552 Search PubMed.
- H. M. Mubarack, A. Doss, R. Dhanabalan and R. Venkataswamy, J. Anim. Vet. Adv., 2011, 10, 738–741 CrossRef.
- P. Li, J. Li, C. Wu, Q. Wu and J. Li, Nanotechnology, 2005, 16, 1912–1917 CrossRef CAS.
- P. I. Alade and O. N. Irobi, J. Ethnopharmacol., 1993, 39, 171–174 CrossRef CAS.
- V. G. Kumara, S. D. Gokavarapu, A. Rajeswari, T. S. Dhas, V. Karthick, Z. Kapadia, T. Shrestha, I. A. Barathy, A. Roy and S. Sinha, Colloids Surf., B, 2011, 87, 159–163 CrossRef PubMed.
- V. Wiskam, W. Fichtner, V. Kramb, A. Nintschew and J. S. Schneider, J. Chem. Educ., 1995, 722, 952–954 CrossRef.
- Y. P. Li, H. B. Cao, C. M. Liu and Y. Zhang, J. Hazard. Mater., 2007, 148, 158–163 CrossRef CAS PubMed.
- X. Zhou, C. Yuan, D. Qin, Z. Xue, Y. Wang, J. Du, L. Ma, L. Ma and X. Lu, Electrochim. Acta, 2014, 119, 243–250 CrossRef CAS PubMed.
- P. K. Rastogi, V. Ganesan and S. Krishnamoorthi, Electrochim. Acta, 2014, 147, 442–450 CrossRef CAS PubMed.
- M. Najafiz and M. Sadeghi, ECS Electrochem. Lett., 2013, 2, H5–H8 CrossRef PubMed.
- G. Kokkinidis and K. Juttner, Electrochim. Acta, 1981, 26, 971–977 CrossRef CAS.
- B. Qi, F. Lin, J. Bai, L. Liu and L. Guo, Mater. Lett., 2008, 62, 3670–3672 CrossRef CAS PubMed.
- L. Luo, X. Wang, Y. Ding, Q. Li, J. Ji and D. Deng, Anal. Methods, 2010, 2, 1095–1100 RSC.
- F. Liang, B. Liu, Y. Deng, S. Yang and C. Sun, Microchim. Acta, 2011, 174, 407–412 CrossRef CAS.
- Y. Zhang, L. Zeng, X. Bo, H. Wang and L. Guo, Anal. Chim. Acta, 2012, 752, 45–52 CrossRef CAS PubMed.
- Y. Zhang, X. Bo, A. Nsabimana, C. Luhana, G. Wang, H. Wang, M. Li and L. Guo, Biosens. Bioelectron., 2014, 53, 250–256 CrossRef CAS PubMed.
- Z. Xue, H. Lian, C. Hu, Y. Feng, F. Zhang, X. Liu and X. Lu, Aust. J. Chem., 2014, 67, 796–804 CrossRef CAS.
- P. K. Rastogi, V. Ganesan and S. Krishnamoorthi, Electrochim. Acta, 2014, 147, 442–450 CrossRef CAS PubMed.
Footnote |
| † Electronic supplementary information (ESI) available. See DOI: 10.1039/c5ra00992h |
| This journal is © The Royal Society of Chemistry 2015 |

