Facile synthesis of graphene sheets from fluorinated graphite
Li Chen*,
Jiaojiao Lei,
Fuhui Wang,
Guochao Wang and
Huixia Feng*
College of Petrochemical Technology, Lanzhou University of Technology, Lanzhou 730050, China. E-mail: chenli1981@163.com; fenghx@lut.cn; Tel: +86 931 7823127 Tel: +86 931 7823107
First published on 27th April 2015
Abstract
One of the problems with the chemical exfoliation of graphite to graphene via oxidation and reduction, is the excessive oxidation of graphite and incomplete reduction of graphene oxide, which introduce many defects and unnecessary oxygen-containing groups into the graphene sheets. Therefore, it is difficult to create high quality graphene sheets with few defects on a large scale by chemical exfoliation. Here, a simple and convenient method is developed to prepare graphene with a little fluorine by ultrasonicating fluorinated graphite in hydrazine hydrate. For comparison, reduced graphene oxide (RGO) was also prepared by Hummers method. The results showed that thin and flat graphene prepared from fluorinated graphite has a monocrystalline structure, while RGO presents turbostratic stacking. Moreover, the thermal stability and electrical conductivity of the as-prepared graphene sheets (GS) are much higher than those of the RGO sheets.
1. Introduction
Graphene, a one-atom-thick two-dimensional carbon material,1,2 has attracted much attention because of its extraordinary properties, such as electronic,3–5 thermal,6,7 lubricant,8–10 and mechanical properties.11 It has been used in transparent conductors,12 chemisensors and/or biosensors,13–15 with many potential and promising applications.16 As a basic building block for graphitic materials, including fullerenes, nanotubes, and graphite, graphene has been used to elucidate the properties of carbon-based materials.1 In addition, other graphene derivatives, such as graphene oxide (GO),16 nitrogen-doped graphene,17–19 boron-doped graphene,20 sulfur-doped graphene,21 and fluorinated graphene (FG),22 have provided an emerging research field to explore.Graphene has been studied for more than 70 years,23,24 however, graphene was first produced by mechanical exfoliation of graphite in 2004.25 Up to now, various methods including mechanical exfoliation of graphite,25 epitaxial growth,26–28 chemical vapor deposition (CVD),29–32 and chemical exfoliation33–35 have been developed to create graphene. Among these methods, CVD is considered a promising approach to produce large scale graphene layers with high quality. For example, orientation-controlled, single-layer graphene could be achieved over a Cu (111) film.29 Large area films of single- to few-layer graphene on polycrystalline Ni substrates have been reported.30,31 Graphene single crystals with dimensions of up to 0.5 mm on one side have been synthesized in copper-foil enclosures.32 Although large-area graphene, single- to few-layer graphene, and graphene single crystals could be obtained by CVD method, the quality and orientation of these materials were closely related to the crystal orientation of the substrates, CVD temperature, and growth time.
As a simple, convenient, and economical method, chemical exfoliation was often used to obtain graphene sheets on a large scale.33–36 This strategy begins with the oxidative exfoliation of graphite for creating GO, followed by the reduction of exfoliated GO. Various oxidation methods, such as Brodie, Staudenmaier, and Hummers methods have been used to produce graphite oxide.37 The obtained graphite oxide, consisting of two-dimensional oxidized graphene sheets, could be readily exfoliated into individual GO sheets. The GO is then reduced into graphene by means of chemical reduction or thermal annealing. This is an efficient method to obtain bulk-quantity graphene sheets at low cost. However, the process containing chemical oxidation and reduction will introduce impurities and disorders, which could severely impair the intrinsic electrical, thermal, and mechanical properties of graphene.13 So, precise control over the morphology and structure of graphene is a challenge with this approach.
To address the above challenges, we developed a facile route to create graphene sheets with high yield by simple processes. In this work, few-layered graphene is easily obtained by ultrasonicating fluorinated graphite (FGi) in hydrazine hydrate. With monocrystalline structure, the obtained graphene sheets demonstrated much higher conductivity and thermal stability compared to the reduced graphene oxide fabricated according to Hummer method.
2. Experimental
2.1. Materials
FGi (D50 = 3 μm, 62% fluorination), a whitish-grey compound having a composition of CF1.05, was provided by Sv Technology Co. Ltd. Natural graphite powder (100 mesh) was purchased from Qingdao Huatai Lubricant Sealing S&T Co. Ltd. Concentrated sulfuric acid (98%), potassium permanganate, sodium nitrate and hydrazine hydrate were purchased from Sinopharm Chemical Reagent Beijing Co. Ltd. FGi was pretreated by ethanol before use. All other chemicals were used as received. Milli-Q water (>18 MΩ) was used throughout all experiments.2.2. Synthesis of graphene sheets
In this experiment, the pretreated FGi (100 mg) was added to 50% hydrazine hydrate solution (100 mL). Ultrasonication was carried out at a power of 200 Watts in a sonic bath (SB-5200D, Ningbo Scientz Biotechnology Co., Ltd) for 20 h. FGi was chemically exfoliated by hydrazine hydrate under ultrasonication. The as-prepared graphene was centrifuged and washed with deionized water for several times, and then dried under vacuum. Graphene sheets prepared from FGi was obtained and designated as GS.For comparison, graphene sheets prepared by Hummers method,29 the most common one used, was also obtained. In this typical experiment, graphite powder (1.0 g) and NaNO3 (0.5 g) were mixed with concentrated H2SO4 (25 mL) in an ice bath. KMnO4 (3.0 g) was added slowly to the suspension with stirring and keep the reaction temperature lower than 10 °C. Then the above mixture was warmed to 35 °C and stirred for 4 h. After that, deionized water (50 mL) was added gradually with vigorous agitation. The reaction temperature rapidly increased and held the temperature at 98 °C for 15 min. Then, 30% H2O2 (10 mL) was added to the mixture, resulting in a brilliant yellow colour along with bubbling. After cooling to room temperature, the mixture was centrifuged and washed with 5% HCl and then deionized water for several times. Water-soluble graphene oxide (GO) was obtained. Then hydrazine hydrate was added to the suspension of GO and the temperature was maintained at 100 °C for 24 h. After thoroughly reduction of GO, reduced graphene oxide was centrifuged and washed with deionized water for several times, and then dried under vacuum.
2.3. Characterization
Fourier transform infrared (FTIR) spectra were recorded on a Nicolet AVTAR 360 FT-IR spectrometer. X-ray photoelectron spectroscopy (XPS) data were collected using a VG Scientific ESCALAB250-XPS photoelectron spectrometer with an Al Kα radiation. Raman measurements were performed on a JY-HR800 micro-Raman spectrometer at 532 nm. X-ray diffraction (XRD) patterns were recorded on a Rigaku B/Max-RB X-ray diffractometer with nickel-filtrated Cu Kα radiation. Transmission electron microscopy (TEM, Tecnai G2) was employed to observe the morphologies of the as-prepared graphene sheets. The samples were dispersed in ethanol and dropped onto holey carbon mesh grids (300 mesh) for observation. Atomic force microscopy (AFM) images were taken in non-contact mode with an AIST-NT Smart SPM. Graphene sheets deposited on silicon surfaces from dilute ethanol dispersions. Thermogravimetric analyses (TGA) were performed on a ZRT-B analyzer at a heating rate of 10 °C min−1 in the temperature range from room temperature to 800 °C under nitrogen atmosphere. The electric conductivity of the as-prepared RGO and GS sheets was evaluated using the standard four-point probe system (ST2253, Suzhou Jingge Electronic Co., Ltd. China) at ambient temperature.3. Results and discussion
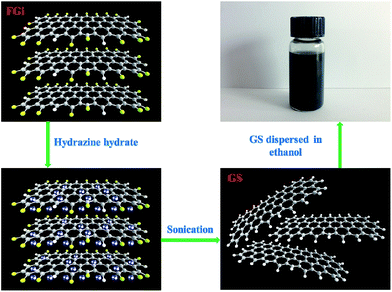
Unlike usual chemical exfoliation with oxidation and reduction procedures, the exfoliation procedure of fluorinated graphite to graphene sheets in this study was accomplished in one simple step. When FGi was added to hydrazine hydrate, FGi floated on the surface of solution because of the high hydrophobicity of FGi. The mixture of FGi and hydrazine hydrate was ultrasonicated, which made hydrazine molecules to diffuse into the interlayers of FGi. Chemical reaction occurred between hydrazine molecules and the carbon sheets in FGi because of the strong reducibility of hydrazine hydrate. Eventually, the carbon sheets of FGi were chemically exfoliated. The preparative processes are illustrated in Scheme 1.The morphologies and crystal structures of the as-prepared RGO and GS sheets were investigated by TEM observation. As shown in Fig. 1a, large and corrugated RGO sheets with thin layers are obtained. Graphene sheets prepared by Hummers method present lots of scrolling and agglomeration, which indicates that some small graphene monolayer or few-layer ones aggregated and formed the rather disordered sheets.38,39 The selected area electron diffraction (SAED) pattern (Fig. 1c) confirms the crystal structure of the graphene sheets obtained via chemical reduction of GO. The diffraction rings indicate that the obtained RGO presents turbostratic stacking, and similar results have also been found in other works.40 In contrast, graphene sheets prepared by the chemical exfoliation of FGi in hydrazine hydrate shows large, thin and flat sheets (Fig. 1b). The SAED pattern of GS sheets (Fig. 1d) displays the lattice space, which indicates that the obtained GS shows monocrystalline structure, more graphene intrinsic structure. That is to say, compared with RGO sheets, the thin flat graphene sheets with high quality could be obtained by chemical exfoliation of fluorinated graphite.
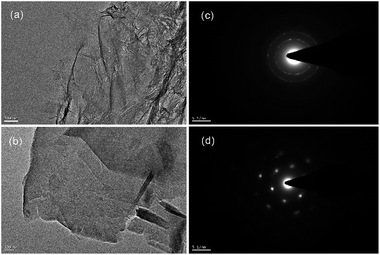 | ||
| Fig. 1 TEM images of (a) RGO and (b) GS, and selected area electron diffraction (SAED) pattern of (c) RGO and (d) GS. | ||
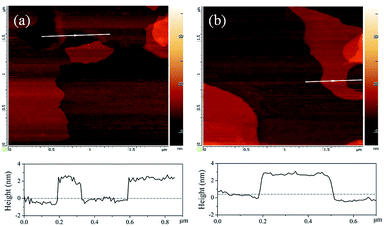
Fig. 2 shows AFM images of the as-prepared RGO and GS sheets. The samples were prepared by drop-casting of ethanol solution with dilute dispersed RGO and GS, respectively. Unfortunately, the casting led to few layers deposited on the silicon substrate aggregation. The cross-sectional views of the AFM images indicated that the average thickness of RGO sheets (Fig. 2a) was 2.3 nm, 2.5 nm for GS (Fig. 2b).
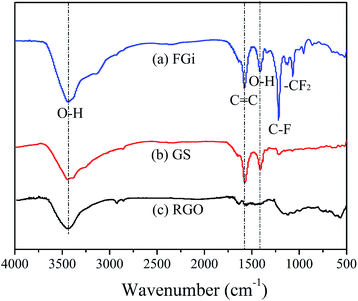
The FGi material and the as-prepared GS and RGO sheets were analysed by FTIR spectroscopy (KBr pellet method), as shown in Fig. 3. For FGi (Fig. 3a), the bands located at 3436 cm−1 and 1410 cm−1 can be assigned to the O–H stretching and deformation vibrations, respectively.41 The characteristic absorption of the C![[double bond, length as m-dash]](https://www.rsc.org/images/entities/char_e001.gif) C stretching vibration appears at 1578 cm−1. The strong peak at 1220 cm−1 is ascribed to the C–F stretching vibration of tertiary carbon atom.42,43 While the peak at 1068 cm−1 and the very weak absorption at 1342 cm−1 are regarded as the symmetric and asymmetric stretching vibrations, respectively, of the peripheral CF2 groups located at the edges of nanosized segments.43 After FGi was chemically exfoliated by hydrazine hydrate (Fig. 3b), the intensity of the C–F functional groups in GS sheets (located at 1220 cm−1) decreases dramatically. Meanwhile, the covalently bound CF2 groups (located at 1342 and 1068 cm−1) disappear completely. On the contrary, the intensity of the aromatic C
C stretching vibration appears at 1578 cm−1. The strong peak at 1220 cm−1 is ascribed to the C–F stretching vibration of tertiary carbon atom.42,43 While the peak at 1068 cm−1 and the very weak absorption at 1342 cm−1 are regarded as the symmetric and asymmetric stretching vibrations, respectively, of the peripheral CF2 groups located at the edges of nanosized segments.43 After FGi was chemically exfoliated by hydrazine hydrate (Fig. 3b), the intensity of the C–F functional groups in GS sheets (located at 1220 cm−1) decreases dramatically. Meanwhile, the covalently bound CF2 groups (located at 1342 and 1068 cm−1) disappear completely. On the contrary, the intensity of the aromatic C![[double bond, length as m-dash]](https://www.rsc.org/images/entities/char_e001.gif) C groups (at 1578 cm−1) increases, which indicates that the polyaromatic structures restore to some extent because of the decomposition of the C–F and CF2 groups. For comparison, the FTIR spectrum of RGO was also collected (Fig. 3c). The typical band at 3436 cm−1 indicates that there is a very small amount of moisture (OH). The peak located at about 1630 cm−1 ascribed to the C
C groups (at 1578 cm−1) increases, which indicates that the polyaromatic structures restore to some extent because of the decomposition of the C–F and CF2 groups. For comparison, the FTIR spectrum of RGO was also collected (Fig. 3c). The typical band at 3436 cm−1 indicates that there is a very small amount of moisture (OH). The peak located at about 1630 cm−1 ascribed to the C![[double bond, length as m-dash]](https://www.rsc.org/images/entities/char_e001.gif) C (ref. 44 and 45) is very weak for RGO compared to that of GS, meaning that the polyaromatic structure was damaged significantly in the case of RGO, while it retained more in GS. This agrees well with the results of the TEM observation.
C (ref. 44 and 45) is very weak for RGO compared to that of GS, meaning that the polyaromatic structure was damaged significantly in the case of RGO, while it retained more in GS. This agrees well with the results of the TEM observation.
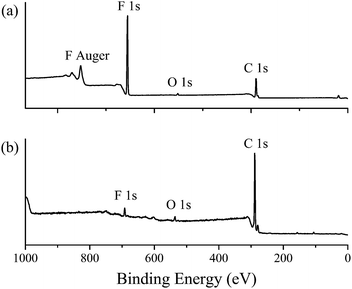
The elemental compositions and the amount of fluorine in FGi and GS materials were investigated via XPS. As shown in Fig. 4a, the peaks of fluorine (F 1s), carbon (C 1s), and oxygen (O 1s) are found in the full scan survey spectrum of FGi material. It is clear that the peak intensity of F 1s dramatically decreased in GS, while the peak intensity of C 1s increased significantly, indicating that FGi was chemically exfoliated into GS and fluorine was mostly removed. The atomic contents of carbon, fluorine and oxygen in FGi and GS materials calculated from the XPS spectra are summarized in Table 1.
| C (atom.%) | F (atom.%) | O (atom.%) | C/F | |
|---|---|---|---|---|
| FGi | 56.22 | 42.35 | 1.43 | 1.33 |
| GS | 89.62 | 6.94 | 3.44 | 12.91 |
Raman spectroscopy was employed to investigate the structures of pristine Gi, FGi, and the as-prepared GS and RGO for comparison (shown in Fig. 5a). The two most intense features, the G band at ∼1580 cm−1 and the 2D band at ∼2700 cm−1, were observed in graphite sample. In the spectrum of raw FGi, two very broad bands exist because of the highly fluorinated carbon. For graphene sheets, two first-order bands were observed: the D band at ∼1350 cm−1, which correspond to the vibrations of carbon atoms at defect sites; the G band at ∼1580 cm−1, which correspond to the vibrations of carbon atoms in the ideal graphitic lattice.45,46 In this work, it can be seen that RGO (Fig. 5b) exhibits a D band at 1347 cm−1 and a G band at 1589 cm−1, while the corresponding bands of GS (Fig. 5c) are 1342 and 1598 cm−1, respectively. In addition, the 2D and D + G bands were obviously observed in GS compared with that of RGO. In general, the defect content can be characterized by the ratio of the intensity of the D band to that of the G band, ID/IG.39 The ID/IG ratio of GS is 1.89, and the ID/IG ratio of RGO is 2.41. It indicates that GS has more ordered structure than RGO, in good agreement with the TEM results.
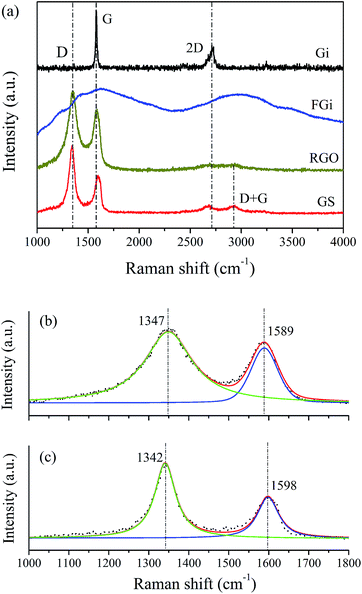 | ||
| Fig. 5 Raman spectra of (a) Gi, FGi, RGO, GS, and enlarged view of (b) RGO and (c) GS sheets showing the D and G bands. | ||
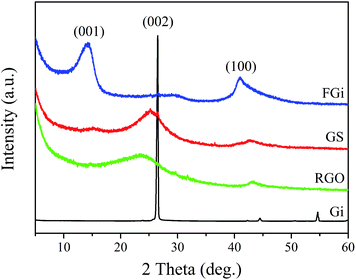
Fig. 6 shows the XRD patterns of the Gi, FGi materials, and the as-prepared RGO and GS sheets. The FGi material shows a peak at 14.1° with a d-spacing of 6.28 Å, which can be indexed as the (001) reflection in a hexagonal system, particularly for compounds with a very high fluorine level.47 The very weak and broad peak at around 27.6° can be assigned to the (002) reflection, confirming the existence of sp2 C in FGi and the sample is poorly ordered. The peak at around 41.0° assigned to the (100) reflection is associated with the C–C in-plane length in the reticular system.48,49 For GS, the intensity of (001) peak dramatically decreases, suggesting that fluorine was mostly removed from FGi. This agrees well with the results of the FTIR and XPS spectra. The (002) peak of GS has an obvious increase, indicating the successful chemical exfoliation of FGi. The original graphite displays a sharp (002) peak at 26.5° with the interlayer spacing of 3.36 Å. The RGO shows a weak and broad (002) diffraction peak at 23.7°, suggesting that the RGO made by Hummers method is poorly ordered along the stacking direction and composed of free graphene-like sheets.50 The (002) diffraction peak is very broad for RGO compared to that of GS, meaning that the polyaromatic structure was damaged significantly in the case of RGO, while it retained more in GS. This observation is in accordance with the results of the Raman spectra and TEM observation.
Fig. 7 shows the thermogravimetric analysis (TGA) curves for RGO and GS sheets. The curve of GS is distinctly different from that of RGO. As can be seen, RGO shows a relatively poor thermal stability. The mass loss (∼2 wt%) below 100 °C can be ascribed to the removal of adsorbed water. The pyrolysis of the labile oxygen-containing functional groups takes place over 180–300 °C.51,52 The RGO shows about 20 wt% loss up to around 400 °C. In contrast, the as-prepared GS exhibits good thermal stability. The mass loss occurs at about 300 °C, and there is only 5 wt% loss up to 400 °C. Thus, the as-prepared GS possesses better thermal stability than RGO sheets.
Graphene has extraordinary electronic properties because of the long-range π-conjugation structure of sp2-hybridized carbon. Compared with graphene, FGi is a kind of typical insulation material. So the electric conductivity measurements, as a simple and convenient method, are employed to monitor the degrees of chemical exfoliation of FGi. The pristine FGi, a whitish-grey CFX compound having an F/C ratio of 1.05, is not conduct electricity. During the chemical exfoliation of FGi using hydrazine hydrate, the carbon sheets in FGi were reduced and recover the crystalline structure. And as a result, the electric conductivity of the product, graphene, is enhanced. The as-prepared GS exhibits a high electric conductivity of 1003 S m−1. For comparison, the electric conductivity of RGO was also tested to be 537 S m−1. It implies that graphene sheets prepared from FGi may possess more repaired polyaromatic structure than that made by the widely used Hummers method, resulting in significantly enhanced electric conductivity. This agrees well with the results of TEM observations (Fig. 1), in which GS presents thin flat sheets with high quality. This result is also confirmed by Raman measurements (Fig. 5), in which GS shows the high ability for repairing the hexagonal network of carbon atom.
4. Conclusions
In summary, a simple and convenient method for the preparation of GS is presented. This approach produces high quality graphene sheets by ultrasonicating fluorinated graphite in hydrazine hydrate solution. The large, thin and flat GS sheets display monocrystalline structure, which lead to much higher thermal stability and electric conductivity than RGO sheets. This work will provide a simple way to create high quality graphene sheets, which holds great promise for applications in many potential fields, including nanoelectronics, transistors, emissive displays, nanocomposites, ultrasensitive chemical detectors, and so on.Acknowledgements
The authors gratefully acknowledge the National Natural Science Foundation of China (Grant no. 51405212), Natural Science Foundation of Gansu Province, China (Grant no. 1112RJZA035), and the Hongliu Young Teacher Cultivate Project of Lanzhou University of Technology (Grant no. Q201405) for financial support.Notes and references
- A. K. Geim and K. S. Novoselov, Nat. Mater., 2007, 6, 183 CrossRef CAS PubMed.
- C. N. R. Rao, A. K. Sood, K. S. Subrahmanyam and A. Govindaraj, Angew. Chem., Int. Ed., 2009, 48, 7752 CrossRef CAS PubMed.
- C. Gómez-Navarro, R. T. Weitz, A. M. Bittner, M. Scolari, A. Mews, M. Burghard and K. Kern, Nano Lett., 2007, 7, 3499 CrossRef PubMed.
- H. B. Heersche, P. Jarillo-Herrero, J. B. Oostinga, L. M. K. Vandersypen and A. F. Morpurgo, Nature, 2007, 446, 56 CrossRef CAS PubMed.
- V. Y. Aristov, G. Urbanik, K. Kummer, D. V. Vyalikh, O. V. Molodtsova, A. B. Preobrajenski, A. A. Zakharov, C. Hess, T. Hänke, B. Büchner, I. Vobornik, J. Fujii, G. Panaccione, Y. A. Ossipyan and M. Knupfer, Nano Lett., 2010, 10, 992 CrossRef CAS PubMed.
- A. A. Balandin, S. Ghosh, W. Bao, I. Calizo, D. Teweldebrhan, F. Miao and C. N. Lau, Nano Lett., 2008, 8, 902 CrossRef CAS PubMed.
- E. Pop, V. Varshney and A. K. Roy, MRS Bull., 2012, 37, 1273 CrossRef CAS.
- O. Penkov, H.-J. Kim, H.-J. Kim and D.-E. Kim, Int. J. Precis. Eng. Man., 2014, 15, 577 CrossRef PubMed.
- D. Berman, A. Erdemir and A. V. Sumant, Mater. Today, 2014, 17, 31 CrossRef CAS PubMed.
- H. E. N'guessan, A. Leh, P. Cox, P. Bahadur, R. Tadmor, P. Patra, R. Vajtai, P. M. Ajayan and P. Wasnik, Nat. Commun., 2012, 3, 1242 CrossRef PubMed.
- C. Lee, X. Wei, J. W. Kysar and J. Hone, Science, 2008, 321, 385 CrossRef CAS PubMed.
- S. Watcharotone, D. A. Dikin, S. Stankovich, R. Piner, I. Jung, G. H. B. Dommett, G. Evmenenko, S.-E. Wu, S.-F. Chen, C.-P. Liu, S. T. Nguyen and R. S. Ruoff, Nano Lett., 2007, 7, 1888 CrossRef CAS PubMed.
- H. Jiang, Small, 2011, 7, 2413 CAS.
- P. Li, X. Chen and W. Yang, Langmuir, 2013, 29, 8629 CrossRef CAS PubMed.
- R. Yue, Q. Lu and Y. Zhou, Biosens. Bioelectron., 2011, 26, 4436 CrossRef CAS PubMed.
- Y. Zhu, S. Murali, W. Cai, X. Li, J. W. Suk, J. R. Potts and R. S. Ruoff, Adv. Mater., 2010, 22, 3906 CrossRef CAS PubMed.
- D. Wei, Y. Liu, Y. Wang, H. Zhang, L. Huang and G. Yu, Nano Lett., 2009, 9, 1752 CrossRef CAS PubMed.
- Y. Wang, Y. Shao, D. W. Matson, J. Li and Y. Lin, ACS Nano, 2010, 4, 1790 CrossRef CAS PubMed.
- S.-M. Li, S.-Y. Yang, Y.-S. Wang, C.-H. Lien, H.-W. Tien, S.-T. Hsiao, W.-H. Liao, H.-P. Tsai, C.-L. Chang, C.-C. M. Ma and C.-C. Hu, Carbon, 2013, 59, 418 CrossRef CAS PubMed.
- Y. A. Kim, K. Fujisawa, H. Muramatsu, T. Hayashi, M. Endo, T. Fujimori, K. Kaneko, M. Terrones, J. Behrends, A. Eckmann, C. Casiraghi, K. S. Novoselov, R. Saito and M. S. Dresselhaus, ACS Nano, 2012, 6, 6293 CrossRef CAS PubMed.
- Z. Yang, Z. Yao, G. Li, G. Fang, H. Nie, Z. Liu, X. Zhou, X. Chen and S. Huang, ACS Nano, 2012, 6, 205 CrossRef CAS PubMed.
- J. T. Robinson, J. S. Burgess, C. E. Junkermeier, S. C. Badescu, T. L. Reinecke, F. K. Perkins, M. K. Zalalutdniov, J. W. Baldwin, J. C. Culbertson, P. E. Sheehan and E. S. Snow, Nano Lett., 2010, 10, 3001 CrossRef CAS PubMed.
- P. R. Wallace, Phys. Rev., 1947, 71, 622 CrossRef CAS.
- J. C. Slonczewski and P. R. Weiss, Phys. Rev., 1958, 109, 272 CrossRef CAS.
- K. S. Novoselov, A. K. Geim, S. V. Morozov, D. Jiang, Y. Zhang, S. V. Dubonos, I. V. Grigorieva and A. A. Firsov, Science, 2004, 306, 666 CrossRef CAS PubMed.
- J. Hass, W. A. de Heer and E. H. Conrad, J. Phys.: Condens. Matter, 2008, 20, 323202 CrossRef.
- K. V. Emtsev, F. Speck, Th. Seyller, L. Ley and J. D. Riley, Phys. Rev. B: Condens. Matter Mater. Phys., 2008, 77, 155303 CrossRef.
- M. Gao, Y. Pan, L. Huang, H. Hu, L. Z. Zhang, H. M. Guo, S. X. Du and H.-J. Gao, Appl. Phys. Lett., 2011, 98, 033101 CrossRef PubMed.
- B. Hu, H. Ago, Y. Ito, K. Kawahara, M. Tsuji, E. Magome, K. Sumitani, N. Mizuta, K.-I. Ikeda and S. Mizuno, Carbon, 2012, 50, 57 CrossRef CAS PubMed.
- S. J. Chae, F. Güneş, K. K. Kim, E. S. Kim, G. H. Han, S. M. Kim, H.-J. Shin, S.-M. Yoon, J.-Y. Choi, M. H. Park, C. W. Yang, D. Pribat and Y. H. Lee, Adv. Mater., 2009, 21, 2328 CrossRef CAS PubMed.
- A. Reina, X. Jia, J. Ho, D. Nezich, H. Son, V. Bulovic, M. S. Dresselhaus and J. Kong, Nano Lett., 2009, 9, 30 CrossRef CAS PubMed.
- X. Li, C. W. Magnuson, A. Venugopal, R. M. Tromp, J. B. Hannon, E. M. Vogel, L. Colombo and R. S. Ruoff, J. Am. Chem. Soc., 2011, 133, 2816 CrossRef CAS PubMed.
- M. Cai, D. Thorpe, D. H. Adamson and H. C. Schniepp, J. Mater. Chem., 2012, 22, 24992 RSC.
- B. Luo, S. Liu and L. Zhi, Small, 2012, 8, 630 CrossRef CAS PubMed.
- L. Zhang, X. Li, Y. Huang, Y. Ma, X. Wan and Y. Chen, Carbon, 2010, 48, 2367 CrossRef CAS PubMed.
- O. C. Compton and S. T. Nguyen, Small, 2010, 6, 711 CrossRef CAS PubMed.
- S. Park and R. S. Ruoff, Nat. Nanotechnol., 2009, 4, 217 CrossRef CAS PubMed.
- M. Lotya, Y. Hernandez, P. J. King, R. J. Smith, V. Nicolosi, L. S. Karlsson, F. M. Blighe, S. De, Z. Wang, I. T. McGovern, G. S. Duesberg and J. N. Coleman, J. Am. Chem. Soc., 2009, 131, 3611 CrossRef CAS PubMed.
- A. O'Neill, U. Khan, P. N. Nirmalraj, J. Boland and J. N. Coleman, J. Phys. Chem. C, 2011, 115, 5422 Search PubMed.
- W. Zhang, W. He and X. Jing, J. Phys. Chem. B, 2010, 114, 10368 CrossRef CAS PubMed.
- P. Gong, Z. Wang, J. Wang, H. Wang, Z. Li, Z. Fan, Y. Xu, X. Han and S. Yang, J. Mater. Chem., 2012, 22, 16950 RSC.
- Y. S. Lee, T. H. Cho, B. K. Lee, J. S. Rho, K. H. An and Y. H. Lee, J. Fluorine Chem., 2003, 120, 99 CrossRef CAS.
- Y. Kita, N. Watanabe and Y. Fujii, J. Am. Chem. Soc., 1979, 101, 3832 CrossRef CAS.
- S. Stankovich, D. A. Dikin, R. D. Piner, K. A. Kohlhaas, A. Kleinhammes, Y. Jia, Y. Wu, S. T. Nguyen and R. S. Ruoff, Carbon, 2007, 45, 1558 CrossRef CAS PubMed.
- A. Sadezky, H. Muckenhuber, H. Grothe, R. Niessner and U. Pöschl, Carbon, 2005, 43, 1731 CrossRef CAS PubMed.
- J. Gao, F. Liu, Y. Liu, N. Ma, Z. Wang and X. Zhang, Chem. Mater., 2010, 22, 2213 CrossRef CAS.
- K. Guérin, J. P. Pinheiro, M. Dubois, Z. Fawal, F. Masin, R. Yazami and A. Hamwi, Chem. Mater., 2004, 16, 1786 CrossRef.
- S. Mouras, A. Hamm, D. Djurado and J. C. Cousseins, Rev. Chim. Miner., 1987, 24, 572 Search PubMed.
- Z. Wang, J. Wang, Z. Li, P. Gong, J. Ren, H. Wang, X. Han and S. Yang, RSC Adv., 2012, 2, 11681 RSC.
- C. Nethravathi and M. Rajamathi, Carbon, 2008, 46, 1994 CrossRef CAS PubMed.
- S. Wang, D. Yu, L. Dai, D. W. Chang and J.-B. Baek, ACS Nano, 2011, 5, 6202 CrossRef CAS PubMed.
- S.-Z. Zu and B.-H. Han, J. Phys. Chem. C, 2009, 113, 13651 CAS.
| This journal is © The Royal Society of Chemistry 2015 |

