Santosh Kumar Srivastava and
Vipin Bahadur Singh*
Department of Physics, Udai Pratap Autonomous College, Varanasi 221002, India. E-mail: vipinwp_vns@rediffmail.com
First published on 11th March 2015
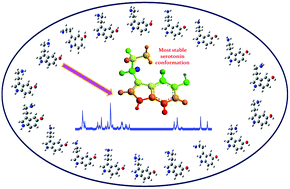
The conformational landscapes of neutral serotonin and its hydrated complex were characterized by MP2, CC2 and DFT methods. The ground state geometry optimization of the twenty three lowest energy structures of serotonin have been performed employing higher basis sets. The MP2, CC2 and DFT (M06-2X, ωB97X-D and B3LYP-D3) calculations predict that the Gph-out/anti conformation of serotonin is the most stable which is in agreement with the experimental rotational spectroscopy (Cabezas et al., Phys. Chem. Chem. Phys., 2012, 14, 13618) and is in contrast to the resonance-enhanced two photon ionization (R2PI) and UV–UV hole burning (UVHB) spectroscopy results. Computed wave-numbers and intensities of the observed conformers are found in consonance with the experiment (LeGreve et al., J. Am. Chem. Soc., 2007, 129, 4028). The predicted intensity of the OH bending fundamental provides a useful diagnostic for the 5-OH anti and syn conformations. The computed hydrogen bond geometries of the experimentally observed Sero1–(H2O)1 and Sero1–(H2O)2 clusters are found in remarkable agreement with the experiment. The Sero1–(H2O)2 involving the Gph(out) conformation is used to form a strong water dimer bridge to the 5-OH with a binding energy of 104 kJ mol−1. The low-lying excited states of each experimentally observed conformer of serotonin have been determined by means of coupled cluster singles and approximate doubles (CC2) and TDDFT methods and a satisfactory interpretation of the electronic absorption spectra is obtained. One striking feature is the coexistence of the blue and red shift of the vertical excitation energies of the 1Lb (ππ*) and the 1La (ππ*) state upon forming a complex with water. The effect of hydration on the lowest 1Lb (ππ*) excited state due to the bulk water environment was mimicked by a combination of a polarizable continuum solvent model (PCM) and conductor like screening model (COSMO), for the different serotonin conformations which shows a red shift. The lowest excited state (1Lb) of the most stable Sero1–(H2O)1 structure shows a significant shift of 1.15 Å for a water molecule towards the 5-OH group due to the S0–S1 electronic excitation.
Serotonin (see Fig. 1) can exist in various forms, differing from each other by the arrangements of the ethylamine side chain and hydroxyl group. The conformational flexibility of ethylamine neurotransmitters, mainly arising from facile rotations around the C–N and the two C–C bonds (C(α)–C(β) and C(β)–C(γ) bonds, shown in Fig. 1) of the ethylamine side chain, is expected to be highly relevant for the drug–receptor interaction and molecular recognition.7,14 The flexible ethyl amino side chain of serotonin gives rise to 27 conformers from rotations about the single C–N and the two C–C bonds. Of these twenty seven conformers the nine conformers were supposed to have considerably lower energies than the remaining 18 ones. A short-hand notation for the serotonin isomers, are earlier reported5 in the following way. The amino group can reside in any of three positions, gauche on the phenyl side (Gph), gauche on the pyrrole side (Gpy) and Anti. The orientation of the amino group is labeled by the direction of the lone pair of electrons relative to the indole plane, indicated with “out” or “up” and by “ph”, “py” or “up” for the anti species. Syn (toward) or anti (away from) indexes are employed to denote the two different orientations of the OH group relative to indole NH. Neutral serotonin has been investigated theoretically by van Mourik and Emson,11 they reported 23 low energy isomers for serotonin within 11 kJ mol−1 at the B3LYP/6-31+G(d) level. This includes the full set of 18 lowest energy structures, nine syn plus nine anti. They predict that, in every case, the anti configuration for the 5-OH group is lower in energy than its syn counterpart. However, Table 1 of van Mourik and Emson11 shows a number of inconsistent results, in which syn configuration is noted as lower in energy than its anti counterpart. The calculations also predict that the Gpy(out) conformer which is the global minimum in tryptamine retains that status in serotonin as well.11 Bayari et al.16 and few other researchers17–19 presented FT-IR spectra of serotonin in KBr films as well as in aqueous solution. However, these spectra display low resolution and it is unclear at present whether they correspond to the neutral or the protonated form. The earlier vibrational analysis18 seems to be incomplete and ambiguous. Electronic absorption spectra and the singlet excited states of serotonin and its protonated form were studied by Kishi et al.20
S. no. | Description of the ethylamine side chain | Tryptamine,b MP2/6-311++G(d,p) | Serotonin, MP2/6-311++G(d,p) | Serotonin, MP2/aug-cc-pVDZ | ||
---|---|---|---|---|---|---|
anti-5-OH | syn-5-OH | anti-5-OH | syn-5-OH | |||
a Zero-point corrections use the DFT B3LYP/6-311++G(d,p) and aug-cc-pVDZ harmonic frequencies respectively.b From ref. 45.c From ref. 11. | ||||||
1 | Gph(out) | 1.63 | 0.00 (3.5547) | 4.49 (3.9880) | 0.00 (3.4172) | 3.73 (3.9979) |
2 | Gpy(out) | 0.00 | 0.10 (1.4270) | 1.47 (2.8797) | 0.48 (1.3292) | 1.95 (2.8762) |
3 | Gpy(up) | 1.50 | 1.12 (3.1864) | 2.91 (4.2897) | 2.73 (3.1398) | 4.36 (3.9313) |
4 | Gph(up) | 3.64 | 4.22 (2.7530) | 5.77 (3.8973) | 4.84 (2.7505) | 5.86 (3.7228) |
5 | Anti(ph) | 5.68 | 5.51 (3.5572) | 8.32 (3.9954) | 6.80 (3.4409) | 8.86 (3.9532) |
6 | Anti(py) | 5.77 | 6.27 (1.4570) | 7.53 (2.8894) | 7.58 (1.4012) | 8.61 (2.8561) |
7 | Anti(up) | 5.98 | 6.31 (3.1457) | 7.85 (4.0994) | 7.51 (3.0790) | 8.78 (3.7923) |
8 | Gpy(in) | 8.28 | 9.14 (3.5410) | 10.60 (2.5610) | 9.95 (3.5410) | 11.22 (2.5610) |
9 | Gph(in) | 13.04 | 11.21 (3.7612) | 14.25 (2.5228) | 12.61 (3.7612) | 14.71 (2.5228) |
10 | Conf. 9c | — | 11.99 (1.1419) | 13.45 (2.9182) | — | — |
11 | Conf. 10c | — | 4.20 (2.7525) | 5.77 (3.8963) | — | — |
12 | Conf. 11c | — | 12.38 (3.1694) | 14.11 (3.5774) | — | — |
Spectroscopic signatures of isolated bio-molecules and their hydrated clusters may provide insight on their preferred conformations, dynamical flexibility, and inter- and intra-molecular interactions determining their skeletal structures. Therefore, it is a great challenge to measure the spectral signatures and consequently to extract the contributions of the conformational isomers, while assigning them to specific structures. The conformational preferences of the isolated serotonin molecule have been elucidated in supersonic jets by LeGreve et al.5,12 using a variety of spectroscopic techniques, including laser induced fluorescence, resonance-enhanced two photon ionization (R2PI), UV–UV hole burning and resonant ion-dip infrared spectroscopy etc. Spectral signatures due to eight low-energy conformers were observed and assigned by comparing to its close analogue tryptamine.5,21 The conformation-specific study of 5-HT at B3LYP/6-31+G(d) and MP2/6-31+G(d) levels showed that, there are at least eighteen possible conformational isomers.5 The eight experimentally observed conformers split into two groups depending on the orientation of the 5-hydroxy group, either anti (theta = 180) or syn (theta = 0) relative to indole NH.5 The five anti-OH origins are seen to the blue (higher wavenumber) of the three syn-OH origins. Zwier and coworkers5 assigned the observed serotonin conformers as A, B, C, D, E, F, G and H which were linked to Gpy(out)/anti, Gpy(up)/anti, Gph(out)/anti, Anti(py)/anti, Anti(up)/anti, Gpy(out)/syn, Gpy(up)/syn, and Gph(out)/syn respectively. The ultraviolet spectrum5 divides into two subsets due to the two distinct OH orientations, syn and anti. Within each subset, the Gpy(out), Gpy(up), and Gph(out) conformations dominate. The most intense transition was observed in serotonin conformer A, which has a Gpy(out) ethylamine side chain conformation, the same conformation that is global minimum in tryptamine.5,12,21 In this structure, the amino group is in the gauche position on the pyrrole side of indole, with the NH2 lone pair oriented out away from the ring. The most dramatic change induced by the 5-OH substitution is the selective stabilization of the Gph(out)/anti conformation relative to all others. This stabilization has its most likely cause in electronic effects transmitted through the fused-ring system to the ethylamine side chain. However LeGreve et al.5 explained that MP2 calculation seems to overestimate the stabilization in Gph(out)/anti relative to the experiment as found in the case of tryptamine and followed DFT results for comparison with experiment.5 They have concluded that the most stable conformer is Gpy(out)/anti followed by Gph(out)/anti and Gpy(up)/anti. Recently, microwave spectra of Cabezas et al.2 have provided very accurate ground state rotational constants of the most highly populated conformers of serotonin. In the rotational spectrum of serotonin2 three lowest energy conformers, Gph(out)/anti, Gpy(out)/anti and Gpy(up)/anti, have been detected and characterized. In this study2 the Gph(out)/anti conformer was found to be most abundant and with the help of computed MP2 energies it was concluded that in serotonin the most stable conformer is Gph(out)/anti, followed by Gpy(out)/anti Gpy(up)/anti. The stabilization of Gph(out)/anti conformer attributed to an electronic effect associated specifically with the anti OH orientation, which does not occur for the Gpy(out)/anti nor for others.
For tryptamine and serotonin, characterized by an ethylamine group attached to an aromatic system, the N–H⋯π weak hydrogen bond is one of the leading structural motifs stabilizing the structure as pointed out in previous studies.2,5,11 These weakly polar intra-molecular interactions are forces which drive conformational preferences in serotonin. Cabezas et al.2 have expressed the need of a high level ab initio computations for the extensive study of serotonin conformation.
Because serotonin carries out its biological functions in aqueous solution, it is also important to understand how the conformational preferences of serotonin changes in the presence of water molecules. Many of the receptor sites for serotonin in which the NH2 group may be neutral in aqueous solution.9 Despite the nonpolar environment, water molecules are likely to be present in these binding pockets and may play a role in the way in which 5-HT interacts with the receptor. Spectroscopic signatures of Sero1–(H2O)1,2 clusters have been also experimentally performed22 using the same conformation-specific methods already employed on the monomer.5 Since serotonin has both H-bond donor group (the 5-OH) and H-bond acceptor (NH2) group, spatially separated from one another, the water molecules can form H-bonded bridges that link these groups in serotonin,22 as in proteins.23
Unfortunately, the few available theoretical studies on the lowest energy conformers of serotonin lack a real description of the nature and amplitude of the intramolecular interactions that influence the conformational stability of serotonin. The main reason comes from the small basis sets used in the calculation to describe weak non bonded interactions that need extended basis set to describe conformational preferences in 5-HT more precisely. Assignment of the experimental spectra, depends crucially on comparison with spectra computed using high level quantum chemical techniques, and the increasing size of molecules can be studied accurately with ab initio and density functional theory methods.24–36 In quantum mechanical computations, a high degree of electron correlation must be included to reliably account for dispersion interaction. Second order Moller–Plesset perturbation theory method (MP2)24–26 offers a better approach for describing non-covalent interactions since it can be extended to much larger systems. Second order Moller–Plesset perturbation theory (MP2) (ref. 24), second order approximate coupled cluster (CC2)26,27 and density functional theory (DFT)28–36 methods implemented in Gaussian25 & TURBOMOLE26 quantum chemical software's, provide important insights into the energetic, ground state structures and photochemistry of these systems. The goal of the present study is thus to characterize the most of the stable structural motifs of serotonin and its experimentally observed hydrated complexes. Furthermore, we will investigate the IR spectra and low-lying excited states of the eight experimentally observed serotonin. Our calculations have aided the interpretation of IR spectra more systematically and many previous incomplete and ambiguous assignments have been analyzed and amended. The application of DFT to non-covalently bound complexes has been limited due to the failure of most density functional approximation, in many case, to describe dispersion interaction. However, several approaches exist for improving existing density functionals to handle dispersion effects. In this paper, we also report a comparative study of the accuracy of the B3LYP,28–30 B3PW91,28–31 and X3LYP28,29,32 density functionals and newly developed M05, M06,M05-2X M06-2X34–36 and dispersion corrected ωb97X-D,33 and DFT-D3 functionals26,37 to predict the energy and/or binding energy of serotonin and its hydrated complex. The electronic absorption spectra was investigated and assigned by using the second order approximate coupled cluster (CC2)27 and the Time Dependent Density Functional Theory (TD-DFT) calculations38 for the vertical electronic excitation energies of serotonin. The effect of hydration on the lowest singlet ππ* excited-state of serotonin is investigated.
Theoretical methods described above were applied to a molecular geometry without symmetry restrictions. The calculated geometry with C1 symmetry was very close to that with Cs symmetry. All optimized structures have been verified as minima by performing frequency calculations, in order to ensure that no imaginary frequency were present. Harmonic wave numbers calculated at the B3LYP/6-311++G(d,p), B3LYP/6-311++G(2d,2p), B3LYP/aug-cc-pVDZ levels of theory have been found to give good agreement with experiment. However the fundamental frequencies calculated by DFT method with B3LYP parameterization using the MP2 optimized geometries are significantly more close to experiment than those produced by using the DFT optimized geometries. We used mainly the scaling factor 0.977 and 0.988 for the OH and the NH/CH fundamentals respectively to scale down the vibrational frequencies of monomer, however in the alkyl CH stretching region and below there is no need of scaling.
The CC2 method is an approximation to the coupled cluster singles and doubles (ccsd) method where single equations are retained in the original form and the double equations are truncated to the first order in the fluctuating potential.27 The X3LYP28–31 (extended hybrid functional with Lee–Yang–Parr correlation functional30) extended functional for density functional theory was developed to significantly improve the accuracy for hydrogen bonded and van der Waals complexes. The M05, M06, M05-2X and M06-2X34–36 are newly developed standard hybrid DFT functionals with parameters optimized on training sets of benchmark interaction energies. According to Zhao and Truhlar,34 the M06 series of functionals represent a significant step forward in density functionals, implicitly account for ‘medium-range’ electron correlation, which is sufficient to describe the dispersion interaction within many complexes. Recently, Andrew et al.37 have examined the performance of a variety of DFT procedures for the calculation of complexation energies, paying special attention to the M05-type and M06-type functionals. The mean deviation obtained with M05-type and M06 type functionals become more negative with an increasing amount of Hartree–Fock exchange, in contrast to the behavior of typical DFT methods.37 It was reported37 that the M05-type and M06 type functionals are generally accurate and robust and the performance generally improves in order M05 → M06 → M05-2X → M06-2X. The M06-2X has mean absolute deviation values that are quite small and comparable to those for other procedure PW6-B95.37
TD-DFT method39 employing B3LYP28,29 functional with 6-311++G(d,p) and aug-cc-pVDZ basis sets was used at corresponding (MP2/aug-cc-pvdz) ground state optimized geometries to predict the electronic absorption wavelengths of the eight experimentally observed conformers of neutral serotonin. RI-CC2 (ref. 26 and 27) implementation in TURBOMOLE V6.4,26 employing the basis set TZVP is also used to compute the vertical electronic absorption wavelengths. The effect due to the so-called bulk water molecules was taken into account within the polarizable continuum model (PCM)40–42 and the conductor like screening model (COSMO)43 framework. The electronic absorption spectra in aqueous solution have been calculated by employing the B3LYP hybrid exchange correlation functionals, using the PCM and COSMO continuum solvent models.40–43 Binding energies (ΔEStab) of the serotonin–water complexes have been calculated as follows:
ΔEStab = EComplex − (Eserotonin + EWater) |
The calculated binding energy of serotonin1–(water)1 complexes is corrected for the basis set superposition error (BSSE), using the counterpoise method of Boys and Bernardi.44
S. no. | Description of the ethylamine side chain | Tryptamine,a B3LYP/6-311++G(d,p) | Serotonin, B3LYP/6-311++G(d,p) | Serotonin, B3LYP/aug-cc-pVDZ | ||
---|---|---|---|---|---|---|
anti-5-OH | syn-5-OH | anti-5-OH | syn-5-OH | |||
a From ref. 45.b From ref. 11. | ||||||
1 | Gph(out) | 2.38 | 1.07 (3.2219) | 4.07 (3.7671) | 1.03 (3.0694) | 3.67 (3.6118) |
2 | Gpy(out) | 0.00 | 0.00 (1.2503) | 0.76 (2.7944) | 0.00 (1.2191) | 0.70 (2.6650) |
3 | Gpy(up) | 0.88 | 0.57 (2.9144) | 1.49 (3.8737) | 0.77 (2.7854) | 1.60 (3.6585) |
4 | Gph(up) | 3.55 | 3.56 (2.4814) | 3.97 (3.6515) | 3.84 (2.4160) | 4.17 (3.4901) |
5 | Anti(ph) | 2.63 | 1.60 (3.2526) | 2.84 (3.7773) | 1.05 (3.1181) | 2.33 (3.6081) |
6 | Anti(py) | 2.63 | 2.21 (1.3352) | 2.55 (2.7712) | 1.76 (1.2749) | 2.11 (2.6138) |
7 | Anti(up) | 2.34 | 1.51 (2.8270) | 2.13 (3.6515) | 1.35 (2.7072) | 2.01 (3.4670) |
8 | Gpy(in) | 4.89 | 5.11 (3.2144) | 5.37 (2.2588) | 4.53 (3.0299) | 5.05 (2.1336) |
9 | Gph(in) | 10.62 | 8.37 (3.4308) | 11.22 (2.4161) | 8.51 (3.2628) | 10.68 (2.2810) |
10 | Conf. 9b | — | 4.22 (0.9963) | 4.63 (2.7356) | 3.23 (0.9674) | 3.99 (2.5717) |
11 | Conf. 10b | — | 5.39 (1.1272) | 3.96 (3.6512) | 4.78 (0.9475) | 4.17 (3.4900) |
12 | Conf. 11b | — | 4.65 (3.2005) | 5.38 (3.6449) | 3.28 (3.0464) | 4.31 (3.4675) |
Conformer | ECCSDrelb | EMP2![]() ![]() |
EM06-2Xrel | EM05-2Xrel | EωB97X-D![]() ![]() |
EM06![]() ![]() |
EX3LYP![]() ![]() |
EB3LYP-D3relc | EB3LYP![]() ![]() |
EB3PW91![]() ![]() |
ETPSSh![]() ![]() |
ECC2relc |
---|---|---|---|---|---|---|---|---|---|---|---|---|
a Zero-point corrected energies at the MP2, M06-2X, M05-2X, ωB97X-D, M06, X3LYP, B3LYP, B3PW91 and TPSSh optimized geometries as well as for CCSD single-point energies were obtained by including the zero-point corrections from B3LYP/aug-cc-pVDZ and the CC2 and B3LYP-D3 optimized geometries were corrected from DFT B3LYP/def-TZVP harmonic frequencies.b Single-point energy calculation with basis set 6-31+G(d).c Optimized using the basis set def-TZVP. | ||||||||||||
A | 1.58 (1.3828) | 0.48 (1.3292) | 1.00 (1.1703) | 0.13 (1.1853) | 0.23 (1.1134) | 0.00 (1.1449) | 0.00 (1.2174) | 0.72 (1.2230) | 0.00 (1.2191) | 0.00 (1.1963) | 0.00 (1.1967) | 0.81 |
B | 3.26 (3.3745) | 2.73 (3.1398) | 2.33 (2.8046) | 1.31 (2.8565) | 0.57 (2.7993) | 1.21 (2.6799) | 0.87 (2.7929) | 0.77 (2.7854) | 0.41 (2.7545) | 0.46 (2.7693) | 1.62 | |
C | 0.00 (3.6153) | 0.00 (3.4172) | 0.00 (3.0793) | 0.00 (3.1865) | 0.00 (3.0695) | 0.36 (2.9575) | 0.83 (3.0659) | 0.00 (3.1533) | 1.03 (3.0694) | 1.14 (3.0445) | 0.92 (3.0897) | 0.00 |
D | 9.52 (1.4006) | 7.58 (1.4012) | 6.09 (1.1898) | 5.09 (1.2560) | 4.68 (1.1721) | 4.10 (1.1323) | 1.99 (1.2673) | 1.76 (1.2749) | 2.30 (1.2482) | 2.76 (1.2654) | 9.38 | |
E | 7.45 (3.2999) | 7.51 (3.0790) | 5.88 (2.7939) | 4.74 (2.8431) | 4.00 (2.7595) | 4.37 (2.6568) | 1.63 (2.7250) | 1.35 (2.7072) | 1.64 (2.6713) | 2.01 (2.7169) | 8.50 | |
F | 3.78 (3.2202) | 1.95 (2.8762) | 2.09 (2.7296) | 1.14 (2.7704) | 1.19 (2.7195) | 0.97 (2.6796) | 0.72 (2.6748) | 0.70 (2.6650) | 0.78 (2.6930) | 0.76 (2.6842) | 3.09 | |
G | 4.47 (4.3264) | 4.36 (3.9313) | 3.54 (3.6910) | 2.46 (3.7323) | 1.68 (3.6935) | 2.30 (3.5939) | 1.71 (3.6662) | 1.60 (3.6585) | 1.30 (3.6460) | 1.33 (3.6410) | 4.14 | |
H | 5.77 (4.3486) | 3.73 (3.9979) | 3.41 (3.6508) | 3.34 (3.7958) | 3.20 (3.6410) | 3.37 (3.5405) | 3.52 (3.6116) | 3.67 (3.6118) | 3.86 (3.6287) | 3.64 (3.6571) | 5.38 |
![]() | ||
Fig. 4 Comparison of the relative stabilities of the serotonin conformers at MP2 level employing 6-31+G(d), 6-311++G(d,p) and aug-cc-pVDZ basis sets. |
![]() | ||
Fig. 5 Comparison of the relative stabilities of the serotonin conformers at B3LYP level employing 6-31+G(d), 6-311++G(d,p) and aug-cc-pVDZ basis sets. |
The rotational constants and zero point vibrational energy of the eighteen conformers of serotonin are listed in Tables S2 and S3 of ESI.† The values of rotational constants of Table S2 of ESI† allow to classify the rotamers of serotonin as belonging to different families. Conformers belonging to the same family have similar mass distributions so their rotational constants are very similar. A first comparison of these predicted values of rotational constants given in Table S2 of ESI† with those experimentally observed allows us to classify the observed rotamers as belonging to different families (Gph, Gpy, and Anti). The rotational constants for the conformers Gph(out)/anti and Gph(out)/syn are very similar, as well as the values of Gph(up)/anti, Gph(up)/syn and Gph(in)/syn are also almost similar to this group which belongs to a ‘Gph’ family. Similarly the rotational constants for the conformers Gpy(out)/anti, Gpy(out)/syn, Gpy(up)/anti, and Gpy(up)/syn indicate that it belongs to a ‘Gpy’ family. ‘Anti’ family also have similar values of rotational constants. The NBO calculations at the MP2/aug-cc-pVDZ level of theory led to negative charge densities of −0.930, −0.773, −0.663 (in serotonin C) and −0.928, −0.768 and −0.665 (in serotonin A) on amino N2, hydroxyl O1, and N1 (of indole NH) atoms respectively (see Fig. S2 and Table S4 of the ESI†). One can note that the negative charge densities on the N1 and O1 atoms are also large but not as significant as on the amino nitrogen atom. Other serotonin conformers led to similar values (see Table S4 of the ESI†).
Harmonic vibrational frequencies and IR intensities of the twenty three stable conformers of serotonin were calculated by DFT-B3LYP employing the various basis sets including 6-311++G(d,p), 6-311++G(2d,2p), aug-cc-pVDZ. Computed IR spectra of the eight experimentally observed conformers of serotonin at B3LYP/6-311++G(2d,2p) level using the S0 optimized geometries at the MP2/aug-cc-pVDZ level of theory are displayed in Fig. 6. Sixty nine normal vibrational modes were determined for the each conformer. However, only fundamental frequencies above 2800 cm−1 corresponding to hydride stretch region and selected significant frequencies below 2800 cm−1 were analyzed in present study. Intra-molecular interactions have a strong influence on the frequencies of vibrational stretching modes involving hydrogen. All computed hydride stretch mode frequencies and intensities of the eight experimentally observed conformers of serotonin are assigned and are listed in Table 4 along with the corresponding gas phase IR frequencies.5 Computed vibrational fundamentals are found only slightly larger than the experimental values, excluding the hydroxyl (OH) stretching mode. This disagreement may be partly due to the anharmonicity. As we have mentioned in the earlier section that the scaling factor of 0.977 and 0.988 for the OH and the NH/CH stretch fundamentals respectively are used to scale down the vibrational mode frequencies of the monomer, however there is no scaling used for the alkyl CH stretching and bending fundamentals. The hydride stretching modes can be divided into three groups: the heterocyclic system of the indole ring (aromatic CH and indole NH stretches), the ethylamine side chain (alkyl CH and amine NH stretches), and hydroxyl group (OH stretch). Each computed fundamental mode vibrations due to the OH, indole NH, NH2, aromatic CH, and alkyl CH stretching modes of serotonin are assigned with the aid of Gaussian view 5.0, by comparing with experimentally observed fundamentals. It is evident from theoretical and experimental IR spectra that the frequency (predicted at 3530/3531 cm−1) and intensity of indole NH stretching mode in the all conformers of serotonin are almost unchanged from one conformer to other, as they were found in tryptamine.45 The OH stretch mode frequency and intensity of each anti-OH conformer are also almost unchanged, however the corresponding mode for all OH-syn conformers is blue shifted by 4–6 cm−1 (Table 4) and the intensity is increased significantly (see Fig. 6 and Table 4). Our theoretical calculations predict that amino NH stretching modes have very low IR intensities, which is in consonance to observed resonant ion-dip infrared (RIDIR) and fluorescence-dip infrared (FDIR) spectra of isolated serotonin cooled in supersonic expansion.5 It was reported5 that the symmetric and antisymmetric NH2 stretching modes are only observable in conformers A, C and F at 3339–3342 and 3407–3410 cm−1 respectively. However, Raman intensity for the NH2 stretching modes is predicted to be high; the symmetric stretching mode has three times more high Raman intensity than the antisymmetric (see Table 4). Recently Mayorkas et al.45 observed the strong Raman lines at 3342–3345 cm−1 in the Ionization Loss Stimulated Raman (ILSR) spectra of tryptamine (for the analogous conformers A, C(2) and F)45 which can be attributed to symmetric NH2 stretching fundamental. The corresponding ant symmetric NH2 stretching fundamental in the ILSR spectra was observed at 3411–3413 cm−1 with a weak Raman intensity. Surprisingly Mukherjee et al.18 have assigned the conventional IR bands observed at 3438 and 3397 cm−1 as symmetric and asymmetric NH2 stretching mode respectively. However Yang and Gao17 and Bayari et al.16 have assigned the IR band observed at 3438 cm−1 as a indole NH stretching band. LeGreve et al.5 have attributed symmetric and asymmetric NH2 stretching modes to very weak IR bands observed in the experimental gas phase IR spectra at 3342 and 3407 cm−1 respectively which is supported by our DFT calculations as well as by earlier reported theoretical predictions. The asymmetric amino NH stretching band is predicted at the higher frequency than the corresponding symmetric mode which is in agreement to the assignment of LeGreve et al.5 Therefore the assignment of conventional IR band observed at 3438 cm−1 as a symmetric NH2 stretching mode by Mukherjee et al.18 seems to be ambiguous. The small changes in the frequencies and patterns of NH2 stretching modes of different experimentally observed conformers of 5-HT is predicted (see Table 4) as observed in the ILSR spectra of tryptamine.45 The aromatic CH stretch fundamental bands are predicted to lie between 3045–3135 cm−1 and the alkyl chain CH-stretches between 2848–2977 cm−1. The aromatic CH stretches are generally rather similar in the different conformers, though individual stretching modes are affected by the vicinity of the alkyl chain and OH group. As seen in Table 4 the phenyl symmetric and anti symmetric CHHC stretch frequencies are higher than the phenyl C4H stretch mode for all OH-anti conformers, however for OH-syn conformers, the phenyl C4H stretch mode frequency becomes higher than CHHC stretch frequencies and intensity is increased due to blue shifting CH⋯O hydrogen-bonding. It should be noted that the phenyl C4H bond lies in the vicinity of the OH group (see Fig. 1). So, all the OH-syn conformers located in our calculations have unconventional blue shifted hydrogen bonds. It can be inferred then that the blue shifting H-bonds may also play an important role in the conformation stability of serotonin.
![]() | ||
Fig. 6 Calculated IR spectra of the eight experimentally observed conformers of serotonin at the B3LYP/6-311++G(2d,2p) level of theory. |
Approximate descriptions of vibrations | Conformer A | Conformer C | Conformer F | Conformer H | ||||||||||||
---|---|---|---|---|---|---|---|---|---|---|---|---|---|---|---|---|
Expt.a | Freq. | Int. | Raman activity | Expt.a | Freq. | Int. | Raman activity | Expt.a | Freq. | Int. | Raman activity | Expt.a | Freq. | Int. | Raman activity | |
a Taken from ref. 5. * Vibrational mode wave numbers in italic fonts exhibits mixed vibrations. | ||||||||||||||||
ν (OH) | 3667 | 3667 | 48 | 102 | 3666 | 3664 | 50 | 98 | 3671 | 3674 | 65 | 141 | 3671 | 3674 | 63 | 142 |
ν (indole NH) | 3530 | 3530 | 78 | 143 | 3530 | 3530 | 78 | 147 | 3531 | 3531 | 77 | 143 | 3530 | 3531 | 77 | 147 |
ν (NH2)a | 3410 | 3430 | 3 | 67 | 3407 | 3426 | 3 | 70 | 3409 | 3429 | 2 | 67 | — | 3429 | 3 | 69 |
ν (NH2)s | 3339 | 3358 | 4 | 145 | 3342 | 3356 | 7 | 160 | 3338 | 3358 | 4 | 146 | — | 3359 | 7 | 165 |
ν (CH) pyrrole | — | 3096 | 0 | 109 | — | 3090 | 0 | 117 | — | 3095 | 0 | 110 | — | 3089 | 0 | 117 |
ν (HCCH) (+) in phenol ring | — | 3051 | 5 | 193 | — | 3051 | 6 | 195 | — | 3035 | 13 | 160 | — | 3034 | 12 | 172 |
ν (HCCH) (−) in phenol ring | — | 3029 | 7 | 98 | — | 3029 | 7 | 108 | — | 3009 | 12 | 105 | — | 3008 | 12 | 106 |
ν (C4–H) phenyl | — | 3010 | 13 | 64 | — | 3022 | 6 | 47 | — | 3044 | 3 | 89 | — | 3053 | 1 | 71 |
ν [CH2(β)]a | 2960 (w) | 2973 | 29 | 81 | 2955 (m) | 2966 | 24 | 65 | 2963 (w) | 2973 | 29 | 78 | 2955 (m) | 2968 | 22 | 61 |
ν [CH2(α)]a | 2947 (w) | 2956 | 63 | 218 | 2941 (m) | 2952 | 82 | 293 | 2945 (w) | 2957 | 63 | 221 | 2942 (m) | 2951 | 85 | 302 |
ν [CH2(β)]s | 2919 (m) | 2925 | 28 | 120 | 2923 (m) | 2928 | 20 | 96 | 2922 (m) | 2928 | 26 | 119 | 2927 (m) | 2929 | 19 | 94 |
ν [CH2(α)]s overtone of δ (CH) | 2851 (w) | 2871 | 51 | 87 | 2849 (w) | 2867 | 61 | 113 | 2854 (w) | 2878 | 46 | 87 | 2846 (w) | 2863 | 64 | 111 |
2912 (w) | — | — | — | 2915 (m) | — | — | — | |||||||||
δ (CH)ring | — | 1474 | 66 | 5 | — | 1474 | 69 | 4 | — | 1472 | 42 | 5 | — | 1472 | 44 | 6 |
δ (OH) | — | 1181 | 182 | 8 | — | 1182 | 152 | 5 | — | 1180 | 75 | 10 | — | 1175 | 84 | 8 |
Approximate descriptions of vibrations | Conformer B | Conformer G | Conformer D | Conformer E | ||||||||||||
---|---|---|---|---|---|---|---|---|---|---|---|---|---|---|---|---|
Expt.a | Freq. | Int. | Raman activity | Expt.a | Freq. | Int. | Raman activity | Expt.a | Freq. | Int. | Raman activity | Expt.a | Freq. | Int. | Raman activity | |
ν (OH) | 3668 | 3666 | 49 | 102 | 3672 | 3674 | 66 | 142 | 3668 | 3667 | 47 | 100 | 3667 | 3667 | 48 | 99 |
ν (indole NH) | 3531 | 3530 | 79 | 143 | 3530 | 3531 | 78 | 143 | 3531 | 3532 | 79 | 147 | 3530 | 3531 | 80 | 149 |
ν (NH2)a | — | 3414 | 3 | 35 | — | 3414 | 2 | 35 | — | 3434 | 0 | 87 | — | 3428 | 0 | 52 |
ν (NH2)s | — | 3348 | 1 | 111 | — | 3347 | 1 | 112 | — | 3365 | 1 | 165 | — | 3361 | 2 | 133 |
ν (CH) pyrrole | — | 3091 | 0 | 109 | — | 3091 | 0 | 110 | — | 3092 | 0 | 119 | — | 3091 | 0 | 119 |
ν (HCCH) (+) in phenol ring | — | 3052 | 5 | 193 | — | 3035 | 12 | 160 | — | 3052 | 5 | 195 | — | 3052 | 5 | 195 |
ν (HCCH) (−) in phenol ring | — | 3030 | 7 | 98 | — | 3010 | 12 | 105 | — | 3029 | 7 | 100 | — | 3030 | 7 | 100 |
ν (C4–H) phenyl | — | 3011 | 13 | 64 | — | 3045 | 2 | 89 | — | 3007 | 16 | 69 | — | 3007 | 15 | 68 |
ν [CH2(β)]a | 2944 (m) | 2947 | 47 | 134 | 2948 (m) | 2948 | 47 | 145 | 2969 (w) | 2975 | 32 | 54 | 2925 (m) | 2938 | 10 | 114 |
ν [CH2(α)]a | 2949 (s) | 2973 | 54 | 75 | 2939(w) | 2976 | 50 | 68 | 2949 (m) | 2957 | 21 | 64 | 2949 (s) | 2979 | 33 | 13 |
ν [CH2(β)]s | 2851 (w) | 2908 | 38 | 145 | 2849 (w) | 2911 | 37 | 145 | 2937 (m) | 2905 | 31 | 151 | 2852 (s) | 2905 | 39 | 166 |
ν [CH2(α)]s overtone of δ (CH) | 2883 (w) | 2934 | 18 | 181 | 2882 (w) | 2936 | 19 | 174 | 2856 (s) | 2882 | 55 | 98 | 2884 (m) | 2943 | 37 | 55 |
2854 (w) | — | — | — | |||||||||||||
2909 (w) | — | — | — | 2911 (w) | — | — | — | 2912 (m) | — | — | — | |||||
2921 (w) | — | — | — | 2919 (w) | 2945 (s) | — | — | — | ||||||||
δ (CH)ring | — | 1475 | 66 | 5 | — | 1472 | 43 | 5 | — | 1474 | 68 | 5 | — | 1474 | 69 | 6 |
δ (OH) | — | 1183 | 218 | 7 | — | 1195 | 89 | 25 | — | 1182 | 230 | 6 | — | 1182 | 229 | 7 |
The alkyl CH stretch frequencies have been claimed to be most sensitive to conformational changes in serotonin and are most useful diagnostic of the ethylamine side chain conformation.5,11 We have assigned precisely the vibrational fundamentals of the reported gas phase IR spectra in the alkyl CH stretch region of the experimental serotonin conformers5 by comparing the vibrational modes obtained from ab initio and density functional theory calculations invoking higher basis sets. Present work has aided the interpretation of alkyl CH stretch fundamentals of eight experimentally observed conformers more systematically and many previous incomplete assignments11 have been analyzed and amended. Computed four alkyl CH stretch fundamental frequencies attributed to in phase and out of phase CH2(α) and CH2(β) vibrations for each lowest energy conformer of serotonin. Predicted alkyl CH stretch frequencies for the conformers A, C, F and H are found very close to the experiment5 and there is no need of further scaling. However in the rest four experimental conformers the most of the observed alkyl CH stretch band5 are not found very close to the corresponding predicted values. The symmetric (low frequency) CH2(α) stretch vibration predicted between 2915–2925 cm−1 and 2849–2856 cm−1 in the ‘up’ and ‘non up’ structures. Mourik and Emson11 explained that in all ‘up’ structures (conformers B, G and E) the lone pair on the amino group is positioned between the two CH2(α) atoms and in all ‘not-up’ conformers (A, C, F and H) the amino lone pair lies trans to one of the H(α) atom. This causes low frequency CH2(α) stretch to occur at small value and with higher intensities than in the ‘up’ conformer.11 This so called trans lone pair effect can shift the CH-stretch fundamentals towards the longer wavelength side by as much as 100–150 cm−1.11 However experimental FDIR and RIDIR spectra5 reveals that the lowest frequency band observed at 2846–2856 cm−1 for all the eight experimentally observed conformers, which can be attributed to low frequency CH2(α) stretch in the most of the eight conformers and its intensity is observed weak for all of the conformers. However the predicted lowest alkyl CH-stretching frequency of serotonin conformers B, E and G is increased by only about 50 cm−1 but relative intensity is decreased which is opposite, to the above11 interpretation. This is somewhat difficult to interpret clearly at this stage because due to coupling of symmetric and antisymmetric CH2 stretch modes probably the anharmonicity is increased non-linearly and the harmonic calculations do not account for anharmonicity. In each of eight conformers the antisymmetric CH2 stretch frequency is higher than the corresponding symmetric mode. Generally the CH2(β) stretching mode frequencies are higher than that of CH2(α) in both symmetric and antisymmetric modes. The antisymmetric CH2(β) stretch frequency observed at 2949–2969 cm−1 for all eight conformers are found in consonance to our corresponding predicted values (see Table 4). The LeGreve et al.5 observed the two peaks at 2949 and 2944 cm−1, 2948 and 2939 cm−1 and 2949 cm−1 2945 cm−1 for the conformers B, G and E respectively. This splitting is expected to arise due to a Fermi resonance between the antisymmetric CH2(β) stretch and a overtone of CH bending mode predicted at 1474 cm−1. Such type of splitting was not observed in the ILSR spectra of tryptamine probably due to low Raman intensity of CH bending mode. In addition to the hydride stretch region, the frequency and the intensity of the OH bending mode of the experimentally observed conformers is also included in Table 4. The OH bending is the most intense fundamental of the stable serotonin conformers and a comparison of its predicted intensity between the different conformations could be also useful in making conformational assignments. The frequency of OH bending fundamental is only slightly increased by 4 cm−1 for the OH-syn conformation, however the intensity of OH-syn conformers reduced to half in comparison to corresponding OH-anti conformers (Fig. 6 & Table 4). As seen in Table 4 and Fig. 6, the intensity of the OH-bending fundamental can be a useful diagnostic for the conformational changes in serotonin.
Conformational state | Experimental gas phase value (0–0 excitations) for 1Lba | Calculated values at TD-DFT-B3LYP/aug-cc-pVDZ level | calculated values at CC2/def-TZVP level | |||||
---|---|---|---|---|---|---|---|---|
1Lb | 1La | 1πσ* (O–H) | 1πσ* (N–H) | 1Bb | 1Lb | 1La | ||
a From ref. 5.b Corresponding experimental value taken from the ref. 20. | ||||||||
Gph(out)/anti | 4.0350 | 4.218 (0.056) | 4.497 (0.097) | 4.632 (0.002) | 4.850 (0.011) | 5.585 (0.256) | 4.488 (0.072) | 5.045 (0.113) |
4.091b (0.054) | 4.463b (0.098) | — | — | 5.616b (0.56) | — | — | ||
Gpy(out)/anti | 4.0399 | 4.222 (0.048) | 4.482 (0.098) | 4.541 (0.002) | 4.828 (0.005) | 5.588 (0.133) | 4.495 (0.069) | 4.999 (0.105) |
Gpy(up)/anti | 4.0354 | 4.219 (0.053) | 4.501 (0.092) | 4.598 (0.004) | 4.886 (0.012) | 5.594 (0.035) | 4.489 (0.072) | 5.032 (0.108) |
Anti(py)/anti | 4.0369 | 4.218 (0.050) | 4.464 (0.102) | 4.504 (0.001) | 4.712 (0.002) | 5.648 (0.249) | 4.493 (0.070) | 4.995 (0.113) |
Anti(up)/anti | 4.0340 | 4.197 (0.053) | 4.451 (0.062) | 4.493 (0.012) | 4.701 (0.003) | 5.544 (0.137) | 4.489 (0.072) | 5.000 (0.112) |
Gph(out)/syn | 4.0024 | 4.162 (0.056) | 4.507 (0.084) | 4.572 (0.001) | 4.900 (0.001) | 5.560 (0.260) | 4.422 (0.071) | 5.022 (0.100) |
Gpy(out)/syn | 4.0112 | 4.170 (0.049) | 4.502 (0.084) | 4.589 (0.000) | 4.873 (0.012) | 5.641 (0.254) | 4.430 (0.067) | 4.985 (0.095) |
Gpy(up)/syn | 4.0063 | 4.166 (0.053) | 4.517 (0.092) | 4.615 (0.000) | 4.952 (0.001) | 5.541 (0.234) | 4.424 (0.070) | 5.016 (0.098) |
The electronic spectra of indole containing molecules such as tryptamine and serotonin is challenging due to the close proximity and interactions between the lowest excited states of the indole chromosphere. If one wishes to begin studying the electronic spectra of serotonin in a systematic way, one strategy is to start with a relatively simple model and then gradually incorporate additional substituent groups. Indole provides a first approximation to all three related species, 5-hydroxyindole, tryptamine and serotonin. The electronic spectroscopy of indole in the gas phase has been well studied and photo excitation in the 285–220 nm region is primarily due to two valence states of 1ππ* character and 1A′ symmetry which are historically assigned 1La and 1Lb states.46–48 Hollas46 identified the first electronic origin of the indole (the lowest excited 1Lb (ππ*) state) in the gas phase at 283.83 nm. At slightly higher excitation energies, laser induced fluorescence experiments later identified the 1La, (ππ*) state, which was found to have a larger absorption cross-section than the 1Lb state. The 1La state of indole is only 1000–1500 cm−1 above than the origin of lowest excited singlet 1Lb state.47,48 While the 1Lb state gives rise to a structured band and has a small dipole moment, the 1La state produces a broad band and its large dipole moment makes it sensitive to polar environment. In addition, there is a third dissociative state of 1πσ* character which plays a decisive role in the photo-physics of indole. The 1πσ* has a vertical excitation of only 0.12 eV higher than that of the 1La state and its dipole moment is much larger than the 1La state. The S0–1πσ* transition posses little or no oscillator strength and so is essentially “optically dark” to single photon absorption. At energies above ∼220 nm, strong absorption to two higher lying 1ππ* states denoted 1Ba and 1Bb, also becomes significant.46–48
5-Hydroxy indole is an indole substituted at the 5-position with a hydroxyl (–OH) group. The low lying electronic excitation energies of 5-hydroxy indole also cover similar excited states: the two ππ* Lb and La states, the dark πσ* state with dissociative character and the higher lying 1ππ* state 1Bb etc. (Table S5 of ESI†).49,50 An additional dark πσ* state also arises due to 5-OH group.49 It was observed that the 5-hydroxy substitution lowers the S0–S1 origin by over 2324 cm−1 from indole to 5-hydroxy indole (Table S7 of ESI†).49,50 The ultraviolet spectrum of 5-hydroxyindole exhibits transitions due to two isomers, with S1 ← S0 origins at 32685 and 32
914 cm−1, separated by 229 cm−1.50 These transitions have been tentatively assigned to the syn and anti isomers of the 5-OH group, respectively, on the basis of their relative intensities and the calculated energy ordering. The tryptamine is a constituent of an indole moiety connected to a flexible ethylamine side chain. It also resembles structurally and chemically the neurotransmitter serotonin. It was observed that the 3-ethylamie substitution lowers the S1–S0 origin by over 313 cm−1 from indole to tryptamine.5,15,45 The low lying electronic excitation energies of tryptamine covers the two excited singlet ππ* (Lb and La) states. Recently DFT/MRCI calculations on tryptamine15 predicted that the 1Lb state is the lowest electronic state. The optically bright 1La state constitutes the second excited state in the vertical excitation spectrum, about 2000–2500 above the 1Lb state, depending on conformer.
Therefore it can be expected that in the case of serotonin, 5-OH substitution has a similar effect on the S1 ← S0 transition energy as found in 5-HI. It was observed that the 5-hydroxy substitution in serotonin lowers the S1–S0 origin by over 2335 cm−1 from tryptamine to serotonin which is similar to energy lowering in 5-HI.45 The lowest singlet excited state Lb of each experimentally observed serotonin conformer is of ππ* character dominated by single configuration corresponding to HOMO → LUMO (∼0.67) excitation. The energy gap between HOMO and LUMO of the most stable conformer C was found to be 4.94 eV at the B3LYP-D3/TZVP level of theory. The dipole moment, 3.699 D, of the S1 state is predicted slightly higher than that of the ground state dipole moment, 3.125 D at the same level of theory, which indicates that position of S0–S1 band may be red-shifted in polar solvents. The S0–S2 excitation energy, of the optically bright La (1ππ*) state, is dominated by H − 1 → L(0.67) transition. The predicted VEE of the optically dark 1πσ*OH and 1πσ*NH states of serotonin is computed at 4.63 and 4.85 eV with very weak oscillator strengths 0.002 and 0.011 respectively. These two 1πσ*OH and πσ*NH states are dominated by H → L + 2 (0.63) and H − 1 → L + 2 (0.53) transitions respectively. The intense absorption peak observed20 at 5.62 eV is attributed to 1Bb (ππ*) state. This high lying 1Bb (ππ*) state is expected to be dominated by H − 1 → L + 1 and H → L + 3 excitation. As seen in Table 5 the VEE of the observed conformers of serotonin for 1Bb (ππ*) state predicted between 5.54–5.85 eV, is in remarkable agreement to experiment.20 The ultraviolet spectrum of serotonin is also divided into two subsets due to the two distinct OH orientations, syn and anti. As earlier mentioned that the anti and syn conformations of 5-HI are separated by 229 cm−1, the similar separations are reported to be 231, 235, 262 cm−1 between serotonin conformers A(Gpy(out)/anti) and F(Gpy(out)/syn), B(Gpy(up)/anti) and G(Gpy(up)/syn) and C(Gph(out)/anti) and H(Gph(out)/syn) respectively.5
We have optimized the lowest excited states of serotonin in the Gph(out)/anti conformation at the B3LYP/def.TZVP and PBEO/def.TZVP levels of theory. The optimized energy of the lowest 1Lb state shows an excellent agreement with the corresponding gas phase S0–S1 electronic transition energy. Interestingly the B3LYP value was found to be more close to the experiment in comparison to PBEO.26 As seen in the Table S7 of ESI† the relative energy between the computed origin of the 1La and the 1Lb states of serotonin for the most stable Gph(out) conformation is found to be 3841 cm−1.
Conformer | Methods | Bond lengths (Å) | Angles (°) | Dipole moments (D) | ||||
---|---|---|---|---|---|---|---|---|
N–O | O–O | O–O-5 | N⋯HO | O⋯HO | O⋯HO-5 | |||
a From ref. 22. | ||||||||
Sero–(H2O)1 | ||||||||
I | Exptl.a | 2.97 | 2.96 | 167 | 157 | — | ||
M06-2X | 2.97 | 2.94 | 168 | 156 | 5.3632 | |||
MP2 | 2.98 | 3.01 | 168 | 157 | 5.6732 | |||
II | Exptl.a | 2.87 | 165 | — | ||||
M06-2X | 2.86 | 164 | 2.6267 | |||||
MP2 | 2.87 | 166 | 2.8289 | |||||
III | Exptl.a | 2.87 | 165 | — | ||||
M06-2X | 2.86 | 164 | 2.4535 | |||||
MP2 | 2.87 | 166 | 2.4994 | |||||
![]() |
||||||||
Sero–(H2O)2 | ||||||||
I | Exptl.a | 2.79 | 2.75 | 2.77 | 179 | 176 | 176 | — |
M06-2X | 2.77 | 2.73 | 2.75 | 178 | 174 | 177 | 5.9775 | |
MP2 | 2.79 | 2.75 | 2.77 | 178 | 175 | 176 | 6.3200 |
Conformer | Experimental gas phase value of 0–0 excitationsa | Calculated values at TD-DFT-B3LYP/6-311++G(d,p) level | Calculated values at CC2/def-TZVP level | ||
---|---|---|---|---|---|
1Lb | 1La | 1Lb | 1La | ||
a From ref. 5 and 22. | |||||
Bare serotonin | |||||
A Gpy(out)/anti | 4.0399 | 4.2924 (0.051) | 4.5582 (0.046) | 4.4952 (0.069) | 4.9994 (0.105) |
C Gph(out)/anti | 4.0350 | 4.2895 (0.061) | 4.5710 (0.095) | 4.4876 (0.072) | 5.0454 (0.113) |
F Gpy(out)/syn | 4.0112 | 4.2411 (0.052) | 4.5701 (0.078) | — | — |
![]() |
|||||
Sero–(H2O)1 | |||||
A Gpy(out)/anti | 4.0507 | 4.3078 (0.040) | 4.5306 (0.088) | 4.5051 (0.066) | 4.9482 (0.107) |
C Gph(out)/anti | 3.9908 | 4.2506 (0.068) | 4.6146 (0.085) | 4.4294 (0.077) | 5.1141 (0.109) |
F Gpy(out)/syn | 4.0237 | 4.2637 (0.044) | 4.5469 (0.079) | — | — |
![]() |
|||||
Sero–(H2O)2 | |||||
C Gph(out)/anti | 3.9363 | 4.1299 (0.044) | 4.6055 (0.074) | — | — |
The effect of hydration on 1Lb (ππ*) and 1La (ππ*) excited states due to bulk water environment was also performed by a combination of polarizable continuum solvent model (PCM)39–41 and the conductor like screening model (COSMO)42 which shows a red shift for each state of the experimentally observed conformers. The TD-B3LYP/aug-cc-pVDZ VEE for 1Lb (ππ*) and 1La (ππ*) excited states in bulk water environment are given in Table S6 of ESI.† The TD-B3LYP/TZVP VEE for the 1Lb (ππ*) and 1La (ππ*) excited states of bare serotonin C are computed at 4.39 (with an oscillator strength 0.068) and 4.72 eV (with an oscillator strength 0.095) respectively, while in COSMO bulk water environment the corresponding VEE are computed at 4.34 (with an oscillator strength 0.074) and 4.66 eV (with an oscillator strength 0.121) respectively. Thus a red shift of 0.05 and 0.06 eV for the transition to 1Lb and 1La excited states respectively is predicted. Similar red shift in COSMO bulk water environment are also predicted for serotonin A. This indicates the strengthening of the hydrogen bonding, in general, in the bulk water environment due to electronic excitations to the low lying excited states 1Lb and 1La. We have earlier mentioned that the red shift in the lowest lying Lb (1ππ*) state for Sero1–(H2O)1 involving Gph(out)/anti (C) conformation shows that S0–S1 electronic transition increases the strength of the hydrogen bonds to water. LeGreve et al.22 anticipated that a major consequence of electronic excitation is the strengthening of the 5-OH⋯water H-bond, which should shift the water molecule toward the 5-OH group. We have optimized the lowest excited structure of Sero1–(H2O)1 involving conformer C at the B3LYP/def.TZVP level of the theory. Interestingly the optimized lowest excited state (1Lb) structure of Sero1–(H2O)1 complex involving the Gph(out)/anti (C) conformation shows a major shift of 1.15 Å of water molecule towards the 5-OH group due to S0–S1 electronic excitation and a significant lengthening of the OH⋯N distance by 0.12 Å in the S1 excited state (see Fig. 8). However earlier calculation22 was performed at the CIS/6-31+G(d) level of theory, predicted a decrease in the 5-OH⋯O heavy atom distance of 0.32 Å and a minor lengthening of the OH⋯N distance by 0.02 in the excited S1 state.22 Our result is significantly consistent with the argument22 that a single water molecule cannot span the gap between 5-OH and NH2 groups in serotonin and so has two non optimal hydrogen bonds whose strength is changed upon electronic excitation.
![]() | ||
Fig. 8 Optimized (a) ground and (b) lowest excited state structures of Sero–(H2O)1 complex involving Gph(out)/anti conformation at B3LYP/def-TZVP level. |
Footnote |
† Electronic supplementary information (ESI) available: The computed structural parameters, NBO charges, rotational constants, vertical excitation energies in bulk water environment etc. of different conformers of serotonin are submitted. See DOI: 10.1039/c5ra00827a |
This journal is © The Royal Society of Chemistry 2015 |