α-Mangostin induces G1 cell cycle arrest in HCT116 cells through p38MAPK-p16INK4a pathway

Sovannarith Korm a, Ho-Chang Jeonga, Ok-Seon Kwona, Jeong-Rak Parka, Hyeseong Chob, Young-Mi Kimc, Young-Won Chinc and Hyuk-Jin Cha*a
aDepartment of Life Science, College of Natural Science, Sogang University, Seoul, Republic of Korea. E-mail: hjcha@sogang.ac.kr; Fax: +82-2-704-3601; Tel: +82-2-705-4761
bDepartment of Biochemistry, Ajou University School of Medicine, Suwon, Republic of Korea
cCollege of Pharmacy and BK21PLUS R-FIND Team, Dongguk University-Seoul, Goyang, Republic of Korea

Received 14th January 2015 , Accepted 9th April 2015

First published on 9th April 2015


Abstract

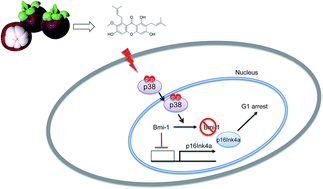
α-Mangostin (α-MG), one of the active substances in Garcinia mangostana, has been shown to exhibit anti-cancer effects in various cancer cell types. α-MG treatment induces G1 arrest in cancer cell models through the induction of cyclin-dependent kinase inhibitors (CDKIs) and the subsequent loss of CDK activity. However, outside its role in the p53-p21CIP1 axis, the precise molecular mechanisms underlying the effect of α-MG on cell cycle arrest remain unclear. In this study, we observed that α-MG inhibits the proliferation of HCT116 cells in a dose-dependent manner. Interestingly, although the loss of p53 rescued the α-MG effect on cell cycle arrest, in agreement with previous reports, p21Cip1 expression was only marginally delayed in the absence of p53 after α-MG treatment. Instead, we found that the activation of p38 mitogen activated protein kinase (MAPK) and the subsequent downregulation of Bmi-1 also contributed to the induction of p16Ink4a, which is responsible for G1 arrest upon α-MG treatment. These findings indicate that α-MG exerts cytostatic effects on colon cancer cells by inducing G1 arrest via the p38MAPK-p16INK4a axis.

Introduction

Anticancer therapies such as surgery, chemotherapy, and radiotherapy have been used for a number of years, but colon cancer patients only receive limited benefits due to metastasis, acquired chemoresistance and toxicity to normal proliferating cells. To overcome the limitations of small-molecule-based screening for novel active anti-cancer compounds, initial screens of natural products have been suggested as an important alternative during the drug discovery process.1 Due to their wide variety and the complexity of their active ingredients, as well as distinct biological activities that have been difficult to reproduce with synthetic small molecules, extensive efforts have been devoted to seeking novel natural compounds that can be used not only as drug precursors but also directly in clinical applications.1,2

α-MG, one of the active substances found in the mangosteen fruit (Garcinia mangostana L.), has been shown to induce various biological effects, including anti-inflammatory,3 antibacterial,4 and anticancer effects.5 However, compared to the number of reports demonstrating the various cellular effects of α-MG, molecular studies aimed at accounting for each specific effect are currently few in number.

Uncontrolled proliferation, one of the typical hallmarks of cancer, is induced by the deregulation of normal cell cycle mechanism, resulting from both ‘self-sufficiency in growth signals’ and ‘insensitivity to anti-growth signals’.6 Normal cell cycle regulators, particularly cyclin-dependent kinases (CDKs), a family of protein kinases that control cell-cycle progression, have been shown to be promising anti-cancer targets.7 The balance between the activity of CDKs and the expression of CDK inhibitors (CDKIs) determines whether cells proceed through G1 into S phase, and from G2 to M, through regulatory mechanisms that are conserved in more complex eukaryotes.8 When cells respond to various cellular stress conditions, such as oxidative stress and genotoxic stress (e.g., exposure to ionizing radiation, UV light or carcinogens), they activate cell-cycle checkpoint signals, which lead to the upregulation of CDKIs.9,10 The upregulation of CDKIs is mediated by the activation of p38α MAPK (or p38α) or the transactivation of p53,11 whereby p38α and p53 serve as important components of the tumor surveillance network. Specifically, p38α activation by oncogenic challenge (or stress) triggers stress signaling to stabilize the p53 protein and increase p16Ink4a gene transcription, which selectively induces oncogenic-induced senescence12 or the G1/S checkpoint.13 In parallel with p53, p21Cip1, a CDKI known to act downstream of p53, is suggested to be a key mediator of α-MG induced G1 arrest in a breast cancer cell model.14 However, the role of the p53-p21Cip1 axis in α-MG-induced growth arrest or G1/S cell-cycle arrest remains poorly characterized.

Here, we observed that the induction of p21Cip1 by α-MG appeared to be independent of p53 expression. Given that the loss of p53 rescues the cell-cycle effect of α-MG in the presence of p21Cip1 expression, p21Cip1 induction after α-MG treatment may have only a marginal effect on growth arrest. Instead, we demonstrated that the activation of p38α by α-MG, along with the subsequent downregulation of Bmi-1, is associated with p16Ink4a induction. Inhibiting either p38α activity or p16Ink4a gene induction using a knockdown approach also restored cell proliferation, indicating that the p38α-p16Ink4a axis is also critical for α-MG-induced G1 arrest.

Materials and methods

Reagents and antibodies

Dimethyl sulfoxide (DMSO) (0.05% final concentration), purchased from Sigma-Aldrich (#D2650), was used as control. The primary antibody against phospho-RB Ser807/811 (#9308S), p53 (#9282), and phospho-p38MAPK Thr180/Tyr182 (#4631S) were obtained from Cell Signaling Technology. Anti-cyclin D1 (sc-718), anti-β-actin (sc-47778), and anti-p21 (sc-397) were acquired from Santa Cruz Biotechnology Inc. Anti-phospho-histone H1 T146 (ab3596) and anti-phospho-histone H3 (ab14955) were purchased from Abcam, and anti-p16INK4a/CDKN2 (P0968) was acquired from Sigma-Aldrich. Anti-rabbit or anti-mouse antibodies conjugated to horseradish peroxidase (HRP) (Jackson Immunoresearch Laboratories). α-Mangostin was prepared as described previously.15 The purity of α-mangostin used in the present study was determined to be over 95% by HPLC-UV method.

Cell culture and siRNA transfection

HCT116 wild colon carcinoma cell lines expressing wild-types and knockout p53−/− were cultured in DMEM 1× medium supplemented with 10% (v/v) fetal bovine serum (16000-044; Gibco) and 0.1% gentamycin (15750-060; Gibco). Cells were treated with α-MG (0, 2, 4, 6, 8, 10 μg mL−1) as indicated. Lipofectamine 2000 (11668-027, Invitrogen) or DharmaFECT (T-2001-02, Thermo Scientific) was used for transfecting the cell according to the protocol of manufacturer. SB203580 (20 μM) was from Calbiochem. The small interfering RNA (siRNA) targeting human CDKN2A (p16INK4a) (CCACUACCGUAAAUGUCCA) and no targeting siRNA were purchased from Bioneer. HCT116 WT cells was grown till confluence at 60% and transfected with either lipofectamine or DharmaFECT reagent depending on the protocol of manufacturer. The cells were treated with α-MG as indicated above after siRNA transfection.

Cell proliferation assay

The cytotoxicity effect of α-MG was initially observed by cell proliferation using Incucyte™ Zoom. Cells were grown to 70% confluence in a complete medium. The cells were treated with dose-dependent of α-MG; and then incubated in Incucyte™ Zoom at 37 °C for 24 h. Clonogenic and soft agar method was then using to examine the effect of α-MG on cell proliferation. For clonogenic assay, cells were briefly cultured in 6-well plate at 250 cells per well at 37 °C in a 5% CO2 for 24 h for clonogenic. Then α-MG was added to cultures as indicated doses and incubated at 37 °C per week. Colony growth was checked daily using a light microscope. After a week, cells were rinsed with ice-cold PBS (pH 7.2) and fixed with ice-cold methanol for 10 min. In visualized, colonies were stained with 0.1% crystal violet for 30 min. Then the plate with crystal violet destained with PBS three times. The colonies, which were formed in plates, were captured with a digital camera. For soft agar assay, the 3 mL of bottom agar solution (DMEM 1×, 10% FBS, and 0.6% agar) covered in each well of a 6-well plate. After the bottom layer become solid, 2 mL of top agar solution (DMEM, 10% FBS, and 0.3% agar) including 5 × 10⁵ cells was coated to each well. Then, these cultures were incubated at 37 °C in a 5% CO2 condition. Every 2 days, complete medium was added gradually on the cultures. Colony growth was observed daily by using a light microscope. After colony formed, colony fixed with ice-cold methanol for 10 min and stained with 0.1% crystalviolet for 30 min. To destain crystalviolet, plate washed several times each for 30 min. After per week incubation, digital camera was used to capture the formed colonies in soft agar.

Immunofluorescence assay

Cells grew on round-shaped glass coverslips for more than 24 hours and delivered in 12-well plate. The coverslips were washed with phosphate-buffered saline (PBS) containing 0.05% Tween-20. The coverslips were fixed with 4% paraformaldehyde in PBS (pH 7.2) for 10 min and afterward permeabilized for 3 min with 0.1% Triton S-100 in PBS (pH 7.2). The fixed cells were rinsed in TBS-T including 3% BSA (Cat. A1025; Biosaesang) in term of blocking for 30 min, followed by incubating 1.5 hours with particular primary antibodies. The cell were rinsed 3 times in TBS-T solution; and then incubated with Cy2-conjugated goat anti-mouse IgGs. Cellular nuclei were stained with 4′,6-diamidino-2-phenylindole (DAPI, 0.2 μg mL−1) in 3% BSA.

Immunoblotting and kinase assay

The cells were washed twice with ice-cold phosphate-buffered saline (PBS) and lysed in TLB buffer (20 mM Tris–HCL-pH 7.4, 137 mM NaCl, 2 mM EDTA, 1% Triton X-100 and 10% glycerol) supplemented with 10 μm of sodium vanadate and 1 mM of protease inhibitor cocktail (Cat. 13318000; Roche). After 30 min on ice, lysate was centrifuged at 14[thin space (1/6-em)]000 rpm for 10 min (to clarify the lysate). About 50–100 μg of total proteins was separated on a 10% or 12% sodium dodecyl sulfate-polyacrylamide gel via electrophoresis. The separated proteins were transferred to polyvinylidene fluoride (PVDF)-membrane (Cat. IPVH00010; Millipore) by wet transfer method. The transferred membranes were blocked with 3% nonfat dry milk in Tris-buffered saline with 0.05% Tween-20 (TBS-T) for 1 hour. The membranes were subsequently washed several times in TBS-T for each 5 min and incubated with horseradish peroxidase-conjugated secondary antibodies (0.1 μg mL−1; Jackson Immunoresearch Laboratories) at room temperature for 1 hour. Finally, the washed membranes were assessed using WEST-ZOL PLUS, an enhanced Chemiluminescence detection system (Cat. 16024; iNtRON).

Total lysates resuspended with beads in 20 μL kinase buffer containing 1 μg histone H1, 50 μM cold ATP. Kinase reactions were carried out for 30 min at 30 °C, and stopped by adding 20 μL of 2× SDS sample buffer. The samples were heated (100 °C, 10 min) and subjected to SDS-PAGE; histone H1 kinase activity was determined by immunoblotting analysis.

Flow cytometer analysis

The cells were harvested by trypsinization in time-dependent manner after α-MG treatment. Following washing in twice with ice-cold PBS, the cells were fixed with chilled 70% ethanol at 4 °C overnight. The fixed cells were washed in twice with PBS, incubated with RNaseA (60 μg mL−1, P4170; Sigma-Aldrich) at 37 °C for 30 min in dark room, and then analyzed by flow cytometry.

Quantitative RT-PCR

Total RNA was extracted from the cells by using easy-BLUE reagent, total RNA extraction kit (Cat. 17063; iNtRON). The easy-BLUE solution was removed by the addition of chloroform, and mRNA was triggered with isopropanol. The RNA precipitates were rinsed with 75% ethanol. The RNA quantification and purification were measured by optical density measurement at 230 nm and 260 nm using an UV spectrometer. The extracted total RNA was converted to cDNA using PrimeScript™ RT Master Mix (Cat. RR036; Takara) in accordance with the instruction of manufacturer. Gene-specific primers were calculated to intensify p16INK4a, p21, p53 and the housekeeping gene GAPDH. All amplifications were directed in a pre-mixture (20 μL) including 50 nmol μL of template and 20 nM of gene specific primer, within the following circumstances: denaturation at 95 °C for 1 min, followed by 30 cycles of 95 °C for 30 s, 58 °C for 30 s, and 72 °C for 30 s, with a final extension at 72 °C for 5 min.

Statistic analysis

Graphical data are untaken as means ± SD. Statistical significance in between two groups and between groups were examined by using one-way or two-way analysis of variance (ANOVA) following Bonferroni multiple comparisons post-test and student's t-test, respectively.

Results

Inhibition of cell proliferation by α-MG in wild-type HCT116 human colon cancer cells

To study the molecular mechanism of the effect of α-MG on cell growth in the HCT116 wild-type (WT) colon cancer cell line, we first attempted to determine the half-maximal effective concentration (EC50) of α-MG (chemical structure shown in Fig. 1A). To screen for the minimum α-MG dose required for the cytostatic effect, HCT116 cells were treated with the indicated doses of α-MG (0 to 10 μg mL−1), and their growth rate was monitored using the Incucyte™ Zoom system. Growth inhibition in the HCT116 cells was apparent starting from 4 μg mL−1 α-MG (Fig. 1B). The dose-dependent cytostatic effect of α-MG was further confirmed using both a clonogenic assay (Fig. 1C) and a soft-agar colony-forming assay (Fig. 1D), indicating that the EC50 of the α-MG effect on HCT116 cells growth appeared to be approximately 4 μg mL−1 (Fig. 1C and D). In similar, the effect of α-MG treatment on three more colon cancer cell lines with diverse epigenetic and genetic background were examined (e.g. HT-29 for triple mutation in KRAS/BRAF, PIK3K/PTEN, and TP53, RKO for double mutation in KRAS/BRAF and PI3K/PTEN as similar as the genetic background of HCT116, and SW480 for double mutation in KRAS/BRAF and TP53).16 As consistent as the results in HCT116, dose dependent cytostatic effect of α-MG on the other colon cancer cell lines were manifested (Fig. S1 and S2).
image file: c5ra00780a-f1.tif
Fig. 1 Cell proliferation effect of α-MG in human colon cancer HCT116 wild types (A) α-MG structure (B) IncuCyte™ Zoom live cell imaging system was used to determine cell proliferation effect following α-MG treatment at time- and dose-dependent manner. (C) Clonogenic assay showing the effect of cell proliferation at dose-dependent after a week of α-MG treatment. (D) Anti-proliferation effect of α-MG in HCT116 WT cells after a week indicated by soft agar assay. The results are representative of three independent experiments. *** P < 0.001 and **** P < 0.0001 versus mock group.

α-MG induces G1 arrest through the activation of stress signaling

As described previously, α-MG induces G1 arrest to inhibit cell growth in cancer cell lines but not in normal cells.14 To confirm the G1 cell cycle arrest effect of α-MG, time-dependent cell cycle profiles were monitored in the presence of 4 μg mL−1 of α-MG, revealing a significant, time-dependent accumulation of the G1 population upon α-MG treatment (Fig. 2A). Similarly, clear G1 arrest by α-MG treatment was also observed in the other colon cancer cell lines (Fig. S3). The G1 arrest induced by α-MG was closely associated with a time-dependent reduction in CDK activity, as determined by in vitro kinase assays toward histone H1 (Fig. 2B). This gradual reduction in CDK activity (Fig. 2B) suggests that α-MG treatment leads to the induction of CDKIs, thereby suppressing CDK activity. p53 and p38α are two critical stress mediators that are responsible for inducing CDKIs under stress conditions, thus serving as important tumor suppressors.11,12 Upon α-MG treatment, the phosphorylation level of the retinoblastoma (Rb) protein, which is a downstream target of CDKs and thus serves as an indicator of CDK activity, appeared to decrease in time-dependent manner. Furthermore, a gradual suppression of cyclin D1 by α-MG was closely associated with the time-dependent increase in the G1 population (Fig. 2A). Both the gradual induction of G1 arrest and the gradual reduction of CDK activity, following reduced Rb phosphorylation, may be associated to the result of increased stress signaling through the stabilization of p53, the activation of p38α and the consequent induction of p21Cip1 and p16Ink4a transcription (Fig. 2C and D).
image file: c5ra00780a-f2.tif
Fig. 2 Induction of CDKI and growth arrest by α-MG (A) cell cycle analysis of HCT116 WT and HCT116 p21−/− cells after the treatment of α-MG. Flow cytometry analysis of both cells treated with DMSO or 4 μg mL−1 of α-MG at the indicated times (left panel). Cell cycle distribution was calculated as the percentage of cells in sub-G1, G1, S, and G2/M phases (right panel) (ns = non-significant, *** P < 0.001 and **** P < 0.0001). (B) CDK kinase assay by using phospho-histone H1 was done in HCT116 WT total cell lysates following α-MG treatment in time-dependent manner. (C) HCT116 WT cells were treated with or without (4 μg mL−1) for 8, 16, and 24 h, from which lysates were prepared. Immunoblotting analyses of cell lysates probed for CDKI and grow arrest proteins. β-Actin served as an internal control. (D) The mRNA expression of CDKIs (p21) was determined by real-time PCR assay in HCT116 WT after treatment with α-MG as compared with controls (ns = non-significant, * P < 0.05, **** P < 0.0001). Relative levels of target gene expression were calculated using the CT method. GAPDH was used as a reference gene. Data are presented as means SD of double independent measurements.

α-MG inhibits cell growth in a p21-independent manner

Given that the induction of p21Cip1 after α-MG treatment occurred concurrently with the stabilization of p53 (Fig. 2C), the p53-p21 axis is likely to be responsible for α-MG-induced cell cycle arrest, as described previously.14 Consistent with this hypothesis, the cytostatic effect of α-MG was apparently abrogated in HCT116 p53-null cells (HCT116 p53−/−) compared with HCT116 WT (Fig. 3A). However, p21Cip1 transcription was proportionally increased in time-dependent manner by α-MG treatment, regardless of the p53 expression level, although p21Cip1 expression appeared to be marginally retarded within 8 hours after treatment (Fig. 3B and C). Given that the cytostatic effect of α-MG was circumvented by the loss of p53 (Fig. 3A), the induction of p21 in both HCT116 WT and HCT116 p53−/− cells (Fig. 3B) may be dispensable for the cytostatic activity of α-MG, in contrast to previous observations.14 These data suggest that p53-dependent gene regulation (either positive or negative), but not p21Cip1, is responsible for the cytostatic effect of α-MG. To confirm these unexpected results, we took advantage of the HCT116 p21−/− cells and tested the effect of α-MG on the cell cycle. As shown in Fig. 3D, p21Cip1 was not induced by α-MG treatment in HCT116 p21−/− cells. However, the lack of p21 in HCT116 p21−/− cells did not rescue the growth inhibition by α-MG treatment compared with HCT116 WT (Fig. 3E), strongly indicating that p21Cip1 is dispensable for the α-MG-induced cytostatic effect.
image file: c5ra00780a-f3.tif
Fig. 3 The α-MG inhibits cell growth of HCT116 p53−/− in p53-dependent manner. (A) HCT116 WT and HCT116 p53−/− was treated with α-MG at indicated dose showing in clonogenic assay after a week. (B) The mRNA expression of p21 was examined using real-time PCR assays in both cells after α-MG treatment (4 μg mL−1) at indicated time as compared with controls. Each indicated gene expression levels were normalized by GAPDH expression. (C) Immunoblotting of p53 and p21 proteins were performed after α-MG treatment (4 μg mL−1) of both cells at indicated time points. (D) Immunoblotting of p21 and β-actin (control) were performed after α-MG treatment (4 μg mL−1) of both HCT116 WT and HCT116 p21−/− at indicated times. (E) Cell proliferation analysis was performed by IncuCyte™ System after α-MG treatment on both cells as indicated times.

p38α activation and p16Ink4a induction is responsible for cell growth arrest by α-MG

Given that p21Cip1 is not required for cytostatic effect of α-MG, the role of the p38α-p16Ink4 axis, which are important for cell growth arrest or cellular senescence,12,17 in α-MG-mediated cytostatic activity was examined. As with p21Cip1, p16Ink4a expression was markedly increased over time following α-MG treatment (Fig. 4A). The level of active, phosphorylated p38α, which is important for p16Ink4a induction,18 showed a concurrent time-dependent increase after α-MG treatment (Fig. 4B). Of interest, increased phosphorylation of JNK by α-MG treatment, another stress activated MAPK was observed (Fig. S4). Thus, the increase in p38 activity induced by α-MG treatment may be responsible for p16Ink4a induction. To test this hypothesis, cells were pretreated with the specific p38 inhibitor SB203580 (SB), after which p16Ink4a expression was monitored in the presence of α-MG. As shown in Fig. 4C, SB treatment significantly lowered the phosphorylation level of MAPK-activated protein kinase 2 (MAPKAPK-2: MK2), a well-established downstream target of p38α,19 indicating the successful inhibition of p38α by SB treatment, while p16Ink4a expression also appeared to be dramatically suppressed by the pretreatment of SB (Fig. 4C). Moreover, whereas histone H3 phosphorylation (serine 10), an indicator of the mitotic population,20 gradually decreased over time after α-MG treatment, it remained steady with SB co-treatment, implying that the effect of α-MG on G1 arrest was significantly impaired by the pharmacological inhibition of p38α activity and the subsequent suppression of p16Ink4a (Fig. 4C). Notably, p16Ink4a suppression is frequently observed in many types of cancers, supporting the critical role of p16Ink4a in the tumor surveillance network.21 One of the well-established mechanisms of p16Ink4a suppression is the induction of Bmi-1, which directly binds the p16Ink4a promoter and suppresses its expression, thereby serving as an oncoprotein.22,23 Given that p38α phosphorylates and induces the degradation of Bmi-1,24 the activation of p38α and concurrent induction of p16Ink4a may be due to the downregulation of Bmi-1. As predicted, α-MG treatment, which increases p38α activity, significantly reduced Bmi-1 protein levels, whereas SB treatment dramatically increased Bmi-1 expression (Fig. 4C). These data suggest that p38α activity and Bmi-1 downregulation are important for α-MG-induced growth arrest through the upregulation of p16Ink4a expression.
image file: c5ra00780a-f4.tif
Fig. 4 The α-MG induces p16INK4a upregulation through p38MAPK. (A) The mRNA expression of p16INK4a was determined after α-MG treatment in HCT116 WT cells at indicated time points (** P < 0.01, *** P < 0.001, and **** P < 0.0001). (B) Total cell lysates of HCT116 WT cells was harvested at the indicated conditions. Protein expressions of pp38MAPK (Thr180/Tyr182) and β-actin (control) were determined by immunoblotting analysis. (C) CDK kinase assay by using phospho-histone H1 was done in HCT116 WT total cell lysates following α-MG treatment in time-dependent manner. (D) HCT116 WT and SB203580-treated HCT116 cells was harvested at time points after α-MG treatment by easy-BLUE™ solution for total RNA extraction. The expression of p16INK4a mRNA levels was assessed by real-time PCR assay. GAPDH was used as a reference gene.

Next, to avoid any unexpected side-effects of chemical inhibition, p16Ink4a expression was directly suppressed using siRNA, and the cytostatic effect of α-MG was then examined. The dose-dependent suppression of p16Ink4a was readily achieved (Fig. 5A). The induction of p16Ink4a expression by α-MG treatment was also completely blocked by siRNA against p16Ink4a, (Fig. 5B), suggesting that the cell model was fully established. Following the successful knockdown of p16Ink4a, the levels of Rb and histone H3 phosphorylation, which were both lowered by α-MG treatment, remained unaltered, suggesting that the cytostatic effect of α-MG occurs in a p16Ink4a-dependent manner. Finally, to confirm the effect of α-MG on G1 cell cycle arrest, the cell cycle profiles of HCT116 cells were compared with or without p16Ink4a knockdown at 24 hours after α-MG treatment. The percentage of G1 cells, which increased upon α-MG treatment (from 48.4% to 64.1%), remained similar (from 47.9% to 45.7%) after p16Ink4a knockdown. These data clearly indicate that the G1 cell-cycle arrest caused by α-MG treatment is caused by the induction of p16Ink4a.


image file: c5ra00780a-f5.tif
Fig. 5 The siRNA direct against p16INK4a induces cell cycle progression under α-MG treatment. (A) HCT116 WT cells was transfected with siRNA p16INK4a at indication condition for 24 h. Real-time PCR assay was used to determined the mRNA expression of p16INK4a with relative to GAPDH reference gene (B) negative controls (N.C) and siRNA p16INK4a-transfected HCT116 WT cells were treated or without α-MG (4 μg mL−1) for 24 h. Then total RNA was extracted by easy-BLUE™ solution. The p16INK4a expression was examined by real-time PCR. (C) As same as (B) conditions, cells was harvested to get total lysates, then performed in immunoblotting to observe the expression of phospho-RB, p16, phospho-histone H3 and β-actin. (D) HCT116 WT-transfected N.C and HCT116 WT-transfected siRNA p16INK4a was treated with α-MG as indicated time points. Real-time PCR assay was used to examine the level of p16INK4a expression in relative to GAPDH reference gene. (E) Cell cycle analysis of HCT116 WT and siRNA p16INK4a-transfected HCT116 WT cells after the treatment of α-MG. Flow cytometry analysis of both cells treated with DMSO or 4 μg mL−1 of α-MG for 24 h (left panel). Cell cycle distribution was calculated as the percentage of cells in apoptosis, G1, S, and G2/M phases (right panel) (ns = non-significant, *** P < 0.001 and **** P < 0.0001).

Discussion

The phosphorylation-induced stabilization of p53, along with its dissociation from Mdm2 and subsequent induction of p21Cip1 expression, is a well-characterized event involved in the induction of stress responses such as growth arrest under a number of stress conditions.25 Therefore, the anti-cancer effects of a variety of natural compounds have been addressed through the p53-p21 axis.26,27 The growth-inhibition effect of α-MG has also been examined via the upregulation of p53 (ref. 28) or p21.29 However, none of these studies has revealed any distinct involvement of the p53-p21 axis in α-MG-induced cell cycle arrest. Although p21Cip1 is one of the principal effector proteins for p53-dependent G1 and G2 arrest,30 p21Cip1 can serve as either a positive or negative regulator of the cell cycle independent of p53.31

In this study, we found that α-MG inhibited the proliferation of HCT116 cells in a dose- and p53-dependent manner (Fig. 3). Interestingly, HCT116 cells lacking the p53 gene (HCT116 p53−/−), which also evaded α-MG-induced cell growth inhibition, still induced p21Cip1 expression (Fig. 3B and C). These results suggest that the induction of p21Cip1 by α-MG may not contribute to its cytostatic effect, contrary to previous reports.14 Using p21-null cells from the same genetic background (HCT116 p21−/−), we were able to confirm that p21Cip1 expression is dispensable for α-MG-induced growth arrest (Fig. 3D and E).

Aside from the p53-p21 axis, the activation of p38α and the subsequent induction of p16Ink4a also play a critical role in growth arrest.12,17 Notably, p16Ink4a plays a crucial role as a tumor suppressor due to its potent negative regulation of cell proliferation, and nearly 50% of all cancer inactivate p16Ink4a gene expression, including head and neck, esophagus, biliary tract, liver, lung, bladder, colon and breast carcinomas, as well as leukemia, lymphomas, and glioblastomas.32,33 One mechanism of p16Ink4a inactivation in cancer involves the induction of proto-oncogenes such as T box proteins (Tbx2) and polycomb proteins (Bmi1, Cbx7, Mel18), which directly repress p16Ink4a.34 Of these, Bmi-1 in particular is overexpressed in human colorectal cancer, and its expression levels are correlated with p16Ink4a suppression.35 Once a tumor suppressor is repressed by oncogenic induction, thereby leading to tumorigenesis, the restoration of the particular tumor suppressor would serve as a valid approach for targeting that particular cancer. Such a strategy has been extensively investigated for the reactivation of p53 in cancer.36 Similarly, salvaging p16Ink4a expression has been shown to be highly effective in many types of cancers, such as pancreatic tumor,37 human laryngeal squamous cell carcinoma,38 nasopharyngeal carcinoma,39 glioblastoma cells40 and even lung metastasis.41 Given that Bmi-1 is directly phosphorylated by p38α and undergoes protein degradation,24,42 the activation of p38α and consequent downregulation of Bmi-1 could be a potential therapeutic approach to restore p16Ink4a in colon cancers where Bmi-1 induction is responsible for p16Ink4a repression.35

In the present study, we used a pharmacological inhibitor of p38α and p16 siRNA to demonstrate that the activation of p38α is responsible for the induction of p16Ink4a and plays an important role in the α-MG-mediated cytostatic effect (Fig. 4 and 5). Thus, the therapeutic application of α-MG may be more effective in treating cancers with reduced p16Ink4a expression due to the induction of Bmi-1.

Conclusions

In summary, we found that α-MG induced G1 cell cycle arrest in HCT116 colon cancer cell line in p38α-p16Ink4a dependent manner. Given that Bmi-1 serves as an oncoprotein, which abrogates p16Ink4a dependent tumor surveillance, downregulation of Bmi-1 by α-MG through p38α activation and induction of p16Ink4a dependent G1 arrest would be important to target Bmi-1 expressing colon cancers. This study suggests that α-MG could be further applied for a potential dietary supplement in the treatment of human colon cancer.

Conflict of interest

The authors declare no competing financial interests.

Acknowledgements

This work was supported by the National Research Foundation of Korea (NRF-2012055464, 2009-0093822 and 2011-0030043) grant funded by the Korea government (Minister of Science, Information and Communications Technology, and Future Planning).

References

  1. J. Eder, R. Sedrani and C. Wiesmann, Nat. Rev. Drug Discovery, 2014, 13, 577–587 CrossRef CAS PubMed .
  2. H. F. Ji, X. J. Li and H. Y. Zhang, EMBO Rep., 2009, 10, 194–200 CrossRef CAS PubMed .
  3. J. Yuan, Y. Wu and G. Lu, Oncol. Lett., 2013, 5, 1958–1964 CAS .
  4. R. Kaomongkolgit, Odontology, 2013, 101, 227–232 CrossRef CAS PubMed .
  5. J. J. Johnson, S. M. Petiwala, D. N. Syed, J. T. Rasmussen, V. M. Adhami, I. A. Siddiqui, A. M. Kohl and H. Mukhtar, Carcinogenesis, 2012, 33, 413–419 CrossRef CAS PubMed .
  6. D. Hanahan and R. A. Weinberg, Cell, 2000, 100, 57–70 CrossRef CAS .
  7. M. Malumbres and M. Barbacid, Nat. Rev. Cancer, 2009, 9, 153–166 CrossRef CAS PubMed .
  8. S. van den Heuvel, WormBook: the online review of C. elegans biology, 2005, pp. 1–16 Search PubMed .
  9. W. Y. Kim and N. E. Sharpless, Cell, 2006, 127, 265–275 CrossRef CAS PubMed .
  10. E. Natarajan, J. D. Omobono 2nd, Z. Guo, S. Hopkinson, A. J. Lazar, T. Brenn, J. C. Jones and J. G. Rheinwald, Am. J. Pathol., 2006, 168, 1821–1837 CrossRef CAS PubMed .
  11. K. Itahana, G. Dimri and J. Campisi, Eur. J. Biochem., 2001, 268, 2784–2791 CrossRef CAS .
  12. J. Han and P. Sun, Trends Biochem. Sci., 2007, 32, 364–371 CrossRef CAS PubMed .
  13. D. V. Bulavin, C. Phillips, B. Nannenga, O. Timofeev, L. A. Donehower, C. W. Anderson, E. Appella and A. J. Fornace Jr, Nat. Genet., 2004, 36, 343–350 CrossRef CAS PubMed .
  14. H. Kurose, M. A. Shibata, M. Iinuma and Y. Otsuki, J. Biomed. Biotechnol., 2012, 2012, 672428 Search PubMed .
  15. M. Choi, Y. M. Kim, S. Lee, Y. W. Chin and C. Lee, Virus Genes, 2014, 49, 208–222 CrossRef CAS PubMed .
  16. D. Ahmed, P. W. Eide, I. A. Eilertsen, S. A. Danielsen, M. Eknaes, M. Hektoen, G. E. Lind and R. A. Lothe, Oncogenesis, 2013, 2, e71 CrossRef CAS PubMed .
  17. C. M. Beausejour, A. Krtolica, F. Galimi, M. Narita, S. W. Lowe, P. Yaswen and J. Campisi, EMBO J., 2003, 22, 4212–4222 CrossRef CAS PubMed .
  18. D. Bulavin and A. Fornace Jr, Adv. Cancer Res., 2004, 92, 95–118 CrossRef CAS .
  19. M. J. Rane, P. Y. Coxon, D. W. Powell, R. Webster, J. B. Klein, W. Pierce, P. Ping and K. R. McLeish, J. Biol. Chem., 2001, 276, 3517–3523 CrossRef CAS PubMed .
  20. C. Prigent and S. Dimitrov, J. Cell Sci., 2003, 116, 3677–3685 CrossRef CAS PubMed .
  21. C. J. Sherr, Nat. Rev. Mol. Cell Biol., 2001, 2, 731–737 CrossRef CAS PubMed .
  22. L. Cao, J. Bombard, K. Cintron, J. Sheedy, M. L. Weetall and T. W. Davis, J. Cell. Biochem., 2011, 112, 2729–2741 CrossRef CAS PubMed .
  23. J. J. Jacobs, K. Kieboom, S. Marino, R. A. DePinho and M. van Lohuizen, Nature, 1999, 397, 164–168 CrossRef CAS PubMed .
  24. J. Kim, J. Hwangbo and P. K. Wong, PLoS One, 2011, 6, e16615 CAS .
  25. J. Campisi, Trends Cell Biol., 2001, 11, S27–S31 CrossRef CAS .
  26. R. Gomathinayagam, S. Sowmyalakshmi, F. Mardhatillah, R. Kumar, M. A. Akbarsha and C. Damodaran, Anticancer Res., 2008, 28, 785–792 CAS .
  27. A. Shih, F. B. Davis, H. Y. Lin and P. J. Davis, J. Clin. Endocrinol. Metab., 2002, 87, 1223–1232 CrossRef CAS PubMed .
  28. R. Kaomongkolgit, N. Chaisomboon and P. Pavasant, Arch. Oral Biol., 2011, 56, 483–490 CrossRef CAS PubMed .
  29. J. J. Wang, W. Zhang and B. J. Sanderson, BioMed Res. Int., 2013, 2013, 715603 Search PubMed .
  30. M. Xia, D. Knezevic and L. T. Vassilev, Oncogene, 2011, 30, 346–355 CrossRef CAS PubMed .
  31. T. Abbas and A. Dutta, Nat. Rev. Cancer, 2009, 9, 400–414 CrossRef CAS PubMed .
  32. W. H. Liggett Jr and D. Sidransky, J. Clin. Oncol., 1998, 16, 1197–1206 CAS .
  33. C. Romagosa, S. Simonetti, L. Lopez-Vicente, A. Mazo, M. E. Lleonart, J. Castellvi, S. Ramon and Y. Cajal, Oncogene, 2011, 30, 2087–2097 CrossRef CAS PubMed .
  34. P. Agarwal, M. Sandey, P. DeInnocentes and R. C. Bird, J. Cell. Biochem., 2013, 114, 1355–1363 CrossRef CAS PubMed .
  35. J. H. Kim, S. Y. Yoon, C.-N. Kim, J. H. Joo, S. K. Moon, I. S. Choe, Y.-K. Choe and J. W. Kim, Cancer Lett., 2004, 203, 217–224 CrossRef CAS PubMed .
  36. G. Selivanova and K. G. Wiman, Oncogene, 2007, 26, 2243–2254 CrossRef CAS PubMed .
  37. J. Zhang, M. Wang, S. He, Y. Liu and B. Zhang, Zhonghua Waike Zazhi, 2000, 38, 457–459 CAS .
  38. S. X. Liu, S. Q. Tang and C. Y. Liang, Zhonghua Erbi Yanhouke Zazhi, 2003, 38, 35 Search PubMed .
  39. A. A. Mäkitie, C. MacMillan, J. Ho, W. Shi, A. Lee, B. O'Sullivan, D. Payne, M. Pintilie, B. Cummings and J. Waldron, Clin. Cancer Res., 2003, 9, 2177–2184 Search PubMed .
  40. P. Agarwal, F. M. L. Kibir, P. DeInnocentes and R. C. Bird, Tumor suppressor gene p16/INK4a/CDKN2A and its role in cell cycle exit, differentiation, and determination of cell fate, 2012.
  41. O. Kim, M. Park, H. Kang, S. Lim and C. T. Lee, Proteomics, 2003, 3, 2412–2419 CrossRef PubMed .
  42. A. Sato, M. Okada, K. Shibuya, E. Watanabe, S. Seino, Y. Narita, S. Shibui, T. Kayama and C. Kitanaka, Stem Cell Res., 2014, 12, 119–131 CrossRef CAS PubMed .

Footnotes

Electronic supplementary information (ESI) available. See DOI: 10.1039/c5ra00780a
These authors contribute equally.

This journal is © The Royal Society of Chemistry 2015