Preparation, characterization and antifouling properties of polyacrylonitrile/polyurethane blend membranes for water purification

Swapna Rekha Panda and Sirshendu De*
Department of Chemical Engineering, Indian Institute of Technology, Kharagpur, India. E-mail: sde@che.iitkgp.ernet.in; Fax: +91-3222-255303; Tel: +91-3222-283926

Received 13th January 2015 , Accepted 17th February 2015

First published on 17th February 2015


Abstract

Casting of flat sheet polyacrylonitrile (PAN)/polyurethane (PU) blend membranes was reported for the first time in this work. PU makes the membrane more porous. Ternary phase diagram indicates that the addition of PU increases the thermodynamic instability of the blend. The average pore size of the membrane increased from 11 nm to 18 nm for pure PAN and the PAN/PU blend membranes. The membranes were characterized in terms of permeability, porosity, molecular weight cut-off (MWCO), contact angle, mechanical strength, scanning electron microscope (SEM), atomic force microscope (AFM), differential scanning calorimetry (DSC) and Fourier transform infrared spectroscopy (FTIR). The AFM images indicated that the surface roughness of the membrane increased with an increase in the concentration of PU. Addition of PU also imparted hydrophilicity to the membranes. FTIR and DSC measurements confirm the polymer compatibility of the PAN/PU blend. The PAN/PU blend 70/30 membrane exhibited the maximum antifouling characteristics with a 99% flux recovery ratio associated with the complete removal of turbidities and organic matter.

1 Introduction

Polyurethane (PU) is one of the most versatile, biocompatible, biodegradable and viscoelastic polymers reported with two alternating hard and soft segments.1,2 The hard segment includes aliphatic or aromatic diisocyanates, diols or diamine chain extenders. The soft segment consists of dihydroxy or diamine terminated reactive oligomers, such as poly-ethers, poly-esters, poly-butadienes and poly-acrylates, with varying molecular weight.2 The intermolecular hydrogen bonding between the hard crystalline and soft amorphous parts with the carbamate (–NH–CO–O–) network offers resistance to pH and temperature conditions and makes PU a suitable material for membrane preparation.3 Polyurethane membranes were used in pervaporation industries towards the separation of aliphatic hydrocarbons and water vapor permeability studies due to its flexible permeability and diffusivity.4–6 PU based membranes have been investigated for biomedical applications, drug delivery systems, their antimicrobial properties and in antifouling studies.7–12 PU membranes with fillers, such as zeolite and silver doped fly ash, have been used for treating textile effluents and have been shown to remove arsenic along with microorganisms.13,14 Fabrication and characterization of PU based membranes has been reported by other researchers.15–17

On the other hand, polyacrylonitrile (PAN) is considered to be a good polymer in membrane industry due to its commercial availability, good thermal stability, resistance against organic solvents and its improved chemical stability against chlorine, sodium hypochlorite, sodium hydroxide.18–20 Despite its brittleness in dry conditions, PAN membranes are known as low fouling due to their hydrophilicity when compared to polysulfone (PSF), polyethersulfone (PES), polyethylene (PE) and polypropylene (PP).21

Modification of membranes by polymer blending has long been a subject of intensive investigation in both industry and academia.22 The key features of PU blended membranes reported in the literature are summarized in Table 1.

Table 1 A summary of previous reports based on PU blended membranes for various applications
Reference Polymer (wt%)/solvent (wt%)/additive (wt%)/type of membrane MWCO (kDa)/avg. pore size (nm) Specific water flux l m−2 h−1 bar−1 Other characterization
Sivakumar et al. 1998, 23; 1999, 24; 2000, 25 CA, CA/PU blend (17.5)/DMF 82.5/CA/PU (85[thin space (1/6-em)]:[thin space (1/6-em)]15) blend/DMF PVP (0–2.5)/CA/PU (85[thin space (1/6-em)]:[thin space (1/6-em)]15) blend/DMF PVP (2.5–7.5)/flat sheet 20–69/NA > 69/4–4.5/NA 20–69, 69/NA 4–28.5 7–46 7–62.5 Water content/SEM
Malaisamy et al. 2002, 27 PU/SPSF blend (17.5)/DMF/PEG 600 (0–7.5)/flat sheet 19–150/NA 6–20/NA 0.9–57.5 Porosity/SEM.
Latha et al. 2005, 28 PU/CPSF blend (17.5) DMF/PEG 600 (0–10)/flat sheet NA/NA 5.3–54 Permeability/SEM
Yuan et al. 2007, 29 PVDF/TPU blend (16) DMAc/PVP K30 (0–10)/hollow fiber NA/NA 9–440 Cloud point/DSC/porosity crystallinity/SEM/FTIR-ATR
Amado et al. 2005, 30 PU and PANI blend (10–20)/pTSA CSA/flat sheet NA/NA NA/NA Swelling/electrical conductivity/TGA/FTIR-ATR/SEM
Zavastin et al. 2010, 31 PU/CA blend (8[thin space (1/6-em)]:[thin space (1/6-em)]7) acetone/--/flat sheet NA/860 NA/NA Swelling/porosity/thermal analysis/TGA/FTIR-ATR/SEM
Velu et al. 2011, 32 PSF/PU blend (17.5) DMF, DMAc/--/flat sheet NA/4.3–10.7 3.3–13.1 Porosity/water content/pore size distribution
Wu et al. 2013, 33 PVDF/PU blend (10 wt%) DMAc/--/flat sheet NA/NA NA/NA degree of swelling/FTIR/SEM/different solvents
Present study PAN/PU blend (20) DMF/----/flat sheet 4–130/3–20 7.5–140 Cloud point/phase diagram/permeability/contact angle/porosity/mechanical property/SEM/AFM/DSC/FTIR BET measurement/turbid water application


Sivakumar et al.23–25 showed that PU enhanced the pure water flux by the formation of macrovoids, which results in a higher molecular weight cut-off (MWCO) in cellulose acetate (CA)/PU blend membranes. Nair et al.26 showed a compatible system from the morphological changes, whereas the glass transition temperature indicated semi-compatible behavior with confirmed interpenetrating polymer networks (IPN) formation on the interpenetration of PU with the polyacrylamide (PAM) network. The work of Malaisamy et al.27 suggested that an increased sulfonated polysulfone (SPSF) concentration in the PU/SPSF blend enhanced the membrane pore size and MWCO. In addition, the use of a PEG additive also controls the morphology, permeation characteristics and selectivity of the blend membranes. Latha et al.28 indicated that the pore size increased with an increase in the concentration of carboxylated polysulfone (CPSF) in a CPSF/PU blend and the role of polyethylene glycol (PEG) 600 was crucial in alternating the structural characteristics of the blend membranes.

Yuan et al.29 showed that the flux was enhanced with the addition of thermoplastic polyurethane (TPU) and the crystallinity decreased in the polyvinylidenefluoride (PVDF)/TPU blend. In addition, a lower concentration of PVP (<3 wt%) in the blend acted as a pore enhancer and a higher concentration of PVP (>10 wt%) in the PVDF/TPU casting solution suppressed macrovoid formation. Amado et al.30 verified the distinguished morphological difference with the addition of polyaniline (PANI) in the PU/PANI blend with no significant improvement in transport and electrical properties of the membranes with the use of additives such as p-toluene sulfonic acid (pTSA) and camphor sulfonic acid (CSA). However, a 10–20% increase in Zn extraction when compared to the commercial Nafion 450 membrane was reported. Zavastin et al.31 reported the successful application of PU/CA blend membranes in wastewater treatment in the textile industry. Velu et al.32 reported the effect of solvents and PU concentration in the PSF/PU blend membrane. The flux and protein rejection were increased for the blend ultrafiltration (UF) membranes with dimethylacetamide (DMAc) when compared to dimethylformamide (DMF) as a solvent. Wu et al.33 reported blended PVDF/PU membranes that show improved pervaporation performance with respect to pure PU membranes during phenol wastewater treatment. Exploration of membrane based technology in blood purification therapy was reported by several authors in the recent past.34–36 In addition, better antifouling and antithrombotic properties using PES/PU composite membranes during dialysis was carried out by Yin et al.37 A recent report by Roy et al.38 showed that a PSF/PVP/PEG blend membrane was found to have adequate cyctocompatibility and blood compatibility for hemodialysis.

From the above literature review, it is evident that the use of the hydrophilic polymer, PU as a blend in the casting solution has been proved to be an effective method of improving the permeability and selectivity of ultrafiltration membranes. As observed in Table 1, there is no report available on the performance of PAN/PU blend membranes. The present work was undertaken to fill this gap. The effect of the PAN/PU blend ratio on membrane morphology, permeability, molecular weight cut-off (MWCO), hydrophilicity, porosity and mechanical strength was studied. The polymer compatibility was confirmed using Fourier transform infrared (FTIR) spectroscopy, spectral analysis and DSC (thermal analysis) measurements. The antifouling characteristics of the membrane were evaluated using filtration data of turbid water.

2 Experimental

2.1 Materials

PAN homopolymer with a molecular weight 50 kDa was obtained from M/s, Technorbital Advanced Materials Pvt. Ltd., Kanpur, India, and was used as the base polymer. Polyurethane (PU) was obtained from M/s, Lubrozol, Gujarat, India. The solvent DMF was purchased from M/s, Merck (India) Ltd., Mumbai, India. PEG with an average molecular weight of 200 Da, 400 Da, 600 Da, 4 kDa, 20 kDa and 35 kDa were supplied by M/s, S. R. Ltd., Mumbai, India. Dextran (average molecular weight: 70 kDa) and PEG with an average molecular weight of 100 kDa and 200 kDa were procured from M/s, Sigma Chemicals and M/s, Aldrich Chemicals, USA, respectively. These neutral solutes were used to evaluate the MWCO of the cast membranes. Distilled water was used as the non-solvent in the coagulation bath. All the chemicals used were of analytical grade and used without further purification.

2.2 Ternary phase diagram

The ternary phase diagram was generated using cloud point data obtained from the titration method.39 Various polymer blends with different concentrations were prepared in DMF in a sealed conical flask. A homogenous polymer solution was obtained using magnetic stirring for 8 h at 60 °C. For titration, distilled water with 0.05 ml accuracy was poured dropwise into the polymeric solution under continuous stirring at 30 °C. The dropwise addition of distilled water was continued till the entire solution turned turbid. It was placed for another 30 min to check whether the turbid solution turned clear. If the solution turned clear, more water was added till the persistence of turbidity continued for 30 min. The weight of water was recorded for every composition to plot the cloud point curve.

2.3 Determination of the casting solution viscosity

The viscosity of the polymer solution was measured using a rheometer (model: Physica MCR 301, supplied by M/s, Anton Parr, Austria). The temperature of the unit was maintained at 25 °C. The viscosity of the casting solution was determined with a shear rate in the range of 50–500 s−1. The composition of the casting solution and the blend ratio of cast membrane are given in Table 2.
Table 2 Membrane composition and casting conditions for the PAN/PU blend membranesa
Membrane blend: membrane code Blend composition (w/w) DMF (wt%) Viscosity (Pa s) at 298 °K (216 s−1 shear rate)
PAN (%) PU (%)
a Total polymer concentration 20 wt%, gelation bath temperature = 25 ± 5 °C; casting temperature 25 ± 5 °C; solvent evaporation time 30 s.
PAN: 100/0 (control membrane) 100 0 80 23.5
PAN/PU: 90/10 90 10 80 21.4
PAN/PU: 80/20 80 20 80 17.8
PAN/PU: 70/30 70 30 80 13.4
PAN/PU: 60/40 60 40 80 8.84
PU 0 100 80 1.52


2.4 Membrane preparation

Pure PAN, PU and PAN/PU blend membranes were prepared on a flat sheet using a phase inversion method. The composition of the casting solution is given in Table 2. The steps involved in membrane fabrication are as follows: a fixed amount of polymer was added to DMF heated at 40 °C and dissolved by stirring with the help of a mechanical stirrer for 6–8 h to ensure complete dissolution of the polymer. During stirring, the lid of the container was kept closed to prevent the loss of solvent due to evaporation. The prepared solution was placed still for a few hours without stirring at room temperature to remove air bubbles. In the first step of casting the membranes, non-woven polyester fabric of thickness 118 ± 22.8 μm (product number TNW006013, supplied by M/s, Hollytex Inc., New York, USA) was attached to a clean glass plate using adhesive tape. The polymer solution was cast on a non-woven polyester fabric using a casting knife with an adjustable thickness fixed at 200 μm. A uniform casting time was maintained for all the casting solutions. The entire composite was immediately immersed in a precipitation bath containing distilled water at room temperature to initiate the non-solvent induced phase separation. The membrane was allowed to be in the precipitation bath for 10 min, and then it was transferred to another container with fresh distilled water for 24 h to remove the excess solvent. After that, the membrane was ready to be tested.

2.5 Antifouling test of the blend membranes with turbid water

The applicability of the blend membranes were tested with turbid water at a feed concentration of 500 NTU. The feed sample was prepared by dissolving some amount of local mud in water followed by filtration with a cloth filter to remove the coarse particles. The experiments were conducted in a stirred continuous ultrafiltration cell at 552 kPa. The details of the experimental set up are available.40 The cumulative volume of permeate was noted with the time of filtration. The permeate flux was then evaluated from the slope of cumulative volume versus time. Steady state permeates samples were analyzed using a turbidity meter supplied by M/s, EI Products, Parwanoo, India (Model: 331). The absorption value of the permeate sample was also measured using a UV-VIS spectrophotometer (Perkin Elmer, Connecticut, USA) at 254 nm for detecting the presence of humic acid content in water. Each experiment was repeated three times and the average value was reported.

Fouling is a major drawback of UF membranes that leads to flux decline accompanied with an unexpected reduction in the overall efficiency and economic viability of the membranes. The antifouling characteristics of the blended UF membranes were quantified with the help of two parameters i.e., flux recovery (FRR) and flux decline ratio.41 Filtration by all the membranes was carried out for 1 h. Before taking out the experimental run with turbid feed, the pure water flux of the respective membranes was measured at 552 kPa. At the end of 1 h the cell was emptied. The membrane and the cell were washed thoroughly with distilled water. After that, the pure water flux of the membrane was measured again, which is denoted by Jw1. The flux recovery ratio (FRR) was calculated using the following equation:41

 
image file: c5ra00736d-t1.tif(1)

The flux decline ratio (FDR) was defined as:

 
image file: c5ra00736d-t2.tif(2)
where, J0p and Jpt are the initial flux and final permeate flux at the end of 1 h, respectively. The FDR value signifies the reduction in permeate flux during the experiment. A good antifouling membrane has a high FRR and low FDR.

2.6 Characterization of the membranes

The following characterizations were performed for the prepared membranes.
2.6.1 Scanning electron microscopy (SEM). SEM images were analyzed using a scanning electron microscope (supplied by JEOL, Japan, model ESM-5800). First, the membrane was cut into small pieces, dried using a filter paper, dipped in liquid nitrogen for 1 minute and then fractured. The fractured samples were dried under vacuum. The samples were gold sputtered, and then mounted on a sample pad to observe the cross section and top view of the membranes.
2.6.2 Membrane permeability. Measurement of the membrane permeability was carried out in a batch cell.40 The effective area of the membrane in the module was 34 cm2. First, the cell was filled with 500 ml of distilled water and the membranes were compacted at 690 kPa for 3 to 4 h. The permeate flux was calculated by:
 
image file: c5ra00736d-t3.tif(3)
where, Q is the volumetric flow rate of permeating water, A is the effective membrane area and Δt is the sampling time. Next, the steady state permeate flux was noted at five values of transmembrane pressure drop. A plot of Jw with transmembrane pressure drop resulted into a straight line through the origin. From the slope of this curve, the membrane permeability was estimated.
2.6.3 Porosity (ε) and contact angle (CA). Membrane porosity was measured by the mass loss of wet membrane after drying. The membrane, soaked with distilled water was weighed after removing superficial water with filter paper. Then, the wet membrane was placed in an air-circulating oven at 60 °C for 24 h, and then further dried in a vacuum oven before measuring the dry weight until a constant mass was obtained. From the two weights (wet sample weight, w0 and dry sample weight, w1), the porosity of the membranes was calculated using the following equation:41
 
image file: c5ra00736d-t4.tif(4)
where, ε is the membrane porosity, A is the membrane surface area, l is the membrane thickness and ρw is the density of water. The membrane porosity of each sample was measured three times and the average values were reported. The contact angle was measured by a Goniometer (supplied by Labline instrument, Mumbai, India, manufactured by Rame-Hart instrument Co., New Jersey, USA; model number: 200-F4) using the sessile drop method. The contact angle was measured at six different locations of the membrane and the average value was reported.
2.6.4 Molecular weight cut off (MWCO) of the membrane. Solute rejection measurements were carried out in a stirred batch cell. Solutions were prepared at 10 kg m−3 using different neutral solutes, namely, PEG of different molecular weights, 400 Da, 4 kDa, 6 kDa, 10 kDa, 20 kDa, 35 kDa, 100 kDa and 200 kDa, and dextran 70 kDa. The experiments were conducted at 138 kPa pressure and at 2000 rpm. The permeate samples were analyzed using a refractometer (Abbe type, supplied by M/s, Excel International Ltd., Kolkata). The rejection values were plotted against the molecular weight of the solutes in a semi-logarithmic curve. The molecular weight corresponding to 90% rejection was estimated as the MWCO of the membrane. After the experiment, the membrane was thoroughly rinsed with distilled water and its original permeability was restored. The rejection was calculated using eqn (5) given below:
 
image file: c5ra00736d-t5.tif(5)
where, Cf and Cp are the concentration of solute in the feed and permeate, respectively.
2.6.5 Measurement of the average pore size. The average pore radius of the membranes was evaluated using eqn (6). In this method, the MWCO data was used to find out the average pore radius of the membranes.42
 
rs = 16.73 × 10⁻³ (MW)0.557 (6)

In the above equation, rs is in nm. MW is in Da. The pore radius of all the membrane samples was also determined using the Brunauer–Emmett–Teller (BET) instrument supplied by Quantachrome instruments, Florida, USA (model no. AUTOSORB-1). The BET analysis was carried out and the average pore diameter of the membranes was determined by degassing the sample at 65 °C prior to conducting the measurements.

2.6.6 Atomic force microscopy (AFM). The surface morphology of the membranes was investigated using an atomic force microscope (AFM); (Model 5100, Agilent Tech, USA). Membrane samples of size (1 × 1 cm) were placed in a glass substrate and surface images were taken in a scan area of 5 micron square area. The surface roughness of each membrane sample was measured and reported in terms of the root mean square (RMS) roughness.
2.6.7 Fourier transform infrared spectroscopy (FTIR) analysis. In order to investigate the chemical changes that occurred between the original PAN and PU membrane, as well as hydrophilically modified PAN/PU blend membranes at different blend ratios, FTIR spectroscopy (supplied by M/s, Perkin Elmer, Connecticut, USA; model: Spectrum 100) analysis was performed. The transmittance value at specific wavelength signifies the presence of the functional groups present in the respective membrane.
2.6.8 Differential scanning calorimetry. The thermal analysis of the pure and blended membranes was carried out in a differential scanning calorimeter (procured from M/s, TA instrument Ltd., New castle, Delaware USA; model DSC Q20). The entire experiment was carried out in a two step heating cooling cycle in an nitrogen atmosphere. The analysis was carried out utilizing around 5 mg of the membrane samples placed in an aluminum pan and heated from 0 to 350 °C at a heating rate of 10 °C min−1.
2.6.9 Mechanical properties of the membranes. The tensile strength, percentage elongation and elastic modulus of all cast membranes were determined by a universal electronic strength measuring instrument (procured from M/s, Tinius Olsen Ltd., Redhill, England of model H50KS). Measurements were carried out at room temperature and at a strain rate of 10 mm min−1. The reported value was the average of at least five samples.

3 Results and discussion

3.1 Polymer–solvent–non-solvent interactions

Two different polymers PAN and PU were used to prepare the PAN/PU blend membranes. Fig. 1(a) clearly shows the structure of these two polymers. The relative affinity of the polymer and solvent can be estimated using the Hansen solubility parameter denoted by δ, which was described as the square of cohesive energy density given by eqn (7).
 
δ2 = δp2 + δH2 + δd2 (7)
δ includes a polar component due to the dipole–dipole interactions (δp), hydrogen bonding forces component (δH) and a dispersive force component (δd).43 The materials having similar values for the Hansen solubility parameter (δ) are likely to have higher miscibility. The difference in the solubility parameter for the polymer–solvent interaction can be calculated using the equation given below:43
 
image file: c5ra00736d-t6.tif(8)
where, the symbols p, d, h indicate the polar, dispersive and hydrogen bonding components, respectively, and the symbols P and S denotes the “polymer” and “solvent”, respectively. The above equation can be used to predict the relative affinity of the solvent with the polymers for both the systems i.e., PAN/DMF and PU/DMF. The smaller the value of Δδt, the stronger is the polymer–solvent interaction. The solubility parameters of the polymers, solvent and non-solvent are listed in Table 3.3 It was found that the value of Δδt for the PAN-DMF pair (4.84) was smaller than that found for the PU–DMF system (10.62). This indicates that the miscibility of PAN in DMF was better than that of PU. The hydrogen bonding component, δH value (Table 3) of PAN and PU are close to each other, suggesting the possible formation of hydrogen bonds between the two polymers in the blend. Fig. 1(b) shows the possible H-bonding interactions between the functional groups of (C[triple bond, length as m-dash]N) in PAN and the urethane groups in polyurethane.

image file: c5ra00736d-f1.tif
Fig. 1 The molecular structure of the polymers are shown: (a) (i) polyacrylonitrile (PAN); (ii) polyurethane (PU); (b) possible hydrogen (H) bonding between the PU chains and PAN polymer in the blend membranes: (i) between the hard segments of PU and PAN; (ii) between the soft segments of PU and PAN.
Table 3 The solubility parameters (MPa)1/2 of the polymers, solvent and non-solventa
Chemicals δd δp δH δ
a The parameters shown in Table 3 are extracted from the literature.3
PAN 21.70 14.10 9.1 27.43
PU 18.45 3.66 9.90 21.25
DMF 17.4 13.7 11.3 24.8
Water 15.5 16.0 42.3 47.8


3.2 Viscosity of the casting solution and ternary phase diagram

The viscosity of the casting solution was a key factor for membrane formation during the phase inversion process. It was believed that a higher solution viscosity reduces the mobility of the polymeric chain during phase inversion affecting the precipitation kinetics and therefore the membrane morphology.44 The total polymer concentration for all the cast membranes was maintained at 20 wt%. The viscosity data shown in Table 2 reflects that (increasing the percentage of PU from 10% to 40% in the PAN/PU blend) for various blend ratios 90/10 (10% PU), 80/20, (20% PU), 70/30 (30% PU) and 60/40 (40% PU) the viscosity decreases due to the viscoelastic and rubber like properties of the PU polymer.2–4 The highest viscosity was recorded for the pure PAN polymer, which is in agreement with the literature.45

The thermodynamic stability of the casting solution was interpreted using a ternary phase diagram. The ternary diagram explains the polymer–solvent–non-solvent interaction in a casting solution. The isothermal phase diagram of the PAN/DMF/water, PU/DMF/water and PU-blend-PAN/DMF/water systems is shown in Fig. 2.


image file: c5ra00736d-f2.tif
Fig. 2 Experimental cloud point data for pure PAN and the PAN/PU blend polymers in a polymer/DMF/water system.

The binodal curves for six cast membranes with different compositions were determined based on the cloud point measurements. A binodal curve in a ternary diagram divides the triangle into a homogenous single phase region and a non-homogenous two phase region (solid-polymer rich phase, liquid-polymer lean phase).46 It was observed from Fig. 2 that the binodal concave curve shifts towards the polymer–solvent axis for the PAN/DMF/water system. Hence, system precipitation was reached by the addition of a lower content of water. The present result is in agreement with the earlier report by Tan et al.47 Addition of PU from 10% to 30%, gradually shifts the binodal curve towards the right. The curvature of the binodal curve decreases with an increasing concentration of PU in the blend and it finally becomes almost linear for pure PU. The curve resembles pure PAN qualitatively up to 30% PU. However, further addition of PU (40% and above) reduces the thermodynamic stability of the casting solution, leading to a linear shaped binodal curve. It was interesting to note that the viscosity of the casting solution was reduced with an increase in the PU concentration. This may be due to the poor interaction between PU and DMF, as found from the solubility parameters (Table 3).

Therefore, DMF was a better solvent for PAN than PU. In a poor solvent, a rubbery elastic polymer such as PU, the hard and soft segments of polymeric chain tend to attract each other, which may result in a loose unfavorable polymer–solvent interaction. The system becomes thermodynamically unstable, leading to instantaneous demixing and a porous morphology.44 A similar finding was shown for a pure PU–DMF system.48

3.3 Morphological study by SEM

SEM analysis is an important tool for the morphological characterization of the membrane surface. It is a well known fact that an asymmetric membrane consists of a top layer (skin layer), a middle layer (sub layer) and a small sponge-like bottom surface layer. The skin layer acts as a separation layer and the support layer provides the mechanical strength. SEM images of individual and the PAN/PU blend membranes are represented in Fig. 3. The left side column shows the cross sectional views, whereas top surface images are given in the right side column.
image file: c5ra00736d-f3.tif
Fig. 3 Cross sectional and top view SEM images of pure PAN and the blended PAN/PU membranes: (a) PAN, (b) 90/10, (c) 80/20 and (d) PU.

For higher PU% in the blend, at 70/30 and 60/40 PAN/PU blend ratios, SEM images are shown in the ESI (Fig. S1). The viscosity data in Table 2 shows a consistent decrease in the polymer viscosity with an increase in PU concentration. For 20 wt% pure PAN, the viscosity was the highest. Higher viscosity hinders the demixing process and leads to a denser skin layer, which promotes selectivity (higher rejection) but lesser throughput (permeate flux).49 This observation was verified by a dense morphology (Fig. 3(a)) for the pure PAN membrane. The top view SEM image (Fig. 3(a)-top) also supports the dense morphology of the PAN membrane. With a further increase in PU concentration in the blend from 10% to 40%, the viscosity of the casting solution decreases. Therefore, more non-solvent penetrates into the membrane matrix as discussed in Section 3.2 and Fig. 2 and leads to rapid demixing. Therefore, both the thermodynamic instability and kinetic hindrance control the membrane morphology. The combined effects result in the formation of macrovoids in the membrane cross section upon increasing the concentration of PU in the blend (Fig. 3(b) and (c) and S1). The presence of macrovoids in the membrane morphology was associated with the formation of pores on the membranes top surface. In addition, SEM images for the 90/10 and 80/20 blend membranes have some clear visible open pores on their top surfaces. However, bigger pore size membranes were obtained for 70/30 and 60/40 blend ratios that support the SEM images given in Fig. S1. The total membrane thickness and skin thickness of the cast membranes measured from SEM images are shown in Table 4.

Table 4 The effect of the blend ratio on the different morphological parameters of the PAN/PU blend membranes
Membrane code MWCO (kDa) Comparison of membrane pore sizes (diameter) Membrane thickness (μm) Skin thickness (μm)
Eqn (4) (nm) BET (nm)
100/0 (PAN) 4 3.4 11.6 120 10
90/10 14 6.8 12.4 110 6.5
80/20 46 11.5 14.0 105 6
70/30 87 16.0 16.4 60 1
60/40 128 20.7 18.0 55 0.5


The data in Table 4 indicates that the membrane skin thickness decreases with PU concentration. A similar observation was reported by Malaisamy et al.27 in the case of blending PU with PSF, by Sivakumar et al.23 for a CA/PU blend and by Velu et al.33 for PSF/PU systems. The SEM image of pure PU is given in Fig. 3(d). Pure PU having the least viscosity (Table 2), exchange of solvent–non-solvent was augmented. Therefore, spongy structures with plenty of pinholes are visualized in the cross sectional SEM images. The SEM images showed a thicker morphology for pure PU when compared to the other membranes. The general trend describes that the membrane thickness was mostly altered by the thermodynamic and kinetic behavior of the casting solution. Hence, a higher kinetic instability gives rise to a thicker morphology.50 In addition, shifting the binodal curve towards the polymer–non-solvent axis ensures an unstable system at 20 wt% pure PU concentration, as discussed in Section 3.2. The overall thickness (140 μm) and skin thickness (12 μm) of the pure PU membrane were also the highest. However, no pores were visible in the top view of this membrane at 1000× magnification. However, pores are seen at the higher magnification of 10[thin space (1/6-em)]000× indicating its spongy cross sectional morphology (Fig. 3(d)). Although the membrane seems to be porous, it offers more resistance against solvent flow due to its larger thickness (overall and skin). Although, reports suggest that the pure PU membrane was generally applied for gas separation and solvent purification purposes rather water based separations.51 Therefore, only PAN/PU blend membranes were characterized and examined for application in the treatment of turbid water.

3.4 Membrane permeability

The permeation results of various cast membranes are presented in Fig. 4. From this figure, it is clear that pure PAN (100/0), the control membrane has the least permeability at 1.84 × 10⁻¹¹ m Pa−1 s−1. With the addition of PU in the blend (10–30%) the permeability increases to 2.37 × 10⁻¹¹ m Pa−1 s−1 (90/10), 5.14 × 10⁻¹¹ (80/20) and 6.87 × 10⁻¹¹ m Pa−1 s−1 (70/30), respectively.
image file: c5ra00736d-f4.tif
Fig. 4 The permeability of pure PAN and the PAN/PU blended membranes.

Further, an increase in PU to 40% i.e., at a (60/40) blend ratio, results in a significant increase in the membrane permeability to 4.65 × 10⁻¹⁰ m Pa−1 s−1. The data appropriately corroborate with the SEM images (Fig. 3 and ESI Fig. S1), described in Section 3.3. The viscosity plays a major role in the demixing process. As viscosity decreases with an increase in the PU concentration, the non-solvent penetration in the membrane matrix was enhanced that result in instantaneous demixing as discussed earlier. Instantaneous demixing was associated with a loose and porous membrane structure. Hence, the permeability shows an increasing trend upon the addition of PU in the blend membranes. However, a drastic increase in the membrane permeability for PAN/PU and the 60/40 blend composition explains the formation of a rougher membrane due to the elastic and rubbery behavior of the PU polymer. A similar trend was reported earlier for the increased PU concentration in a CA/PU blend membrane and TPU concentration in a PVDF/TPU blend membrane.23–25,29

3.5 Porosity and contact angle

The effect of PU on the porosity and contact angle of the cast membranes are shown in Fig. 5. It was observed that the PAN/PU blend membranes at 90/10, 80/20, 70/30 and 60/40 blend ratios showed an appreciable increase in membrane permeability when compared to the pure PAN and PU membranes.
image file: c5ra00736d-f5.tif
Fig. 5 The porosity and contact angle of pure PAN and the PAN/PU blended membranes.

Membrane porosity increased with an increase in PU concentration in the blend membranes. The results are in line with the SEM images shown in Fig. 3 and that the presence of bigger pores on the membrane surface results in a more permeable membrane. A similar observation was reported by Malaisamy et al.27 for PU/SPSF blend membranes. The addition of PU decreases the contact angle from 810 (PAN) to 720 (90/10), 690 (80/20), 560 (70/30) and 510 (60/40) for the PAN/PU blend ratios, respectively. This indicates that the addition of PU can be a useful tool to improve the membrane hydrophilicity. The permeability and porosity of the membranes increases with an increase in PU concentration, and hence the average value for the contact angle (Fig. 5) shows an expected decreasing trend. Pure PAN exhibited the lowest porosity (25%) due to its dense morphology as shown in Fig. 3(a). The contact angle obtained for this membrane was 760. The results are in corroboration with the SEM images and permeability measurements discussed in the preceding Sections.

3.6 The MWCO of the membranes

The MWCO curves for all the cast membranes were determined individually based on the percentage rejection data with pure solute and is shown in Fig. 6 (Table 4).
image file: c5ra00736d-f6.tif
Fig. 6 Molecular weight cut-off for pure PAN and the PAN/PU blended membranes with different blend ratios.

As observed, the MWCO increases with an increase in PU concentration from 4 kDa (PAN) to 14 kDa, 46 kDa, 87 kDa and 128 kDa for various PAN/PU blend ratios of 90/10, 80/20, 70/30 and 60/40, respectively. As reflected in the SEM images (Fig. 3), the membrane permeability (Fig. 4) and porosity (Fig. 5) increase with the addition of PU in the PAN/PU blends. A highly porous membrane offers lower solute rejection and hence higher MWCO. Therefore, at a higher PU concentration of 40 wt% in the PAN/PU blend, a more porous membrane with higher MWCO of 128 kDa was obtained. However, for pure PAN the lowest MWCO (compared to its counter membranes) of 4 kDa was obtained due to its dense and thicker membrane morphology.

3.7 Measurement of the average pore size

The average pore diameter of each membrane was calculated using eqn (6) and the BET measurements, and the values are reported in Table 4. As observed from Table 4, the average pore diameter increases upon the addition of PU in the PAN/PU blend. The average pore diameter increases from 3.4 nm (pure PAN) to 20.7 nm for the PAN/PU blend ratio of 60/40. The SEM image (Fig. 3) corroborates the above findings very well. With the addition of PU, large sized pores were observed in the membrane skin layer increasing the average pore size of the membranes. The permeability as well as membrane porosity increases accordingly.52 The average pore size obtained from the BET results slightly differ from the calculated results obtained using eqn (6). The average pore diameter determined by eqn (6), was based on the determined molecular weight cut off of the membranes. On the other hand, BET measurements account for both through pores as well as blind pores. Hence, higher pore sizes are obtained from the BET analysis. This discrepancy was notable at lower MWCO and becomes insignificant for higher cut-off membranes (Table 4).

3.8 AFM analysis of the membranes

AFM images of the pure PAN and the PAN/PU blend membranes are presented in Fig. 7. The dark and light portions in these images indicate the presence of membrane pores and valleys. As shown in Fig. 7, for pure PAN a smooth membrane surface was obtained. The RMS roughness of the membrane was found to be 10 nm (Fig. 7(a)). With an increase in PU concentration in the blend the RMS roughness increases. The roughness of the PAN/PU blend membrane followed the order, 90/10 < 80/20 < 70/30 < 60/40, as presented in Fig. 7(b)–(d). The highest roughness of 200 nm was obtained for the 60/40 blend membrane. This can be explained by the SEM images (Fig. 3) and the ESI Fig. S1 that the addition of hydrophilic PU increases the number of available pores as well as their sizes and the porosity (Fig. 5) in the membrane matrix. An increase in porosity imparts enhanced membrane roughness as shown in the AFM images. The results are consistent with the study reported by Sadeghi et al.53 for a PES/PVP system.
image file: c5ra00736d-f7.tif
Fig. 7 Root mean surface roughness for pure PAN and the blended PAN/PU membranes with various blend ratios: (a) PAN, (b) 90/10, (c) 80/20, (d) 70/30 and (e) 60/40.

3.9 FTIR analysis of the PAN/PEG blend membranes

The FTIR (C[triple bond, length as m-dash]N) spectra of PAN, PU and the PAN/PU blend membranes are shown in Fig. 8. The spectrum of pure PAN membrane shows the transmission band at 2237 cm−1 confirming the presence of nitrile groups (Fig. 8(a)).42 In addition, the PAN/PU blend membranes show some notable interactions that reveal the structural changes due to the stretching vibration of the above functional groups. The stretching frequency of pure PAN membrane at 2237 cm−1 was slightly reduced for the PAN/PU blend at 90/10, shown in Fig. 8(b). However, its intensity vanishes at higher blend composition of PU i.e., the 70/30 and 60/40 membranes (Fig. 8(c) and (d)). Pure PU membrane (Fig. 8(e)) shows a characteristic band at 3371 cm−1 representing the (–N–H) stretching vibration of urethane group and the corresponding bands at 1533 cm−1 and 1310 cm−1 indicating the amide bond and (–OCONH–) asymmetric stretching vibrations.2,3 Free carbonyl groups (C[double bond, length as m-dash]O) corresponding to the polyester chain and urethane groups are at 1731 cm−1 and 1645 cm−1, respectively. The peak at 2948 cm−1 highlights the asymmetric stretching vibration of the (CH2) groups in polyurethane. Whereas, the peak at 1645 cm−1 represents the presence of the (C[double bond, length as m-dash]C) stretching vibration in the aromatic rings.39 In addition, the stretching frequency due to (N–H) stretching at 3371 cm−1 in the PU membrane was shifted to 3319 cm−1, 3283 cm−1 and 3271 cm−1 for different PAN/PU blend ratios as highlighted in Fig. 8(b)–(d). This shifting of functional groups establishes an interaction between the (N–H) group of urethane and the carbonyl groups in PAN. A similar type of shifting in the FTIR peaks was reported by the earlier studies on blend membranes involving the PAN/Carboxylated polyether imide (CPEI) blend and CA/PU blend.54,36 This result establishes the better compatibility between the individual polymers.55
image file: c5ra00736d-f8.tif
Fig. 8 FTIR spectra of pure PAN and the PAN/PU blend membranes: (a) PAN, (b) PAN/PU: 90/10, (c) PAN/PU: 70/30, (d) PAN/PU: 60/40 and (e) PU.

3.10 DSC analysis of the PAN/PU blend membranes

The polymer compatibility of the blend membranes was confirmed using differential scanning calorimetry (DSC). The resultant thermograms of pure PAN as well as the PAN/PU blend membranes are shown in the Fig. 9.
image file: c5ra00736d-f9.tif
Fig. 9 Differential scanning calorimetry (DSC) curves for pure PAN and the PAN/PU blend membranes (w/w): (a) the effect of blend composition; (i) 90/10, (ii) 80/20, (iii) 70/30 and (iv) 60/40; and (b) PAN.

Thermal analysis of the membranes using DSC is a valuable tool, as the (theoretical) glass transition temperature difference between PAN and PU exceeds 20 °C. Experimental determination of the Tg value for the pure PAN and PU membranes were found to be 108 °C and 82.97 °C, which was close to the value reported in the literature.54,56 For the blend membranes, the glass transition temperatures were found to be 96.44 °C for the 90/10 PAN/PU blend, 95.54 °C for the 80/20 PAN/PU blend, 93.18 °C for the 70/30 PAN/PU blend and 90.89 °C for the 60/40 PAN/PU blend, respectively, at an increased PU concentration of 10, 20, 30 and 40 wt%. From the above findings, we can interpret that (i) the blend membranes show a single glass transition temperature indicating the better compatibility of the polymers; (ii) the interaction between the polymers decreases with an increase in PU concentration; (iii) thermoplastic PU with a lower Tg value of 82.97 °C (when compared to PAN) greatly contributes to the decrease in Tg values of the polymeric blend. The presence of PU in PAN inherently increases the chain movement of the blend polymer, as discussed in Section 3.1 and 3.2 (Tables 3 and 4). In addition, earlier reports suggest a membrane having a lower glass transition temperature was associated with a loose structure and larger fractional free volume within the matrix.57 Hence, the lowest Tg of 90.89 °C was obtained for the 60/40 blend composition. These findings corroborate with the SEM images and the porosity values presented in the preceding Sections. A similar observation was reported for the earlier research by Barroso et al.,57 which described the effect of a glycol additive on cellulose acetate/zinc oxide blend membranes.

3.11 Mechanical property analysis

Fig. 10 shows the tensile properties of PAN and the PAN/PU blend membranes. The figure reveals that the PAN membrane has the highest tensile strength of 23.5 MPa and it decreases in the other blend membranes. This can be explained by the morphological behavior of all the membranes presented in the SEM images shown in Fig. 3. As the membrane becomes porous, breaking stress decreases as expected. The elongation percentage of the blend membranes proportionally increased with the PU concentration. This may be due to the presence of PU, a thermoplastic elastomer. The aliphatic chains contribute to the higher tensile strength, whereas cohesive force and intermolecular hydrogen bonding (Fig. 1(b)) were responsible for the higher elongation percentage of the membrane matrix.58 The Young's modulus of the membrane was used to quantify the membrane stiffness. The PAN membrane exerted the highest modulus of 719 ± 22 MPa compared to the 80/20, 70/30 and 60/40 blend compositions that have a modulus of 591 ± 55, 455 ± 10 and 398 ± 29 MPa, respectively. To the best of our knowledge, the mechanical properties of the PAN/PU blend membranes have never been reported earlier. However, a similar trend in decreasing the elastic modulus with membrane porosity was reported with the PAN/PAN-g-PEO blend membranes by Barroso et al.57
image file: c5ra00736d-f10.tif
Fig. 10 Tensile strength and percentage elongation of PAN and the PAN/PU blend membranes.

3.12 Antifouling properties of the membrane

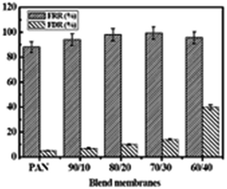
The flux decline profiles for PAN and the PAN/PU blend membranes are presented in Fig. 11(a). It was observed that the throughputs of these membranes were according to their permeability values. The corresponding FDR and FRR values are presented in Fig. 11(b).
image file: c5ra00736d-f11.tif
Fig. 11 The effect of the PAN/PU blend ratio on: (a) the time dependent flux declination with turbid feed of 500 NTU and (b) the antifouling parameters, FRR and FDR.

It can be observed that the FDR values are less than 5% for pure PAN and the 90/10 blend membranes. Because these membranes have the lowest pore size, a fouling layer of solutes were formed over the membrane surface due to concentration polarization leading to sluggish decline in the permeate flux. As the membrane become more porous upon increasing the PU concentration in the blend, two phenomena occur: (i) particles enter into the pores causing pore blocking and (ii) as the surface roughness of the membranes increases, the fouling of the membrane increases. These two effects act in tandem leading to an increase in flux decline. Consequently, the FDR for the 80/20, 70/30 and 60/40 membranes increase in the order 10%, 18% and 40%, respectively. The FRR of the pure PAN membrane was the lowest (88%) and increases with an increase in PU concentration in the blend. The FRR was at a maximum of 99% for the 70/30 PAN/PU blend. This is due to an increase in the hydrophilicity of the membranes with increasing PU concentration. Chen et al., reported upto 90% FRR using PVDF–microgel blend membranes.59 Kim et al., showed improved anti-biofouling properties of poly(vinyl alcohol) (PVA) coated carbon nanotube (CNT) deposited polyamide based reverse osmosis (RO) membranes.60 Qualitative analysis of the feed and permeate after filtration with a 500 NTU turbid feed with all the membranes was carried out and the values are reported in Table 5.

Table 5 Qualitative analysis of the feed and permeate after the filtration experiments with a 500 NTU turbid feed using the PAN/PU blend membranes
Properties Feed Permeate
Control membrane PAN/PU blend ratio
a Membrane codes correspond to the composition presented in Table 2.
aMembrane code   100/0 (PAN) 90/10 80/20 70/30 60/40
pH 7.4 7.1 7.2 7.2 7.1 7.3
Turbidity (NTU) 500 0 0 0 0 0
Conductivity (μS cm−1) 313 309 311 310 312 313
Absorbance at 254 nm 2.7 0.001 0.003 0.019 0.0318 0.0553


The complete removal of the turbidity and up to 99% removal of organic substances was attained by the blend membranes. The conductivity value for the feed and permeate remain unchanged as membranes are in the UF range.

4. Conclusions

Preparation, characterization and application of PAN/PU blend membranes are reported in this work. The major conclusions are:

(i) Inclusion of PU made the membrane more porous and the permeability of the membrane was increased from 2 × 10⁻¹¹ m Pa−1 s−1 to 48 × 10−11 for the 60/40 PAN/PU blend membrane.

(ii) The MWCO of the membranes also increased from 4 kDa to 128 kDa for the 60/40 PAN/PU blend. Various membranes with intermediate MWCO values of 14, 46 and 87 kDa were obtained for the 90/10, 80/20 and 70/30 blend compositions, respectively.

(iii) PU made the membrane more hydrophilic and the contact angle was reduced from 760 to 520 for the 60/40 blend membrane.

(iv) The surface roughness of the membrane was increased with increasing PU concentration in the blend and made them more prone to fouling.

(v) DSC measurements showed good compatibility between the PAN and PU membranes.

(vi) Experiments with turbid water showed that the turbidity and organic concentration in the feed water were removed completely by the membranes. The PAN/PU 70/30 blend membrane had the maximum antifouling characteristics.

Nomenclature

AMembrane surface area (m2)
C0Concentration of feed (mg l−1)
CpConcentration of permeate (mg l−1)
Jp0, JptInitial and final permeate flux at the end of time, t (1 h), l m−2 h−1
Jw, Jw1Pure water flux of membrane before and after experimental run, l m−2 h−1
μViscosity of water (Pa s)
ΔPTransmembrane pressure drop (kPa)
RRejection (%)
ΔtSampling time (s)
rsAverage pore radius (nm)

Abbreviation

AFMAtomic force microscopy
CACellulose acetate
CSACamphor sulfonic acid
CPEICarboxylated polyether imide
CPSFCarboxylated polysulfone
DSCDifferential scanning calorimetry
DMFDimethylformamide
DMAcDimethyl acetamide
FRRFlux recovery ratio
FDRFlux decline ratio
FTIRFourier transform infrared
IPNInterpenetrating polymer network
MWCOMolecular weight cut-off
nmNanometre
PANPolyacrylonitrile
PAMPolyacrylamide
PANIPolyaniline
pTSAp-Toluene sulfonic acid
PEPolyethylene
PEGPolyethylene glycol
PESPolyethersulfone
PPPolypropylene
PSFPolysulfone
PUPolyurethane
PVDFPolyvinylidene fluoride
PVPPolyvinylpyrrolidone
SEMScanning electron microscopy
TPUThermoplastic polyurethane
UFUltrafiltration

Acknowledgements

This work is partially supported by a Grant from the Board of Research in Nuclear Sciences, Department of Atomic Energy, Government of India, Mumbai under the Scheme no. 2012/2/03-BRNS, Dt. 25-07-2012. Any opinions, findings and conclusions expressed in this paper are those of the authors and do not necessarily reflect the views of the BRNS.

References

  1. E. A. Collins, J. Bares and F. W. Billmeyer Jr, Experiments in Polymer Science, Wiley, 1973 Search PubMed.
  2. I. Yilgor and E. Yilgor, Polymer, 1999, 40, 5575 CrossRef CAS.
  3. J. Brandrup, E. H. Immergut, E. A. Grulke, A. Abe and D. R. Bloch, Polymer Handbook, Wiley, 1999 Search PubMed.
  4. L. Lin, Y. Kong, K. Xie, F. Lua, R. Liu, L. Guo, S. Shao, J. Yang, D. Shi and Y. Zhang, Sep. Purif. Technol., 2008, 61, 293 CrossRef CAS PubMed.
  5. B. K. K. Swamy and Siddaramaiah, J. Hazard. Mater., 2003, 99, 177 CrossRef.
  6. Z. F. Wang, B. Wang, X. M. Ding, M. Zhang, L. M. Liu, N. Qi and J. L. Hu, J. Membr. Sci., 2004, 241, 355 CrossRef CAS PubMed.
  7. M. Mandru, C. Ciobanu, M. E. Ignat, M. Popa, L. Verestiuc and S. Vlad, Digest Journal of Nanomaterials and Biostructures, 2011, 6(3), 1227 Search PubMed.
  8. M. Mandru, C. Ciobanu, S. Vlad, M. Butnaru, L. Lebrun and M. Popa, Cent. Eur. J. Chem., 2013, 11(4), 542 CrossRef CAS.
  9. L. A. Utracki, Polymer Blends Handbook, Kluwer Academic pub, 2002 Search PubMed.
  10. M. Liu, C. Xiao and X. Hu, Desalination, 2011, 275, 133 CrossRef CAS PubMed.
  11. H. Liu, C. Xiao, X. Hu and M. Liu, J. Membr. Sci., 2013, 427, 326 CrossRef CAS PubMed.
  12. X. Zhao, H. Zhang and J. Wang, Chin. J. Chem. Eng., 2014, 22(5), 583 CrossRef CAS.
  13. G. Ciobanu, G. Carja and O. Ciobanu, Desalination, 2008, 222, 197 CrossRef CAS PubMed.
  14. H. R. Pant, H. J. Kim, M. K. Joshi, B. Pant, C. H. Park, J. I. Kim, K. S. Huid and C. S. Kim, J. Hazard. Mater., 2014, 264, 25 CrossRef CAS PubMed.
  15. M. A. Frommer and R. M. Massalem, Ind. Eng. Chem. Prod. Res. Dev., 1993, 12(4), 328 CrossRef.
  16. Z. S. Petrovic, Z. Zavargo, J. H. Fly and W. J. Macknight, J. Appl. Polym. Sci., 1994, 51, 1087 CrossRef CAS.
  17. K. Rzeszutek and A. Chow, J. Membr. Sci., 2001, 181, 265 CrossRef CAS.
  18. L. I. B. David and A. F. Ismail, J. Membr. Sci., 2003, 213, 285 CrossRef CAS.
  19. I. C. Kim, H. G. Yun and K. H. Lee, J. Membr. Sci., 2002, 199, 75 CrossRef CAS.
  20. N. Scharnagl and H. Buschatz, Desalination, 2001, 139, 191 CrossRef CAS.
  21. E. R. Cornelissen, T. V. Boomgaard and H. Strathmann, Colloids Surf., A, 1998, 138, 283 CrossRef CAS.
  22. Q. Zhou, L. Zhang and M. Zhang, Polymer, 2003, 44, 1733 CrossRef CAS.
  23. M. Sivakumar, D. Mohan and R. Rangarajan, Polymer Int., 1998, 47(1), 311 CrossRef CAS.
  24. M. sivakumar, R. Malaisamya, C. J. Sajitha, D. Mohan, V. Mohana and R. Rangarajan, Eur. Polym. J., 1999, 35, 1647 CrossRef CAS.
  25. M. Sivakumar, D. Mohan and R. Rangarajan, J. Membr. Sci., 2000, 169, 215 CrossRef CAS.
  26. P. D. Nair, M. Jayabalam and V. N. Krishramurthy, J. Polym. Sci., Part A: Polym. Chem., 1990, 28, 3775 CrossRef CAS.
  27. R. Malaisamy, D. R. Mohan and M. Rajendran, J. Colloid Interface Sci., 2002, 254, 129 CAS.
  28. C. S. Latha, D. Shanthanalakshmi, D. Mohan, K. Balu and M. D. K. Kumarasamy, J. Appl. Polym. Sci., 2005, 97, 1307 CrossRef CAS.
  29. Z. Yuan and X. Dan-Li, Desalination, 2008, 223, 438 CrossRef PubMed.
  30. F. D. R. Amado, L. F. Rodrigues Jr, M. A. S. Rodrigues, A. M. Bernardes, J. Z. Ferreira and C. A. Ferreira, Desalination, 2005, 186, 199–206 CrossRef CAS PubMed.
  31. D. Zavastin, I. Cretescu, M. Bezdadea, M. Bourceanu, M. Dragan, G. Lisa, I. Mangalagiu, V. Vasic and J. Savic, Colloids Surf., A, 2010, 370, 120 CrossRef CAS PubMed.
  32. S. Velu, L. Muruganandam and G. Arthanareeswaran, Int. J. Chem. Anal. Sci., 2011, 2(7), 87 Search PubMed.
  33. Y. Wu, G. Tian, H. Tan and X. Fu, Desalin. Water Treat., 2013, 51, 5311 CrossRef CAS.
  34. M. Tijink, J. Janssen, M. Timmer, J. Austen, Y. Aldenhoff, J. Kooman, L. Koole, J. Damoiseaux, R. van Oerle, Y. Henskensh and D. Stamatialis, J. Mater. Chem. B, 2013, 1, 6066 RSC.
  35. C. Nie, L. Ma, Y. Xia, C. He, J. Deng, L. Wang, C. Cheng, S. Sun and C. Zhao, J. Membr. Sci., 2015, 475, 455 CrossRef CAS PubMed.
  36. C. Cheng, S. Sun and C. Zhao, J. Mater. Chem. B, 2014, 2, 7649 RSC.
  37. Z. Yin, C. Cheng, H. Qin, C. Nie, C. He and C. Zhao, J. Biomed. Mater. Res., Part B, 2015, 103, 97 CrossRef PubMed.
  38. A. Roy, P. Dadhich, S. Dhara and S. De, RSC Adv., 2015, 5, 7023 RSC.
  39. J. Wijmans, J. Kant, M. Mulder and C. Smolders, Polymer, 1985, 26, 1539 CrossRef CAS.
  40. P. Rai, G. C. Majumdar, S. DasGupta and S. De, Food Sci. Technol., 2007, 40, 1765 CAS.
  41. S. R. Panda and S. De, Polym. Eng. Sci., 2014, 54(10), 2375 Search PubMed.
  42. S. Singh, K. C. Khulbe, T. Matsuuraa and P. Ramamurthy, J. Membr. Sci., 1998, 142, 111 CrossRef CAS.
  43. R. Guan, H. Dai, C. Li, J. Liu and J. Xu, J. Membr. Sci., 2006, 277, 148 CrossRef CAS PubMed.
  44. S. R. Panda and S. De, J. Polym. Res., 2013, 20, 179 CrossRef PubMed.
  45. S. T. Kao, M. Y. Teng, C. L. Li, C. Y. Kuo, C. Y. Hsieh, H. A. Tsai, D. M. Wang, K. R. Lee and J. Y. Lai, Desalination, 2008, 233, 96 CrossRef CAS PubMed.
  46. M. Sadrzadeh and S. Bhattacharjee, J. Membr. Sci., 2013, 441, 31 CrossRef CAS PubMed.
  47. L. Tan, D. Pan and N. Pan, J. Appl. Polym. Sci., 2008, 110, 3439 CrossRef CAS.
  48. Y. D. Kim, J. Y. Kim, H. K. Lee and S. C. Kim, J. Appl. Polym. Sci., 1999, 73, 2377 CrossRef CAS.
  49. Z. Wang, J. Ma and Q. Liu, Desalination, 2011, 278, 141 CrossRef CAS PubMed.
  50. E. Saljoughi, M. Amirilargani and T. Mohammadi, Desalination, 2010, 262, 72 CrossRef CAS PubMed.
  51. H. Kumar and Siddaramaiah, J. Hazard. Mater., 2007, 148, 467 CrossRef CAS PubMed.
  52. D. B. Mosqueda-Jimenez, R. M. Narbaitz, T. Matsura, G. Choudhury, G. Pleizier and J. P. Santerre, J. Membr. Sci., 2004, 231, 209 CrossRef CAS PubMed.
  53. I. Sadeghi, A. Aroujalian, A. Raisi, B. Dabir and M. Fathizadeh, J. Membr. Sci., 2013, 430, 24 CrossRef CAS PubMed.
  54. S. Senthilkumar, S. Rajesh, A. Jayalakshmi and D. Mohan, Sep. Purif. Technol., 2013, 107, 297 CrossRef CAS PubMed.
  55. A. Litmanovich and N. Plate, Macromol. Chem. Phys., 2000, 201, 2176 CrossRef CAS.
  56. R. Saranya, G. Arthanareeswaran, S. Sakthivelu and P. Manohar, Ind. Eng. Chem. Res., 2012, 51, 4942 CrossRef CAS.
  57. M. Ali, M. Zafar, T. Jamil and M. T. Z. Butt, Desalination, 2011, 270, 98 CrossRef CAS PubMed.
  58. T. Barroso, M. Temtem, T. Casimiro and A. Aguiar-Ricardo, J. Supercrit. Fluids, 2011, 56, 312 CrossRef CAS PubMed.
  59. X. Chen, B. Zhao, L. Zhao, S. Bi, P. Han, X. Feng and L. Chen, RSC Adv., 2014, 4, 29933 RSC.
  60. H. J. Kim, Y. Baek, K. Choi, D. Kim, H. Kang, Y. Choi, J. Yoon and J. Lee, RSC Adv., 2014, 4, 32802 RSC.

Footnote

Electronic supplementary information (ESI) available. See DOI: 10.1039/c5ra00736d

This journal is © The Royal Society of Chemistry 2015
Click here to see how this site uses Cookies. View our privacy policy here.