DOI:
10.1039/C5RA00705D
(Paper)
RSC Adv., 2015,
5, 13777-13786
Effect of biomimetic templates on the magneto-structural properties of Fe3O4 nanoparticles
Received
13th January 2015
, Accepted 19th January 2015
First published on 19th January 2015
Abstract
In this study, water dispersible iron oxide nanoparticles (IONPs) were synthesized in three different templates using a combination of proteins (collagen and bovine serum albumin), amino acids (glycine and glutamic acid) and a biocompatible polymer (poly vinyl alcohol). A stringent control on the morphology of IONPs that is reproducible and scalable at ambient conditions is obtained. Detailed structural characterization and the template effect on magneto-structural properties of IONPs have been studied. Magnetic measurements showed variation in magnetic properties and relaxation behavior with change in the chemical environment (the attachment of surface ligands confirmed from the Fourier transform infrared spectra); Mössbauer studies revealed monopole and magnetic hyperfine interactions playing an important role that could be attributed to template dependency. The increase of particle size coupled with decrease in hydrodynamic diameter decreases demagnetizing interactions between nanoparticles which increase the specific absorption rate in in vitro hyperthermia, thus the highest specific absorption rate (139 Watts per g) observed in template 1. Magnetic resonance imaging (MRI) studies also showed transverse relaxivity of 543.9 ml s−1 mg−1 for nanoparticles in template 1. Considering the anisotropy energy barrier, particle size and hydrodynamic diameter we conclude that template 1 is the best for potential applications in biomedicine.
1. Introduction
Biomimetic materials are formed by mimicking the natural biomineralization process of templated synthesis. These then act as building blocks that self assemble to form hierarchical structures sequentially from “nano” to “micro” to “macro”. Such materials are important because, this control of nanostructures and ordered assemblies of materials in 2–3 dimensions still remains elusive. Current interest in the synthesis of iron oxide nanoparticles (IONPs) within organized templates is aimed: (i) at having a better understanding of the mechanism of biomineralization, (ii) at correlating with neurodegenerative diseases and (iii) at developing magnetic resonance imaging (MRI) contrast agents with higher relaxivities and ability to cross the blood–brain barrier.1 Biomimetic IONPs are also expected to play a vital role in diagnosis and treatment of cancer that overcome the drawbacks of existing materials for the same.2–4 Though spinel ferrites like MFe2O4 (where M = Mn, Co, Ni etc.) and binary alloys like FePt exhibit superior magnetic properties, magnetite (Fe3O4) nanoparticles is the most suitable material for biomedical applications due to their high magnetic response, superparamagnetic nature, high Curie temperature (TC ∼ 858 K) and biocompatibility. In this work we have used a combination of proteins (collagen & bovine serum albumin), amino acids (glycine & glutamic acid) and a biocompatible polymer (polyvinyl alcohol) as templates with an aim to synthesize Fe3O4 nanoparticles with controlled morphology; the templates not only enhance their multi-functionality and magnetization, but also act as protective shells which hinders uncontrolled growth, agglomeration and surface oxidation.5 The specificity of a ligand for a surface may originate either from the chemical (i.e. hydrogen bonding, polarity and charge effect) or structural (i.e. size and shape) recognition mechanism. The equilibrium arrangement of ligands in the templates dictates the morphology of the nanoparticles; these, depending on their structure and chemical composition act as barriers to the motion of magnetic moments which affect their relaxation. The attachment of functional groups at the nanoparticle surface disrupts the electronic charge distribution of the Fe–O bonds, which results in surface pinning of magnetic moments and increases the anisotropy.6 This anisotropy results in increased coercivity below blocking temperatures where higher fields are required for moment relaxation; such a phenomenon indicates the presence of dipolar interaction and spin frustration at the surface forming core–shell type structures. In Fe3O4 the magnetic coupling is affected by super exchange interactions via the oxygen atoms of the spinel lattice; a rearrangement of the surface structure in different templates leads to the modification of the magnetic coupling which results in changes in the magnetic properties.7 Surprisingly, very few attempts have been made to understand such interactions for biomimetic systems; here, a detailed structural and magnetic study has been done, to understand the role of templates in tuning magnetic properties. From the application point of view, the nanoparticles were tested for hyperthermia and as magnetic resonance imaging contrast agents. It was observed that by the right choice of templates high values of specific absorption rate (SAR) and T2 relaxivity could be achieved.
2. Experimental
2.1. Synthesis
Anhydrous ferric chloride (FeCl3) was purchased from Merck; hydrated ferrous chloride (FeCl2·4H2O) from Loba Chemie; collagen (CL) from Sigma Aldrich; poly(vinyl) alcohol (PVA, 95% hydrolyzed, avg. mol. wt. = 95 kDa) from Acros Organics; bovine serum albumin (BSA) from Acros Organics; glycine (Gly) from Thomas Baker; D-glutamic acid (Glu) from Sigma Aldrich and liquor ammonia (30% v/v) from Merck. Double distilled water was used throughout the experiments. Our patented process that used only PVA as a template was modified and a combination of molecules were used for the synthesis.8 Three different templates were designed using 0.01% (w/v) CL, 0.01% (w/v) PVA and 0.001% (w/v) BSA for template 1; 0.001% (w/v) Gly, 0.001% (w/v) Glu and 0.01% (w/v) BSA for template 2; 0.001% (w/v) Gly, 0.001% (w/v) Glu & 0.01% (w/v) CL for template 3. The detailed synthesis procedure has been described in our previous report;9 Fe3O4 synthesized in the templates 1, 2 and 3 will henceforth be denoted as S1, S2 and S3. The use of proteins, polymer and amino acids helped not only to maintain a stringent control on the morphology of the particles but also to enhance the magnetic properties.
2.2. Characterizations
Structural investigation including phase identification was carried out in analytical transmission electron microscope (TEM) Philips CM200 operated at 200 kV. The particles were well dispersed in distilled water (conc. = 2 mg ml−1) followed by 20 times dilution after which a single drop of diluted sample was dried on carbon coated copper grid and examined under the microscope. The phases were also confirmed by room temperature X-ray diffraction of the powdered samples in Bruker D8 Discover diffractometer, operated at 40 kV with CuKα radiation (λ = 1.5418 Å) within the range 20–80° (2θ), step size of 0.02° per step and scanning speed of 5 s per step. Hydrodynamic diameter (DH) and zeta potential (ξ) was measured in the dispersed state (conc. = 2 mg ml−1) in the zetasizer DLS Nano 100, Malvern Instruments; the data was measured using the back scattering technique at an angle of 173°. To confirm surface functionalization Fourier transform infrared spectra was recorded using the KBr pellet method in Nicolet 5700 spectrometer. Room temperature magnetization (MS), coercivity (HC), retentivity (MR) and susceptibility (χ) was measured using vibrating sample magnetometer VSM Lakeshore 7404; zero field cooled and field cooled (FC-ZFC) measurements were carried out in VersaLab™ Quantum Design within the temperature range 50 K–300 K (applied field = 100 Oe, heating rate/cooling rate = 2 K min−1). In a typical experiment the sample is first cooled to 50 K without any external field (ZFC curve) after which a small probing field is applied to measure the magnetization while heating the sample; on reaching 300 K, the sample is cooled back to 50 K, now, in the presence of an external field (FC curve) and the magnetization recorded. Apart from M-T measurements, hysteresis was also recorded during zero-field cooling at 50 K. To discriminate between the core and surface Fe species, their electronic and magnetic hyperfine characteristics and also the cationic distribution (Fe3+ and Fe2+) in the crystal lattice was studied using 57Fe Mössbauer spectroscopy; the spectra were recorded by using a 10 mCi 57Co radioactive source in rhodium matrix and a PC-based 512 channel multichannel analyzer operating in the constant acceleration mode.
2.3. AC magnetic field heating
The powdered samples were dispersed in distilled water (conc. = 2 mg ml−1) using mild sonication in plastic micro-centrifuge tubes (1.5 ml capacity). The tubes were placed within the induction coil and heat generation was monitored using AC magnetic field heating set up (Easy Heat 8310, Ambrell, UK). Keeping the frequency fixed (265 kHz), the magnetic field was varied by changing the current (I) flowing through the induction coil. SAR was calculated from the temperature versus time profile measured at three different field amplitudes viz. 167.6 Oe (I = 200 Amps), 251.4 Oe (I = 300 Amps) and 335.2 Oe (I = 400 Amps); the maximum SAR was calculated for 335.2 Oe, the other field amplitudes did not heat up sufficiently and were not considered ideal for hyperthermia applications. The temperature was measured by a fibre-optic probe dipped in the dispersion; a detailed description of the set up is given elsewhere.10
2.4. Magnetic resonance imaging
Measurements of relaxivity and in vivo MRI studies were carried out in a 14.1 Tesla wide bore magnet interfaced with NMR Microimager (Bruker Biospin, Germany). The transverse relaxation rate (R2) of S1, S2 and S3 was measured using multiple slice multiple echo sequence. The measurements were carried out by suspending these particles in normal saline (0.9% NaCl) solution in 0.5 ml microfuge tube. The axial images of the microfuge tubes filled with nanoparticle suspension were obtained using multislice multiecho protocol with varying echo time. Mono-exponential analysis was performed for signal intensity (a. u.) versus echo time to determine the T2 value. The transverse relaxivity (r2) of the nanoparticles was calculated from the slope of relaxation rate (R2 = 1/T2) versus concentration graph.
In vivo MRI studies were done to assess the potential of these formulations as contrast agents. For MRI measurements, C57Bl6-J mice were administered nanoparticle formulations through the tail vain. All the experimental procedures with animals were approved by the Institutional Animals Ethics Committee of Centre for Cellular and Molecular Biology (CCMB), Hyderabad, India and were conducted in accordance with the guidelines established by Committee for the Purpose of Control and Supervision on Experiments on Animals, Ministry of Environment and Forests, Government of India. The mice were placed supine in the MR probe that was positioned at the isocentre of the magnet. The axial images of the abdomen were obtained using multislice multiecho method. The parameters used for the image acquisition are: TR = 2500 ms, TE raging from 7.2 to 57.4 ms, FOV = 28 mm, matrix size = 148 × 176 leading to spatial resolution 192 μm × 159 μm. The acquisition of the MRI data was triggered with the respiration of the animals to minimize the artifacts related with respiration.
3. Results and discussion
3.1. Structural characterizations
Transmission electron microscopy of the IONPs in Fig. 1 shows average particle size of 4.4 nm for S1, 4.9 nm for S2 and 7.5 nm for S3, the size seems to be dependent on the CL molecule. A schematic for the possible interactions of CL, PVA and BSA is given in our previous paper.9 TEM images indicate that the template modified IONPs were completely mono-dispersed without any agglomeration. Selected area electron diffraction (SAED) patterns showed polycrystalline rings and were indexed with respect to the interplanar spacing of pure Fe3O4; in S1 – (440), (511), (400), (311) and (220); S2 – (844), (660), (440) and (800) planes and S3 – only (440) and (660) crystal planes were predominant. It seems that the template helps in textured growth along specific planes while suppressing others. Zeta potential (ξ) of all three, S1 (−28.7 mV), S2 (−31.7 mV) and S3 (−37.3 mV) were in the stable colloidal range. The hydrodynamic radius (RH = DH/2) was calculated from the diffusion coefficient using the Stokes–Einstein equation,| |
 | (1) |
where K is the Boltzmann constant, T is the absolute temperature, η is the medium viscosity and f = 6πηRH is the frictional coefficient for a hard sphere in a viscous medium. DH is a very important parameter which affects the Brownian relaxation of nanoparticles in aqueous medium; it reveals the hydration layer around the particle and is a measure of the hydrophilicity of the coating material. The DH value was lowest in S1 (59.4 nm) followed by S3 (88.05 nm) and maximum for S2 (116.2 nm). The XRD pattern of the IONPs as shown in Fig. 2 was indexed with respect to the standard diffraction patterns (JCPDS Card no. 11-0614) of cubic phase Fe3O4. Prominent X-ray peaks indicate the crystalline nature of IONPs, peak broadening signifies the size effect under the constraint of different templates. The average crystallite size corresponding to (311) peak was estimated using the Scherrer's equation| |
 | (2) |
where D = average crystallite size, K = shape factor (0.9) λ = X-ray wavelength (1.5418 Å) and βhkl is the full width at half maximum (FWHM) of the diffraction peak measured in radians. The peaks were fitted using Philips Analytical X-ray Profile Fitting software using Pearson VII function; the instrumental broadening was corrected for each diffraction peak using the relation| | |
βhkl = [(βhkl)measured2 − (β)instrumental2]1/2
| (3) |
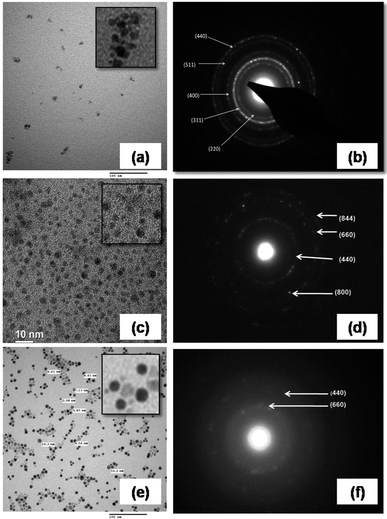 |
| | Fig. 1 TEM micrographs with indexed SAED patterns: (a and b) for S1, (c and d) for S2 and (e and f) for S3 nanoparticles. | |
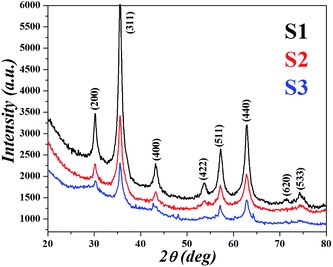 |
| | Fig. 2 XRD patterns showing the formation of Fe3O4 nanocrystals within different organic templates. | |
S1 had a crystallite size of 8.6 nm closely followed by 9.5 for S2 and 7.4 nm for S3; except for S3 which showed a good match, the other two showed greater size than TEM measurements. Such a possibility can arise in polycrystalline samples having non uniform strain; an effect which cannot be ignored.11
3.2. Fourier transforms infrared spectroscopy
Fig. 3 shows the FTIR spectra of the samples. Since all the templates contain proteins and amino acids, the transmittance band at 3413 cm−1 due to stretching vibrations of hydroxyl groups, N–H stretching modes at 3138 cm−1 and asymmetric stretching of C![[double bond, length as m-dash]](https://www.rsc.org/images/entities/char_e001.gif) C–H at 3039 cm−1 are observed. The major difference observed is however, in the C–N stretch at 1074 cm−1 indicating an interaction of IONPs with biomolecules. The characteristic IR bands of magnetite are present at 3757 cm−1 which may be assigned to the surface OH groups of magnetite and at 580, 500 and 468 cm−1 due to the Fe–O stretching vibration.
C–H at 3039 cm−1 are observed. The major difference observed is however, in the C–N stretch at 1074 cm−1 indicating an interaction of IONPs with biomolecules. The characteristic IR bands of magnetite are present at 3757 cm−1 which may be assigned to the surface OH groups of magnetite and at 580, 500 and 468 cm−1 due to the Fe–O stretching vibration.
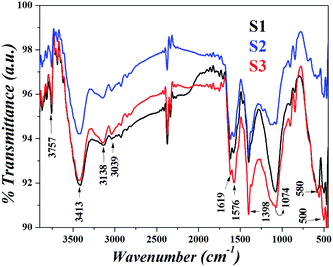 |
| | Fig. 3 FTIR spectra of the nanoparticles in different templates. | |
3.3. Magnetic study
Since all the particles are below the superparamagnetic (SPM) size limit for Fe3O4 (∼20 nm),12 the M–H curves (Fig. 4) showed typical S-shaped behavior and the coercivity in all the samples indicated magnetic anisotropy due to dipolar interactions (calculated in Table 1); however, the coercivity of all the samples were small (<40 Oe). Fig. 5 shows the hysteresis loops of the particles at 50 K; the low temperature enhancement of saturation magnetization as well as coercive field with respect to room temperature is due to freezing of uncompensated surface spins and blocking of single domain magnetic particles. For all the samples, variation in MS can be accounted for from the nature of the coating and the subsequent dipolar interaction between coated particles and assemblies. Since we used different templates, their chemical compositions were also different, due to the completely dissimilar chemical environment of the IONPs, dipolar interaction between them changes, which affects the MS values. The blocking temperature (TB) has been estimated from the M-T measurements (Fig. 6); since there was no sharp branching of the FC-ZFC curves, the TB considered is the temperature corresponding to the maximum value of magnetization during ZFC measurements (the tip of the ZFC curve). The TB was 209 K for S1, 164 K for S2 and 299 K for S3. The anisotropy constant has been calculated from the relationwhere KB is the Boltzmann constant and V is the particle volume. The fact that Keff varies in the three cases (Table 1) suggests that the relaxation process is different in all of them. The template driven difference in size and surface anisotropy due to spin disorder manifests itself differently in the properties. By changing the templates we have been able to tune the anisotropy which led to a change in TB.
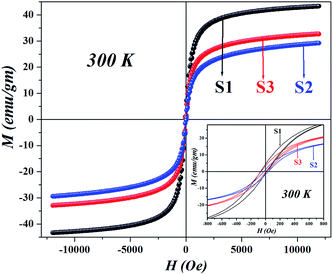 |
| | Fig. 4 Room temperature M–H curves for all the IONPs with different templates, showing difference in MS values and the presence of coercivity due to anisotropy (shown in the inset). | |
Table 1 Magnetic parameters of the IONPs in different templates
| Sample |
MSa (emu g−1) |
MRb (emu g−1) |
HCc (Oe) |
χinitiald (emu gOe−1) |
Keffe (×105 erg cm−3) |
TBf (Kelvin) |
| MS = saturation magnetization. MR = retentivity. HC = coercivity. χinitial = magnetic susceptibility. Keff = effective anisotropy constant (Keff). TB = blocking temperature. |
| S1 |
43.34 |
2.13 |
33.11 |
0.059 |
159.62 |
209 K |
| S2 |
29.34 |
1.50 |
31.39 |
0.042 |
91.94 |
164 K |
| S3 |
32.84 |
2.08 |
37.59 |
0.047 |
46.74 |
299 K |
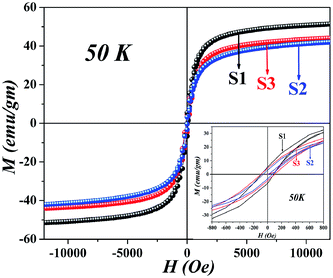 |
| | Fig. 5 Hysteresis curves at 50 K showing enhanced saturation magnetization and coercivity. | |
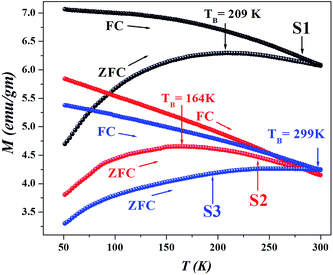 |
| | Fig. 6 ZFC curves of S1, S2 and S3 showing broad cusp like signatures signifying a wide distribution of energy barriers. The irreversible splitting of the FC and ZFC curves signify magnetic relaxation with variation in the blocking temperature (TB) with changing templates. | |
As a norm, Fe3O4 within the size range 4–8 nm does not show high TB as seen in ZFC-FC measurements. Interaction due to strong magnetic coupling increases the effective magnetic volume, pushing the TB towards higher values. The ZFC-FC curves branch near room temperature, the broad ZFC profile signifies a wide distribution of energy barriers due to enhanced inter-particle interactions which leads to self assembled structures with long range magnetic order. The irreversible temperature (Tirr) lies near 300 K, is much higher than TB; a phenomenon that may occur due to the randomly oriented surface spins, wide size distributions due to self assembly and high dipolar interactions.3,13,14 The energy barrier to reverse the magnetization is due to anisotropy; in our samples, the templates play a pivotal role in manipulating the anisotropy (Keff) as a result of which the coercive field changes. There are reports that suggest that the frustrated layer would pin the magnetic moment of the ferrimagnetic core due to exchange bias, thereby increasing the effective anisotropy of individual nanoparticles.15 This increase of anisotropy can be highly heterogeneous promoting a wide maximum in the ZFC profile; during measurements the inner core behave like a ferrimagnet but the outer frustrated region that show much larger irreversibility field, remain misaligned. It is evident that S1 possesses highest MS, χinitial and Keff; however the TB is highest in S3, probably due to the presence of CL, S3 having a much more open structure than S1.
3.4. Mössbauer spectroscopy
To confirm the magnetic hyperfine behavior, SPM nature and quantifying the cationic (Fe3+ and Fe2+) distribution at the tetrahedral (A) and octahedral sites (B), Mössbauer spectroscopy is the only effective tool.16 As per magnetization studies SPM IONPs should have shown a strong SPM doublet at 300 K (Fig. 7) but what is observed is a mixture of a strong doublet and a weak sextet. Such phenomena may arise due to two reasons: (i) a change in the chemical environment and (ii) presence of self assembled structures due to dipolar interaction; previous ZFC measurements with highly broadened cusp like signatures confirm this. Mössbauer spectra at 10 K for all the samples (Fig. 8), which is below TB, show a clear ordered sextet pattern corresponding to the two magnetic sites (A and B-site) with no trace of doublet. Such a phenomenon has been previously reported for IONPs synthesized in protein matrix.17 γ-Fe2O3 and Fe3O4, both being spinel oxides with similar lattice parameters, phase identification using XRD is inconclusive. Mössbauer parameters namely the isomer shift (I. S.), quadropole splitting (Q. S.) and hyperfine field (Hhf) were calculated from fittings and tabulated in Table 2. Generally, at low temperature, sextets having I. S. within 0.30–0.45 mm s−1 and Hhf within 500–510 kOe are assigned for Fe3+ at A-site and sextets having I. S. value > 0.45 mm s−1 and Hhf within 480–490 kOe are assigned for Fe3+and Fe2+ ions at B-site. The I. S. values for Fe3+ in S1 (0.39 mm s−1), S2 (0.46 mm s−1) and S3 (0.43 mm s−1) are higher than the standard value; however the Hhf was within the expected range. Major differences were observed for the B-sites where both I. S. and Hhf were much higher. Actually I. S. value indicates the electron density near nucleus; we can see that the I. S. value is lowest for S1 and highest for S2 sample. This means that the electronic environment of the samples is different due to different templates; a fact which is reflected in the MS values; it is highest for S1 which indicates less influence by the coating material and vice versa for S2 sample. Also, low temperature enhancement of I. S. value was due to the second order Doppler shift. Q. S. indicates the non-spherical shape of the nucleus that varies from 0.69–0.71 mm s−1 for room temperature samples. At low temperature, Q. S. values are ≤0.17 mm s−1 which suggests that shape of the samples tends to spherical symmetry. Since chemically synthesized Fe3O4 is essentially non-stoichiometric in nature, it contains vacancy states at the B sites which may be represented as (Fe3+)A(Fe1−3x2+Fe1+2x3+δx)BO4 where δ represents a vacancy.18,19 The degree of non-stoichiometry was estimated from the formula x = (2 − r)/6 + 5r where r = SB/SA; SA and SB are the % area of the sextets of A and B sites (see Table 2). The vacancy was the highest in S2 (0.039) followed by S3 (0.026) and S1 (0.003); the area ratio of B![[thin space (1/6-em)]](https://www.rsc.org/images/entities/char_2009.gif) :
:![[thin space (1/6-em)]](https://www.rsc.org/images/entities/char_2009.gif) A for stoichiometric Fe3O4 should be ideally 2
A for stoichiometric Fe3O4 should be ideally 2![[thin space (1/6-em)]](https://www.rsc.org/images/entities/char_2009.gif) :
:![[thin space (1/6-em)]](https://www.rsc.org/images/entities/char_2009.gif) 1, which in our case is 1.954 for S1, 1.470 for S2 and 1.631 for S3; these point to the fact that S1 is the best material among the three.
1, which in our case is 1.954 for S1, 1.470 for S2 and 1.631 for S3; these point to the fact that S1 is the best material among the three.
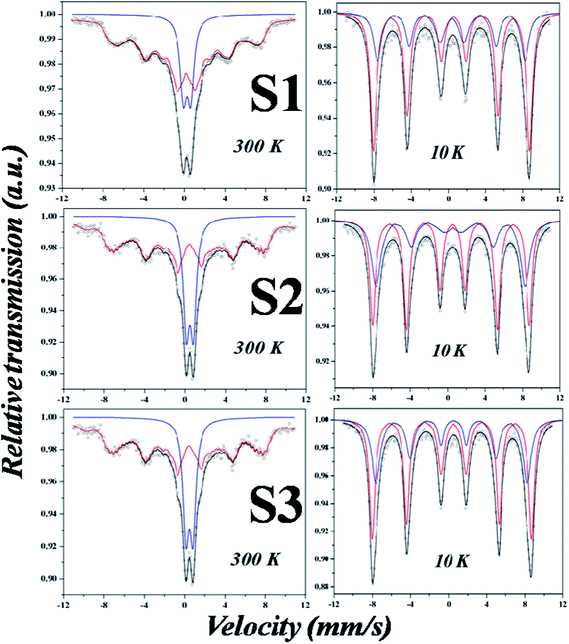 |
| | Fig. 7 Mössbauer spectra of Fe3O4 nanoparticles at 300 K (left) with the corresponding spectra at 10 K (right). | |
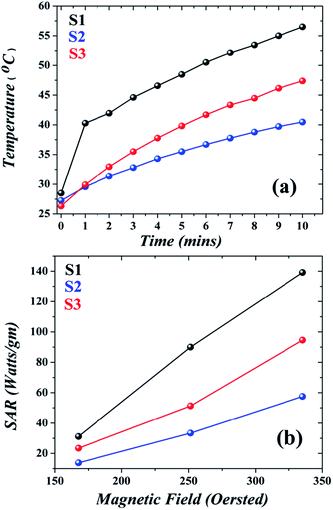 |
| | Fig. 8 (a) Temperature vs. time profile of IONP dispersion, S1 showing the highest SAR; (b) variation of SAR with magnetic field showing an increase in SAR with magnetic field amplitude. | |
Table 2 Effect of templates on the Mössbauer parameters of Fe3O4
| Sample name |
Type of fitting/site |
I. S.a (mm s−1) |
Q. S.b (mm s−1) |
L. W.c (mm s−1) |
Hhfd (KOe) |
% Area |
Area ratio (SB/SA) |
Vacancy (x) |
| I. S. = isomer shift. Q. S. = quadrupole splitting. L. W. = line width. Hhf = internal hyperfine field. |
| Measurement temperature: 300 K |
| S1 |
Doublet |
0.27 |
0.71 |
0.77 |
— |
19.45 |
— |
— |
| Distribution |
0.12 |
— |
— |
351.0 |
80.55 |
| S2 |
Doublet |
0.33 |
0.69 |
0.62 |
— |
28.91 |
| Distribution |
0.31 |
— |
— |
385.9 |
71.09 |
| S3 |
Doublet |
0.28 |
0.70 |
0.69 |
— |
24.34 |
| Distribution |
0.30 |
— |
— |
482.8 |
75.66 |
![[thin space (1/6-em)]](https://www.rsc.org/images/entities/char_2009.gif) |
| Measurement temperature: 10 K |
| S1 |
Fe3+(A) |
0.39 |
0.14 |
1.05 |
493.3 |
33.85 |
1.954 |
0.003 |
| Fe3+/Fe2+(B) |
0.46 |
0.10 |
0.78 |
521.9 |
66.15 |
| S2 |
Fe3+(A) |
0.46 |
0.17 |
1.51 |
493.34 |
40.47 |
1.470 |
0.039 |
| Fe3+/Fe2+(B) |
0.45 |
0.11 |
0.71 |
519.00 |
59.53 |
| S3 |
Fe3+ |
0.43 |
0.15 |
0.89 |
492.57 |
38.00 |
1.631 |
0.026 |
| Fe3+/Fe2+(B) |
0.44 |
0.10 |
0.73 |
519.61 |
62.00 |
3.5. AC magnetic field heating
The SAR was calculated from the equation| |
 | (5) |
where C is the specific heat of the dispersion (4.18 J g−1 K−1); considering the low concentration of nanoparticles in dispersions, specific heat of water was considered. ΔT/Δt is the heating rate calculated from the initial slope of the time dependent temperature curve, ‘m’ the particle concentration (=2 mg ml−1). The best SAR was obtained at field amplitude of 335.2 Oe; it was also the optimum field for heat generation since the therapeutic temperature of 42 °C was reached within 3 min, the time vs. temperature profile shown in Fig. 8(a). Since IONPs are superparamagnetic and semiconducting with a high value of resistivity, hysteresis and eddy current losses are considered negligible; as a result the heat should primarily be produced only due to relaxation processes. The time taken for the magnetization reversal is given by the Neel relaxation time (τN)| |
 | (6) |
where τ0 is the time constant (∼10−9 s), Keff is the effective anisotropy, V is the particle volume of the nanoparticle, KB is the Boltzmann constant and T is the absolute temperature. In the dispersed state Brownian relaxation occurs, the constant change in field direction results in friction between the particle and the carrier liquid which causes heating. The relaxation time (τB) is then given by| |
 | (7) |
where η is the dynamic viscosity of the carrier liquid and RH the hydrodynamic radius. As the particle sizes are within 4–8 nm, contributions from both processes co-exist and the total relaxation time (τtotal) is given by the geometric mean of τN and τB| |
 | (8) |
The hysteresis loss in AC magnetic field is given by
Since the reciprocal of the frequency f = 265 kHz is equal to 2 × 10⁻⁶ s (assumed to be the measurement time), the value being very close to the superparamagnetic spin relaxation time (10−9 s), hysteresis loss can no longer be ignored. The heat dissipated (loss power density) can be determined from the equation
| |
 | (10) |
where
Pac is the loss power density (Watts per m
3 or ergs cm
−3),
μ0 is the permeability in free space,
H0 is the magnetic field amplitude,
f is the frequency,
χ0 is the initial dc-magnetic susceptibility and
τ is the total relaxation time.
Pac is related to the specific absorption rate (SAR) (Watts per g) by the
eqn (5).
f and
H0 being constant for a particular set of experiments, the magnetic heating is solely dependent on the material properties. Experimentally, S1 recorded highest SAR followed by S3 and then S2 (
Table 3). Theoretically SAR was calculated from the
eqn (10); the values though followed the same trend, were much smaller than the experimental values, the excess contribution coming from the hysteresis losses.
20 In
Fig. 8(b) we can see that in accordance with
eqn (10), the SAR increased with the magnetic field for all the samples; S1 was the best among the three. To our surprise we saw that the template affected the relaxation mechanism; both in S3 and S1, the Brownian relaxation was predominant (
τtotal ∼
τB) while in S2, Neel relaxation (
τtotal ∼
τN) dominated. The CL molecule being large produces more viscous drag for the particle when it rotates in the magnetic field; the BSA on the other hand promotes moment reversal without actually rotating the particle. Again if we compare the
τtotal values, S3 is much bigger than S1 which proves that template 1 has a much more compact structure than template 3;
DH values also support such an observation. If templates coat uniformly, better magnetic heating is associated with less core-to-core interactions,
21 otherwise, interparticle interactions would lead to anisotropy energy barrier, then S3 having the highest anisotropy energy barrier (
KeffV = 3095.79 × 10
−15 erg) should have the highest SAR which is not the case. Demagnetizing effects which are typical between magnetic dipoles tend to hinder the collective transition of an ensemble of nanoparticles from one magnetic state to another.
22 Apart from the anisotropy energy barrier, particle size and
DH play crucial role in magnetic heating performance; it has been found that particles of bigger size and smaller hydrodynamic volume have the best SAR values. Considering particle size, S3 should have been the best material since it has a bigger size (7.5 nm) followed by S2 (4.9 nm) and S1 (4.4 nm) which is completely contrary to our observation. However considering
DH, we can clearly see that S1 having the least
DH (59.4 nm) exhibits maximum heating ability followed by S3 (88.05 nm) and S2 (116.2 nm). It seems that the demagnetizing interactions are greater in particles having large diameters. Actually all the three factors namely: (i) anisotropy energy barrier, (ii) particle size and (iii)
DH work in tandem in any nanoparticle system; the best heating materials are those that have the least core-to-core interaction.
Table 3 Relaxation parameters affecting anisotropy, SAR and r2
| Sample |
τNa (×10−5 s) |
τBb (×10−5 s) |
τtotalc (×10−5 s) |
KeffVd (×10−15 erg) |
SARexpte (Watts per g) |
r2f (ml s−1 mg−1) |
| τN = Neel relaxation time. τB = Brownian relaxation time. τtotal = total relaxation time. KeffV = anisotropy energy barrier. SAR = specific absorption rate. r2 = transverse relaxivity. |
| S1 |
760 |
7.9 |
7.8 |
2163.98 |
139.19 |
543.9 |
| S2 |
19.3 |
59 |
14.3 |
1698.21 |
57.48 |
380.7 |
| S3 |
1![[thin space (1/6-em)]](https://www.rsc.org/images/entities/char_2009.gif) 167 167![[thin space (1/6-em)]](https://www.rsc.org/images/entities/char_2009.gif) 000 000 |
25 |
24.9 |
3095.79 |
94.59 |
379.3 |
3.6. Magnetic resonance imaging
It was interesting to find the effect of the templates on transverse relaxivity of the nanoparticles. Fe3O4 nanoparticles are usually used as T2 contrast enhancers in clinical MRI where they decrease transverse relaxation time of 1H water protons in tissues. The water signal intensity was found to decrease with increasing echo time, analyzed using following equation to derive T2.| |
 | (11) |
where STE=0 is the signal of the saline water, TE is the echo time and T2 is the transverse relaxation time. The transverse relaxation rate (R2), estimated as 1/T2, was found to increase linearly with increase in concentration as shown in Fig. 9(a), (c) & (e). The r2 of S1 was found to be the highest 543 ml s−1 mg−1 compared to nearly same in S2 (380.7 ml s−1 mg−1) and S3 (379.3 ml s−1 mg−1). The T2 weighted MRI images for all the samples showed drastic reduction in MRI signal intensity in the liver after administration (Fig. 9(b), (d) & (f)) suggesting the potential of these IONPs for liver imaging. Although S1 shows highest relaxivity in vitro and a significant decline in MR intensity in vivo in liver, other nanoparticles S2 and S3 also exhibit a reduction in MR image intensity suggesting that even the other two have potential to be used as T2 contrast agent.
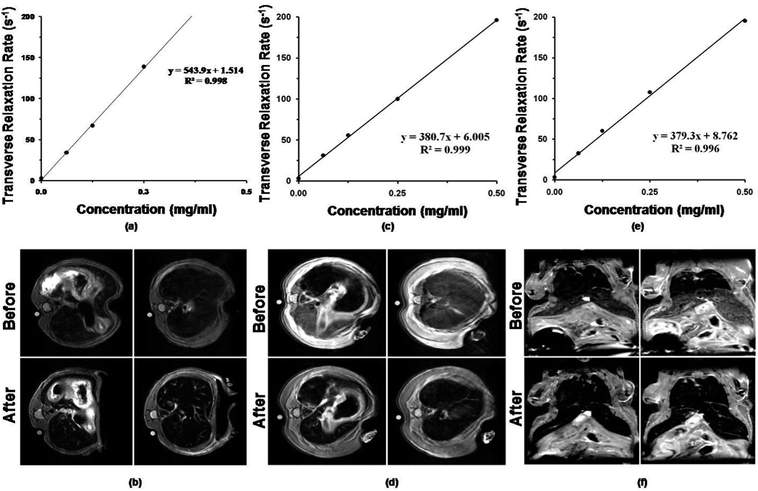 |
| | Fig. 9 Transverse relaxivity (r2) and T2 weighted images of mouse abdomen corresponding to (a) S1, (c) S2 and (e) S3 formulations depicting negative contrast. | |
It is a reported fact that the dipolar coupling between magnetic moments of water protons and the magnetic moments of IONPs cause effective spin dephasing and T2 relaxation leading to decrease in signal intensity.23 The magneto-structural properties and surface modifications profoundly affect the r2 values. As the particle size is reduced (≤10 nm) the corresponding reduction in MS reduces the T2 relaxation. In S2 and S3 the coating increases the spin canting or frustration of magnetic moments at the nanoparticle surface which decrease the net magnetization compared to S1 which had higher MS.4 It has been also reported that use of hydrophilic molecules as capping ligands allow for greater hydration around the magnetic core and yields higher transverse relaxivity compared to IONPs capped with hydrophobic ligands.4 If this is the sole criteria for higher r2, then S2 should exhibit the highest relaxivity. BSA, Gly and Glu are all hydrophilic molecules with the highest hydration layer around them. Hence, among these nanoparticles, the value of MS seems to be the deciding factor for relaxivity.
4. Conclusion
Copying biological mineralization is called “Biomimetics” and allows materials scientists to synthesize desired shapes of nanomaterials and self-assemble them to macro structures. Here, soluble additives such as proteins, amino acids and a biocompatible polymer act as nucleation promoters and/or growth modifiers. Synthesized using a modified patented process; a water-based, room temperature process for IONPs formation is discussed in this paper.
The three samples were characterized in detail using different characterization tools (TEM, DLS, XRD, FTIR, VSM, Mössbauer, etc.). S1 showed very good potential for magnetic hyperthermia and MRI (both in vitro and in vivo) while S2 and S3 showed potential for T2 contrast only. The magnetic hyperfine studies show S1 has greater magnetic component with respect to SPM relaxation at room temperature than other samples and the low temperature ordered states explain the phase purity of Fe3O4 nanoparticles. Our previous studies have proved the potential of these and two others for crossing the blood brain barrier and drug delivery.24 Thus, we conclude that precise control over the morphology and surface chemistry of IONPs is indeed of immense importance for biomedical applications. The three factors namely: (i) anisotropy energy barrier, (ii) particle size and (iii) DH work in tandem in any nanoparticle system; the best heating materials are those that have the least core-to-core interaction. The results in this paper justify that template 1 is the best of the three combinations for potential applications in biomedicine.
Acknowledgements
The authors acknowledge the help of Dr Joy Chakraborty for XRD analysis; Satnam Singh Sushmita Dey, Dr A. K. Panda for magnetic measurements and Mr Pranav for all editorial help. SB acknowledges the Council of Scientific and Industrial Research (CSIR), Govt. of India for providing senior research fellowship.
Notes and references
- M. G. Walls, C. Cao, K. Y. Zhang, J. Li, R. Che and Y. Pan, Microsc. Microanal., 2013, 19, 835–841 CrossRef CAS PubMed.
- R. Hergt, S. Dutz, R. Muller and M. Zeisberger, J. Phys.: Condens. Matter, 2006, 18, S2919–S2934 CrossRef CAS.
- C. Martinez-Boubeta, K. Simeonnidis, A. Makridis, M. Angelakeris, O. Iglesias, P. Guardia, A. Cabot, L. Yedra, S. Estrade, F. Peiro, Z. Saghi, P. A. Midgley, I. Conde-Leboran, D. Serantes and D. Baldomir, Sci. Rep., 2013, 3(1652), 1–8 Search PubMed.
- Z. R. Stephen, F. M. Kievit and M. Zhang, Mater. Today, 2011, 14, 330–338 CrossRef CAS.
- Y. Zhang, N. Kohler and M. Zhang, Biomaterials, 2002, 23, 1553–1561 CrossRef CAS.
- W. Baaziz, B. P. Pichon, S. Fleutot, Y. Liu, C. Lefevre, J. M. Greneche, M. Toumi, T. Mhiri and S. Begin-Colin, J. Phys. Chem. C, 2014, 118, 3795–3810 CAS.
- J. Fouinieau, K. Brymora, L. Ourry, F. Mammeri, N. Yaacoub, F. Calvayrac, S. Ammar-Merah and J. M. Greneche, J. Phys. Chem. C, 2013, 117, 14295–14302 Search PubMed.
- S. Nayar, A. Sinha and A. K. Pramanik, A biomimetic process for the synthesis of aqueous ferrofluids for biomedical applications, India, Oct 2009, complete filing 22nd Mar 2010, Application no. 0672DEL 2010.
- S. Bhattacharya, L. Sheikh, V. Tiwari, M. Ghosh, J. N. Patel, A. B. Patel and S. Nayar, J. Biomed. Nanotechnol., 2014, 10, 811–819 CrossRef CAS PubMed.
- R. Ghosh, L. Pradhan, Y. P. Devi, S. S. Meena, R. Tewari, A. Kumar, S. Sharma, N. S. Gajbhiye, R. K. Vatsa, B. N. Pandey and R. S. Ningthoujam, J. Mater. Chem., 2011, 21, 13388–13398 RSC.
- P. Swaminathan, Lecture 8: Structure of polycrystalline materials, http://mme.iitm.ac.in/swamnthn/sites/default/files/Lec8.pdf, accessed June 2014.
- T. K. McNab, R. A. Fox and A. J. F. Boyle, J. Appl. Phys., 1968, 39, 5703–5711 CrossRef CAS PubMed.
- A. P. Mary, T. N. Narayan, V. Sunny, D. Sakthikumar, Y. Yoshida, P. A. JOY and M. R. Anantharaman, Nanoscale Res. Lett., 2010, 5, 1706–1711 CrossRef PubMed.
- F. Nasirpouri, A. Nogaret and S. J. Bending, Effect of size and configuration on the magnetization of nickel dot arrays, IEEE Trans. Magn., 2011, 47(12), 4695–4700 CrossRef CAS ISSN 0018-9464.
- M. Levy, A. Quarta, A. Espinosa, A. Figuerola, C. Wilhelm, M. G. Hernandez, A. Genovese, A. Falqui, D. Alloyeau, R. Buonsanti, P. D. Cozzoli, M. A. García, F. Gazeau and T. Pellegrino, Chem. Mater., 2011, 23, 4170–4180 CrossRef CAS.
- A. Roychowdhury, S. P. Pati, A. K. Mishra, S. Kumar and D. Das, J. Phys. Chem. Solids, 2013, 74, 811–818 CrossRef CAS PubMed.
- A. Sinha, S. Nayar, B. K. Nath, D. Das and P. K. Mukhopadhyay, Colloids Surf., B, 2005, 43, 7–11 CrossRef CAS PubMed.
- J. M. D Coey, A. H. Morrish and G. A. Sawatzky, J. Phys., 1971, 32, C1–C271 Search PubMed.
- A. Roychowdhury, S. P. Pati, S. Kumar and D. Das, Powder Technol., 2014, 254, 583–590 CrossRef CAS PubMed.
- G. V. Fernandez, O. Whear, A. G. Roca, S. Hussain, J. Timmis, V. Patel and K. O'Grady, J. Phys. D: Appl. Phys., 2013, 46(312001), 1–6 Search PubMed.
- C. Blanco-Andujar, D. Ortega, P. Southern, Q. A. Pankhurst and N. T. K. Thanh, Nanoscale, 2015 10.1039/c4nr06239f advance article.
- X. Batlle, M. García del Muro and A. Labarta, Phys. Rev. B: Condens. Matter Mater. Phys., 1997, 55, 6440–6445 CrossRef CAS.
- M. Holz, Magn. Reson. Chem., 1993, 31, S154 CrossRef.
- D. Shi, L. Sun, L. Sheikh, S. Bhattacharya, S. Nayar and T. J. Webster, Nanotechnology, 2014, 25(075101), 1–5 Search PubMed.
|
| This journal is © The Royal Society of Chemistry 2015 |
Click here to see how this site uses Cookies. View our privacy policy here. 


![[double bond, length as m-dash]](https://www.rsc.org/images/entities/char_e001.gif) C–H at 3039 cm−1 are observed. The major difference observed is however, in the C–N stretch at 1074 cm−1 indicating an interaction of IONPs with biomolecules. The characteristic IR bands of magnetite are present at 3757 cm−1 which may be assigned to the surface OH groups of magnetite and at 580, 500 and 468 cm−1 due to the Fe–O stretching vibration.
C–H at 3039 cm−1 are observed. The major difference observed is however, in the C–N stretch at 1074 cm−1 indicating an interaction of IONPs with biomolecules. The characteristic IR bands of magnetite are present at 3757 cm−1 which may be assigned to the surface OH groups of magnetite and at 580, 500 and 468 cm−1 due to the Fe–O stretching vibration.

![[thin space (1/6-em)]](https://www.rsc.org/images/entities/char_2009.gif) :
:![[thin space (1/6-em)]](https://www.rsc.org/images/entities/char_2009.gif) A for stoichiometric Fe3O4 should be ideally 2
A for stoichiometric Fe3O4 should be ideally 2![[thin space (1/6-em)]](https://www.rsc.org/images/entities/char_2009.gif) :
:![[thin space (1/6-em)]](https://www.rsc.org/images/entities/char_2009.gif) 1, which in our case is 1.954 for S1, 1.470 for S2 and 1.631 for S3; these point to the fact that S1 is the best material among the three.
1, which in our case is 1.954 for S1, 1.470 for S2 and 1.631 for S3; these point to the fact that S1 is the best material among the three.


![[thin space (1/6-em)]](https://www.rsc.org/images/entities/char_2009.gif)


![[thin space (1/6-em)]](https://www.rsc.org/images/entities/char_2009.gif) 167
167![[thin space (1/6-em)]](https://www.rsc.org/images/entities/char_2009.gif) 000
000


