Preparation and characterization of ferromagnetic nickel oxide nanoparticles from three different precursors: application in drug delivery†
Jaydeep Adhikarya,
Prateeti Chakrabortya,
Balaram Dasb,
Arnab Dattaa,
Sandeep Kumar Dashb,
Somenath Royb,
Jeng-Wei Chen*c and
Tanmay Chattopadhyay*d
aDepartment of Chemistry, University of Calcutta, 92 A. P. C. Road, Kolkata-700 009, India
bImmunology & Microbiology Laboratory, Dept. of Human Physiology with Community Health, Vidyasagar University, Midnapore-721102, West Bengal, India
cDepartment of Physics, National Taiwan University, Taipei 106, Taiwan. E-mail: jwchen@phys.ntu.edu.tw
dDepartment of Chemistry, Panchakot Mahavidyalaya, Sarbari, Purulia, 723121, India. E-mail: tanmayc2003@gmail.com
First published on 14th April 2015
Abstract
Three varieties of nickel oxide nanoparticles [NiO(I), NiO(Br) and NiO(Cl)] have been prepared from three simple mononuclear nickel(II) Schiff-base complexes using a pyrolytic technique. The synthesized nanoparticles are characterized by FT-IR, UV-Vis, XRPD, DLS, SEM, TEM and EDX methods. All the techniques suggest the production of highly pure nickel oxides. The magnetic measurements reveal a small hysteresis loop at room temperature, confirming the super-paramagnetic (weak ferromagnetic) nature of the synthesized NiO nanoparticles. We have applied these nanoparticles for drug delivery. For this purpose, erythromycin, the well known broad spectrum antibiotic is conjugated with the NiO nanoparticles to develop NiO(I)-Ery, NiO(Br)-Ery and NiO(Cl)-Ery. These conjugated nanoparticles successfully deliver erythromycin towards both Gram positive and Gram negative bacteria and show effective antimicrobial activity against erythromycin resistant Staphylococcus aureus and Escherichia coli as model microbial species, evidenced from the Minimum Inhibitory Concentration (MIC) and Minimum Bactericidal Concentration (MBC) values. The order of efficiency toward drug delivery is NiO(I)-Ery > NiO(Br)-Ery > NiO(Cl)-Ery. Thus these conjugates can be applied to overcome the drug resistant properties of bacteria which will be a beneficial strategy in anti-bacterial therapy.
Introduction
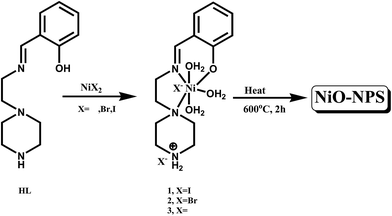
Nanostructured materials have attracted intense attention due to their amazing physical and chemical properties.1–3 Among the various types of nanomaterials, nanostructured transition-metal oxides deserve special consideration for their outstanding properties and technological applications.4–8 In particular, nanosized nickel oxide exhibits particular catalytic,9,10 anomalous electronic11,12 and magnetic13,14 properties. Another important application of NiO is in battery systems.15,16 Non-stoichiometric nickel oxide is a good P-type semiconductor owing to its defect structure,17 a potential gas sensor for H2 (ref. 18) and high active in the degradation of phenol, phenolic derivatives and dyes.19–21 However, synthesis of transition metal oxide nano particles with desired properties and having environmentally stability is very difficult to achieve. Moreover the available preparative methods like hydrothermal, combustion, ultrasonic-assisted and microwave-assisted hydrothermal22–26 are costly and time consuming. We have developed a simple pyrolytic technique to prepare metal oxide nano particles employing coordination polymers or coordination complexes as sole precursors.8,27–29 We report herein syntheses of three varieties of NiO nanoparticles, namely NiO(I), NiO(Br) and NiO(Cl) via pyrolysis of three previously reported mononuclear Nickel complexes,30 namely [NiL(H2O)3]I2·H2O (1), [NiL(H2O)3]Br2·H2O (2) and [NiL(H2O)3]Cl2·2H2O (3) [HL = 2-[(2-piperazin-1-yl ethylimino)-methyl]phenol] respectively as sole precursor(Scheme 1). Nanoparticles are characterized by UV-Vis, IR, X-ray powder diffraction (XRPD), energy-dispersive X-ray spectroscopy (EDX) and room temperature magnetic study. Morphology, size distribution and particle size have been evaluated by SEM, DLS and TEM measurements.Worldwide reported study show many advantages of nanoparticles based drug delivery system including prolonging the systemic circulation, sustainable release, preferential targeting etc. It is also investigated that drug-loaded nanoparticles can easily enter into the host cells through endocytosis and then release drug to treat microbes-induced intracellular infections.31–33 This process potentially helpful to overcome drug resistance property of the super bugs as it acts by endocytosis mechanism. Considering the global scenario of drug resistance microbial infection, there is an urgent need to develop such carrier agent which can overcome the issues. So, we decide to conjugate erythromycin on the surface of nano scaled NiO nanoparticles to deliver erythromycin against erythromycin resistant Escherichia coli and Staphylococcus aureus, isolated from clinical samples.34,35 Best of our knowledge this type of delivery system using this nanocarrier has not been studied till date.
Results and discussion
TGA spectra of complexes 1–3
Thermal studies of all the three complexes are reported earlier.30 Thermogram of all the complexes show well distinct stepwise decomposition (Fig. S1, ESI†). All three on heating at 600 °C, generate NiO as the thermally stable end product (for complex 1, expt. wt loss = 88.42% at 594 °C, theo. wt. loss = 87.79%; for complex 2 expt. wt loss = 80% at 595 °C, theo. wt. loss = 85.77% and for complex 3 expt. wt loss = 83.7% at 585 °C, theo. wt. loss = 83.55%).Infrared spectroscopy analysis of metal oxide nano particles
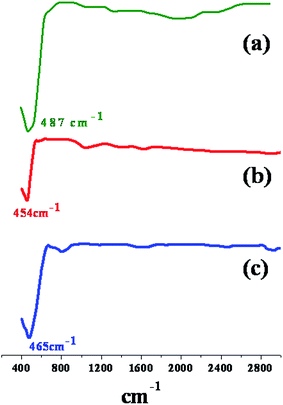
FT-IR spectra of the thermally stable end product NiO is represented in Fig. 1. The spectra show a strong band at the range of 454–487 cm−1 which assigned to the Ni–O stretching of the octahedral NiO6 groups in the face center cubic NiO structure.36,37 At this temperature, no bands appeared at about 3550 and 1650 cm−1 which suggested that no water molecules absorbed by the sample or KBr during FTIR experiment.X-ray diffraction analysis
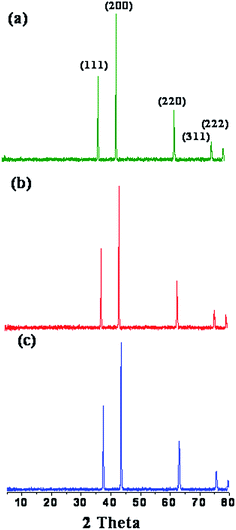
XRPD patterns of the decomposition products of the three complexes at 600 °C temperatures for 2 h are shown in Fig. 2. As shown in Fig. 2a–c the XRPD pattern of the samples produced at 600 °C reveals only the diffraction peaks attributable to NiO, created from complex 1, 2 and 3 respectively, with face-centered cubic phase at 2θ = 37.38°, 43.35° 63.10°, 75.63° and 79.53°, which can be perfectly related to (111), (200), (220), (311), and (222) crystal planes, respectively (JCPDS no. 04-0835). This finding confirms that at 600 °C the complex is decomposed completely to nickel oxide. No peaks of impurity are found in the XRPD pattern, indicating that the nanocrystalline NiO obtained via this synthesis method consists of ultrapure phase.Scanning electron microscopy (SEM) analysis
SEM images of NiO nanoparticles generated from complexes 1–3 are represented in Fig. 3(A)–(C), respectively. The nanoparticles have quite different shape and morphology. NiO generated from complex 1 have pyramid-shaped morphology along with some agglomerated particles. Pyramid-shaped NiO are very rare, reported only once previously.38 NiO, prepared from complex 2 have well agglomerated small particles. NiO(Cl) is also aggregated but the aggregated brick shaped particles are quite large in compare to other.Dynamic light scattering (DLS)
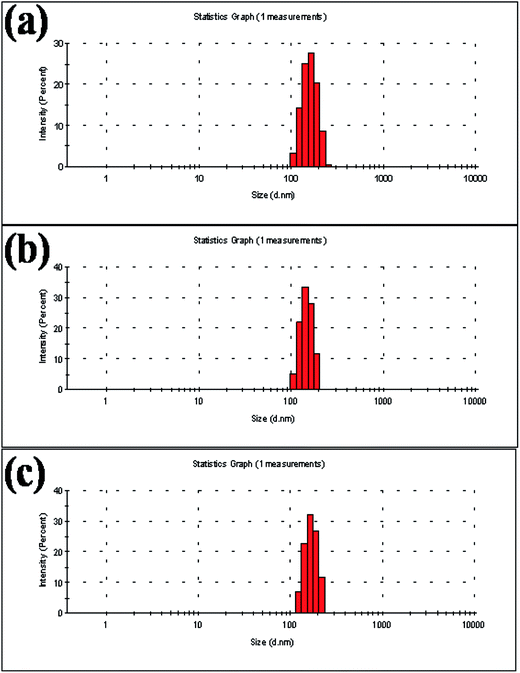
The measurement of the hydrodynamic size of NiO(I), NiO(Br) and NiO(Cl) by dynamic light scattering shows stable nonaggregated particles with a mean diameter of 200 ± 50 nm (Fig. 4). The PDI value of NiO(I), NiO(Br) and NiO(Cl) are 0.339, 0.410 and 0.442 respectively. The calculated size distribution histogram confirmed the size distribution of NPs. These NPs show good stability in water.Energy-dispersive X-ray spectroscopy (EDX)
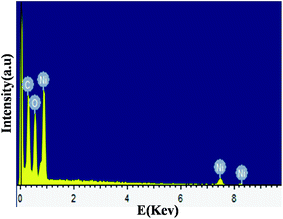
Fig. 5 shows the EDX spectrum of the prepared NiO(I) nanoparticles. EDX pattern for NiO(Br) and NiO(Cl) are represented in Fig. S2 and 3 (ESI†). Ni and O signals come from the NiO(I) nanoparticles. The atomic percentages of Ni and O are 50.91% and 49.09%, respectively. Furthermore, the ratio of Ni and O is about 1.03![[thin space (1/6-em)]](https://www.rsc.org/images/entities/char_2009.gif) :
:![[thin space (1/6-em)]](https://www.rsc.org/images/entities/char_2009.gif) 0.96 consistent with the theoretical value of NiO. The ratio are 1.01
0.96 consistent with the theoretical value of NiO. The ratio are 1.01![[thin space (1/6-em)]](https://www.rsc.org/images/entities/char_2009.gif) :
:![[thin space (1/6-em)]](https://www.rsc.org/images/entities/char_2009.gif) 0.98 and 0.97
0.98 and 0.97![[thin space (1/6-em)]](https://www.rsc.org/images/entities/char_2009.gif) :
:![[thin space (1/6-em)]](https://www.rsc.org/images/entities/char_2009.gif) 1.02 for NiO(Br) and NiO(Cl), respectively. The carbon(C) signals come from the coating material of the instrument. Apart from Ni and O elements, there is no peak of other impurities, suggest the purity of NiO nanoparticles.
1.02 for NiO(Br) and NiO(Cl), respectively. The carbon(C) signals come from the coating material of the instrument. Apart from Ni and O elements, there is no peak of other impurities, suggest the purity of NiO nanoparticles.
Transmission electron microscopy (TEM)
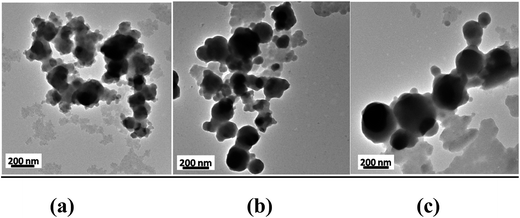
The transmission electron microscopy of all the three NPs shows virtually spherical geometry. The result is represented in Fig. 6(a–c). Though the particles are agglomerated but it can be concluded that the order of their particle size is NiO(Cl) > NiO(Br) > NiO(I). As the particles in TEM images are agglomerated, the size of the particle can't be correlated with hydrodynamic diameter measured from DLS experiment.Magnetic measurement
The magnetization versus magnetic field (M–H) curves of the NiO nanocrystalline samples are shown in Fig. 7. The NiO nanoparticles exhibit typical M–H behavior at room temperature. Fig. 7(a) shows the isothermal magnetization for the NiO(I) sample. The M–H curve reveals a symmetrical hysteresis loop in the low field. However, at higher fields the magnetization increases with increasing magnetic field and shows no sign of saturation in the field range investigated ±50 kOe (insets in Fig. 7(a)). The obtained value of coercivity is ∼100 Oe for this sample. Similar behaviors are observed for NiO(Br) and NiO(Cl) nanocrystalline samples (Fig. 7(b) and (c)), but with a smaller coercive fields of ∼10 Oe and ∼57 Oe, respectively. These behaviors indicate that the NiO nanocrystalline samples exhibit a ferromagnetic character in contrast to antiferromagnetic bulk material.39 The appearance of weak ferromagnetic-like behavior may probably due to the presence of superparamagnetic metallic Ni clusters or the Ni3+ ions within the NiO lattice.40,41 However, no traces of metallic Ni cluster and Ni3+ ions and other ferromagnetic impurities are detected by XRPD. Therefore, the weak ferromagnetism observed originates from the NiO nanocrystallite system. The weak ferromagnetic-like behavior in our sample may be attributed to the broken bonds and lattice distortion.41–43 It is well known that the lattice distortion usually occurs in the nano-scaled particles. However, further work is needed to achieve a thorough understanding of the origin of weak ferromagnetism for the nano-scaled antiferromagnetic particles.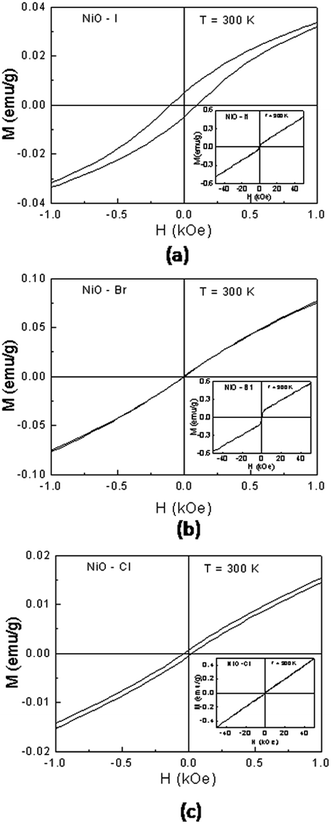 | ||
| Fig. 7 Magnetization versus applied magnetic field at room temperature for the (a) NiO(I), (b) NiO(Br) and (c) NiO(Cl) NPs. | ||
UV-Vis studies and band gap calculations
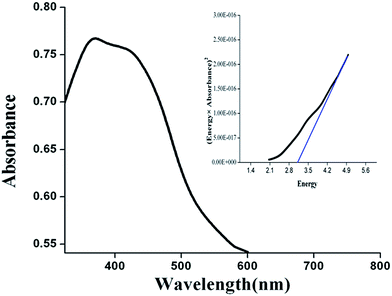
Once nano nickel oxide is confirmed then the optical characterization is important. The optical absorption spectrum of NiO(I) is shown in Fig. 8. It can be seen that the strongest absorption peak of the as-prepared sample appears at around 365 nm, indicating that the NiO nanoparticles prepared by this method could be a promising photocatalytic material. This absorption band is attributed to the electronic transition from the valence band to the conduction band in the NiO semiconductor. The inset of Fig. 8 shows the (αhν)2Vshν curve for the NiO. The bandgap energy calculated from UV-absorption is 3.23 eV for NiO(I). Eg values are 3.19 eV, 3.22 eV for NiO(Br) and NiO(Cl), respectively. These values are slightly lower than previous reports.37,44The direct optical band gap (Eg) of the NiO nanoparticles can be estimated by the Tauc Model.45
| αhν = D(hν − Eg)n |
Loading of erythromycin on NiO NPs and their characterization
The percentage of encapsulation efficiency (EE) and loading capacity (LC) of erythromycin with NiO are calculated by following the described procedure in Experimental section. The EE and LC are found to be 70% and 50.6% respectively. Higher EE and LC are one of the basic needs for drug targeting and delivery. Based on the results, the conjugated particles are selected for further assays. The erythromycin conjugated nanoparticles are characterized by FTIR, SEM and XRPD. FT-IR spectra for drug loaded nanoparticles and erythromycin are presented in Fig. S4–S7 (ESI†). The figure contains several peaks at 464, 569, 1020, 1385, 1542, 1638, 2853 and 2918 cm−1. First one is the characteristic peak for NiO and the rests are responsible for erythromycin. SEM image of drug loaded nanoparticles is presented in Fig. S8 (ESI†). The figure clearly shows the attachment of erythromycin to the surface of cubic NiO nanoparticles. We can also conclude that attachment of drug to the nanoparticles has been done by comparing the XRPD pattern of erythromycin and drug loaded nanoparticles (Fig. S9 and S10 in ESI† File). DLS size and Zeta potential of conjugated nanoparticles are represented in Table S1 (ESI†). The table suggests that the particles have average size of 260 ± 20 nm. The increment of size for conjugated particles from the nanoparticles confirms the loading of drug onto the NiO. Zeta Potential of NiO(I)-Ery, NiO(Br)-Ery and NiO(Cl)-Ery are −8.21, −17.8, −31.9 mV, respectively. These values corroborate the stability of synthesized particles in water. The stability and high loading capacity of the synthesized particles may be due to the presence of covalent interaction of NiO-NPs with five hydroxyl and two carbonyl groups present in erythromycin as reported previously.46Bio-activity study
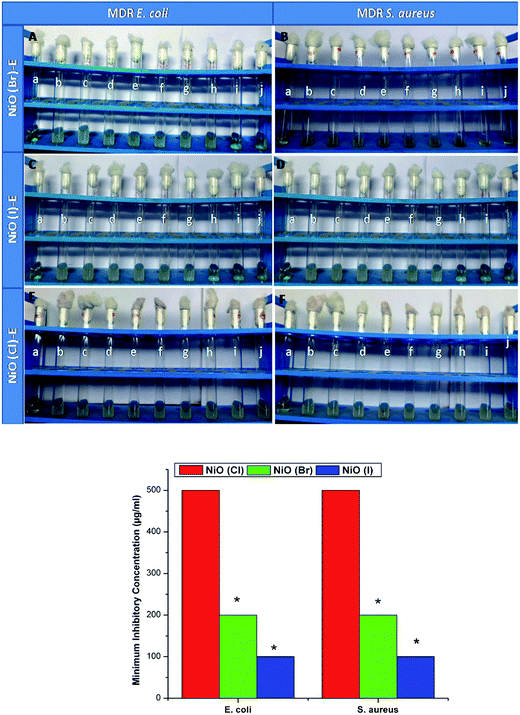
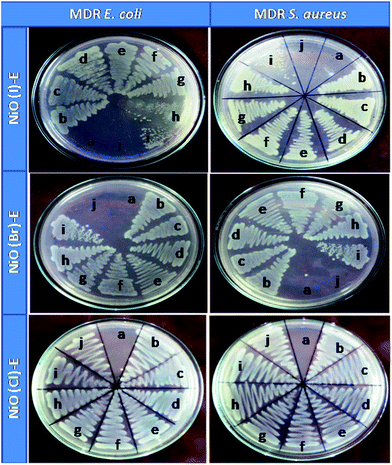
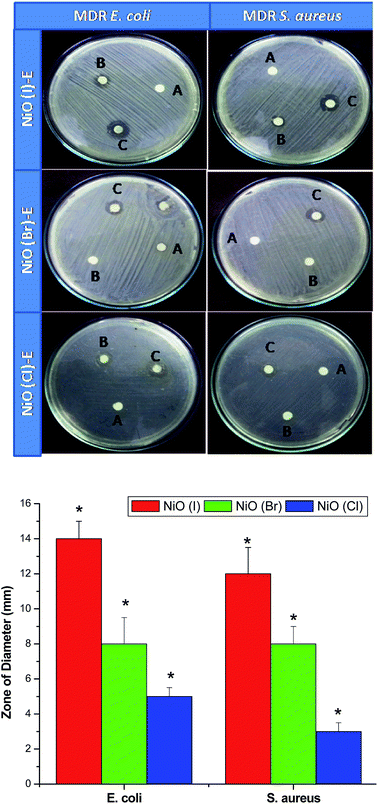
Nickel oxides has not any antimicrobial activity which is proved by MIC, MBC assays in this study, but erythromycin conjugated nickel oxide nanoparticles show well antimicrobial activity to combat bacterial resistant. The used bacterial strain (MMC 20 and MC8) are highly resistant to erythromycin which is confirmed by MIC, MBC and DAD assay (Fig. S11–13† and Table 1).
| Particles | Bacteria | MIC | MBC | Tolerance | DAD (mm) |
|---|---|---|---|---|---|
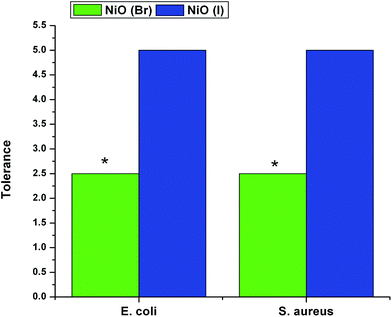
| (a) NiO(I)-Ery | (i) S. aureus (MMC-20) | 100 μg ml−1 | 500 μg ml−1 | 5 | 12 |
| (ii) E. coli (MC-8) | 100 μg ml−1 | 500 μg ml−1 | 5 | 14 | |
| (b) NiO(Br)-Ery | (i) S. aureus (MMC-20) | 200 μg ml−1 | 500 μg ml−1 | 2.5 | 8 |
| (ii) E. coli (MC-8) | 200 μg ml−1 | 500 μg ml−1 | 2.5 | 8 | |
| (c) NiO(Cl)-Ery | (i) S. aureus (MMC-20) | >500 μg ml−1 | >500 μg ml−1 | — | 3 |
| (ii) E. coli (MC-8) | >500 μg ml−1 | >500 μg ml−1 | — | 5 | |
| (d) Only erythromycin | (i) S. aureus (MMC-20) | >512 μg ml−1 | >512 μg ml−1 | — | No inhibition zone |
| (ii) E. coli (MC-8) | >512 μg ml−1 | >512 μg ml−1 | — | No inhibition zone |
In MIC, the growths are inhibited due to the penetration of nanoconjugated erythromycin into the bacterial cell that inhibits the bacterial growth and acts as a bactericidal agent followed by bacteriostatic activity. Significant differences in bactericidal activity are found between the NiO(I), NiO(Br), NiO(Cl) and erythromycin conjugated NiO(I), NiO(Br), NiO(Cl) treated set up. In this study we have not observed any significant bacteriocidal activity between Gram positive and Gram negative bacteria. It is also observed from our study that the tolerance level of Gram positive and. negative strains is increased significantly when charged with nanoconjugated erythromycin. It may be due to decrease MIC and increase the MBC value of nanoconjugated erythromycin treated Gram positive and negative strains as compared with Nickel oxides treatment. Visual image shows by DAD supports our results. Among these three nanoparticles, NiO(I)-Ery and NiO(Br)-Ery effectively deliver erythromycin to the drug resistant bacteria. NiO(I)-Ery can effectively deliver erythromycin due to its smaller size in compare to other. MIC, MBC, Tolerance and DAD values are tabulated in Table 1.
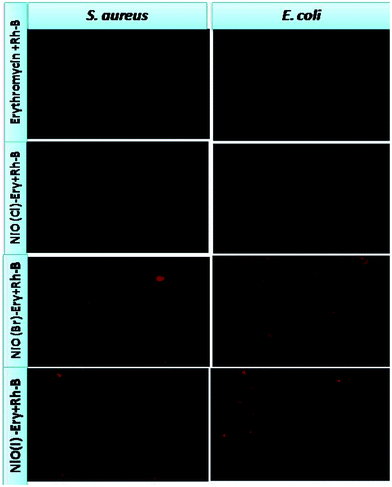
The zeta potential of drug conjugated nanoparticles and bacterial strains have been presented in Table S1 (ESI†). This size effect and surface charge effect, combined, might be responsible for the uptake of the nanoparticles in both bacterial cells (Chen et al., 2011).49a In our study, maximum uptake as well as maximum anti-bacterial activity is noted for NiO(I)-Ery for both bacterial strains. Among three Ery conjugates [NiO(I)-Ery, NiO (Br)-Ery, NiO(Cl)-Ery NPs] the NiO(I)-Ery particles had least negative surface charge (i.e. nearest to neutral charge). Being the both bacterial stains had highly negative zeta potential the NiO(I)-Ery particles showed maximum uptake owing to have smaller size with nearly neutral surface charge, while more negatively charged particles with bigger size range [NiO (Br)-Ery, NiO(Cl)-Ery NPs] had reduced uptake due to electrostatic repulsion with the cells. In this study it was also noted that the stability of three drug conjugates played another important role in cellular uptake. As the zeta potential value of NiO(I)-Ery was comparatively less negative it consisted of less electrostatic repulsion between particles which favors their higher entry in the bacterial cells comparatively other drug conjugates. So, in the internalization study less stable particles showed highest uptake efficiency. It was observed that the uptake of nanoparticle by cells consists of two steps: (a) the attachment of nanoparticles to the cell surface and (b) the internalization of nanoparticles by endocytosis pathway (Zhang et al., 2008).49 During endocytosis process, cells readily uptakes external substances by invigilating a small portion of the surface plasma membrane and form a new intracellular vesicle around the substance to transport inside the cells (Cooper 2000).50
Experimental
Materials
All chemicals are obtained from commercial sources and used as received. Solvents are dried according to standard procedure and distilled prior to use. Salicylaldehyde, N-(2-aminoethyl) piperazine, Nickel(II) chloride hexahydrate, Nickel(II) bromide hydrate, Nickel(II) iodide are purchased from Aldrich.Physical measurements
Infrared spectra (4000–500 cm−1) are recorded at 27 °C using a Perkin-Elmer RXI FT-IR spectrophotometer with KBr pellets. Electronic spectra (800–200 nm) are obtained at 27 °C using a Shimadzu UV-3101PC with methanol as solvent and reference. Thermal analyses (TG-DTA) are carried out on a Mettler Toledo (TGA/SDTA851) thermal analyzer in flowing dinitrogen (flow rate: 30 cm3 min−1). Field emission scanning electron microscope (FE-SEM) measurement is carried out with JEOL JSM-6700F field-emission microscope. All samples are coated with a thin layer of gold before examining. X-Ray powder diffraction (XRPD) is performed on a XPERT-PRO Diffractometer monochromated Cu-Kα radiation at room temperature. The X-rays are produced using a sealed tube and the wavelength of X-ray is 0.154 nm. To determine the crystallinity of the sample using operating voltage = 40 kV and operating current = 30 mA and 2θ = 20–80°. TEM, DLS, band gap calculation. The size distribution of the nanoparticles are determined by dynamic light scattering (DLS; Zetasizer Nano ZS; Malvern Instruments, Malvern, UK). The particle size and microstructure are studied by transmission electron microscopy (TEM) with a JEOL (Japan) JEM 2100 high-resolution transmission electron microscope operating at 200 kV. In brief, the nanoparticles are suspended in deionized water at a concentration of 1 mg ml−1, and then the sample is sonicated using a sonicator bath until the sample formed a homogeneous suspension. For size measurement, sonicated stock solution of all nanoparticles (0.5 mg ml−1) is diluted 20 times. A drop of aqueous nanoparticles suspension is placed onto a carbon-coated copper grid and this is dried in air to obtain transmission electron microscopy.Preparation of NiO nanoparticles
All the three precursor NiII complexes, namely [NiL(H2O)3]I2·H2O, [NiL(H2O)3]Br2·H2O and [NiL(H2O)3]Cl2·2H2O [HL = 2-[(2-piperazin-1-yl-ethylimino)-methyl]phenol] are synthesized following previously reported method.30 NiO(I), NiO(Br) and NiO(Cl) nanoparticles are then prepared by heating the complexes respectively at 600 °C for two hours. All the three precursor complexes are obtained as pure single crystals adopting the procedure as reported previously.30 For preparation of large amounts of NiO nanoparticles from the complexes, about 5 g weight of each complex is heated at a constant temperature of 600 °C for two hours in big platinum crucibles separately in a muffle furnace. The obtained NiO nanoparticles are then washed with methanol followed by water to remove the impurity. The pure NiO nanoparticles thus obtained are characterized by FT-IR spectroscopy, solid UV-Visible spectroscopy, XRPD, DLS, SEM and TEM images.Preparation of erythromycin conjugated NiO particles and measurement of encapsulation efficiency (EE) and loading capacity (LC)
Erythromycin loading on NiO nanoparticles has been achieved by adopting slightly modified procedure as reported previously.34 Briefly, 30 mg nanoparticles are stirred with a solution of erythromycin (25 mg per 10 ml) at 60 °C for 72 h. After stirring the mixture is centrifuged. The absorbance of the supernatant solution is measured by UV spectrometer (UV-1800 Shimadzu) at the wavelength of 285 nm and the weight of the free drug is calculated using standard curve of erythromycin. Then drug conjugated particles are recovered by simple filtration. The particles are then dried at 80 °C and then characterize by FTIR, SEM and XRPD. The encapsulation efficiency (EE) and loading capacity (LC) are calculated from the following formula:where, Wtot is the total weight of Ery taken, Wfree is the free Ery after loading. Wn is the weight of ultimate conjugate after drying. All measurements are performed in triplicate and the mean value is reported.
Biological activity
| Tolerance = MBC/MIC. |
![[thin space (1/6-em)]](https://www.rsc.org/images/entities/char_2009.gif) :
:![[thin space (1/6-em)]](https://www.rsc.org/images/entities/char_2009.gif) 1 v/v) with 1.0 mg Rh B solution is added to 25 ml (5 mg ml−1) of prepared erythromycin, NiO(I)-Ery, NiO(Br)-Ery, NiO(Cl)-Ery suspension, and the mixture is stirred at room temperature for 24 h in the dark. Then, these fluorolabeled erythromycin and nano conjugated erythromycin are separated by centrifugation (12
1 v/v) with 1.0 mg Rh B solution is added to 25 ml (5 mg ml−1) of prepared erythromycin, NiO(I)-Ery, NiO(Br)-Ery, NiO(Cl)-Ery suspension, and the mixture is stirred at room temperature for 24 h in the dark. Then, these fluorolabeled erythromycin and nano conjugated erythromycin are separated by centrifugation (12![[thin space (1/6-em)]](https://www.rsc.org/images/entities/char_2009.gif) 000 rpm) at 4 °C. The obtained sediment is washed with de-ionized water and re-dispersed. This process is repeated three times to remove the un-reacted Rh B. Finally, the obtained Rh B labeled drugs are dispersed in an aqueous solution for the in vitro experiment.
000 rpm) at 4 °C. The obtained sediment is washed with de-ionized water and re-dispersed. This process is repeated three times to remove the un-reacted Rh B. Finally, the obtained Rh B labeled drugs are dispersed in an aqueous solution for the in vitro experiment.E. coli and S. aureus are plated at a density of 5 × 10⁴ bacterial cells per Petri dish (35 mm) for 24 h. Rhodamine B tagged drugs at respective MIC concentrations are incubated for 3 h at 37 °C in incubator. After the defined time, the bacterial cells are washed two times with PBS and immediately observed in green light under a fluorescence microscope (Nikon Eclipse LV100POL) for uptake assessment. Images are acquired at 40× optical zoom.
Conclusion
In summary, we have prepared ferromagnetic NiO nanoparticles namely NiO(I), NiO(Br) and NiO(Cl) using three different precursors, mononuclear Nickel(II) complex, by a simple pyrolytic technique without using any catalyst or template. Although morphology and shape of those three varieties nickel oxide nanoparticles are more or less identical, they are differ slightly in the size as are evidenced from TEM, SEM and DSL measurements. Room temperature magnetic study reveals that all NiO nanoparticles are weak ferromagnetic in nature. These ferromagnetic NiO nanoparticles are conjugated with erythromycin which shows an effective anti-microbial activity against erythromycin resistant Escherichia coli and Staphylococcus aureus as are evidenced from MIC and MBC values. The order of their anti microbial activity is NiO(I)-Ery > NiO(Br)-Ery > NiO(Cl)-Ery. The reason behind the order of conjugated nanoparticles as antimicrobial agent is supposed to be due to the combined effect of size and surface charge of NiO nanoparticles. Smaller the size with nearly neutral surface charge (less negative) of nanoparticles exhibit higher internalization as well as higher antimicrobial activity. This study shows that erythromycin conjugated NiO nanoparticles have great promise as antimicrobial agent against E. coli and S. aureus and may be used as anti-microbial agents for the treatment of Gram positive and Gram negative bacteria.Acknowledgements
The instrumental support obtained from the Centre for Research on Nano Science and Nano Technology (CRNN), University of Calcutta is gratefully acknowledged. Tanmay Chattopadhyay is thankful to UGC-ERO, Kolkata [UGC-MRP no.: F. PSW252 195/13-14 (ERO); dated: 01.08.2014] for financial support. Authors are thankful to Professor Debasis Das, Department of Chemistry, University of Calcutta, Kolkata, India for his valuable suggestions.References
- A. T. Bell, Science, 2003, 299, 1688–1691 CrossRef CAS PubMed.
- M. G. Fernandez, A. A. Martinez, J. C. Hanson and J. A. Rodriguez, Chem. Rev., 2004, 104, 4063–4104 CrossRef PubMed.
- S. Sun, C. B. Murry, D. Weller, L. Folks and A. Moser, Science, 2000, 287, 1989–1992 CrossRef CAS.
- T. Ozkaya, A. Baykal, M. S. Toprak, Y. Koseoglu and S. Z. Durmu, J. Magn. Magn. Mater., 2009, 321, 2145–2149 CrossRef CAS PubMed.
- B. Liu and H. C. Zeng, J. Am. Chem. Soc., 2004, 126, 16744–16746 CrossRef CAS PubMed.
- J. J. Teo, Y. Chang and H. C. Zeng, Langmuir, 2006, 227, 7369–7377 CrossRef PubMed.
- M. S. Niasari, N. Mir and F. Davar, J. Phys. Chem. Solids, 2009, 70, 847–852 CrossRef PubMed.
- T. Ghosh, S. K. Dash, P. Chakraborty, A. Guha, K. Kawaguchi, S. Roy, T. Chattopadhyay and D. Das, RSC Adv., 2014, 4, 15022–15029 RSC.
- K. M. Dooley, S. Y. Chen and J. R. H. Ross, J. Catal., 1994, 145, 402–408 CrossRef CAS.
- A. Alejandre, F. Medina, P. Salagre, A. Fabregat and J. E. Sueiras, Appl. Catal., B, 1998, 18, 307–315 CrossRef CAS.
- L. Soriano, M. Abbate, J. Vogel and J. C. Fuggle, Chem. Phys. Lett., 1993, 208, 460–464 CrossRef CAS.
- V. Biji and M. A. Khadar, Mater. Sci. Eng., A, 2001, 304, 814–817 CrossRef.
- R. H. Kodama, S. A. Makhlouf and A. Berkowitz, Phys. Rev. Lett., 1997, 79, 1393–1396 CrossRef CAS.
- R. H. Kodama, J. Magn. Magn. Mater., 1999, 200, 359–372 CrossRef CAS.
- F. Li, H. Chen, C. Wang and K. Hu, J. Electroanal. Chem., 2002, 531, 53–60 CrossRef CAS.
- Y. Nuli, S. Zhao and Q. Qin, J. Power Sources, 2003, 114, 113–120 CrossRef CAS.
- R. Palombari, J. Electroanal. Chem., 2003, 546, 23–28 CrossRef CAS.
- M. Matsumiya, F. Qiu, W. Shin, N. Izu, N. Murayama and S. Kanzaki, Thin Solid Films, 2002, 419, 213–217 CrossRef CAS.
- T. L. Lai, Y. Y. Hong, G. Y. Gau, Y. Y. Shu and C. B. Wang, Appl. Catal., B, 2006, 68, 147–153 CrossRef CAS PubMed.
- K. Hayat, M. A. Gondal, M. M. Khaled and S. Ahmed, J. Mol. Catal. A: Chem., 2011, 336, 64–71 CrossRef CAS PubMed.
- H. He, S. Yang, K. Yu, Y. Ju, C. Sun and L. Wang, J. Hazard. Mater., 2010, 173, 393–400 CrossRef CAS PubMed.
- Y. Zhang, Y. Chen, T. Wang, J. Zhou and Y. Zhao, Microporous Mesoporous Mater., 2008, 114, 257–265 CrossRef CAS PubMed.
- P. J. Zhan, J. Alloys Compd., 2009, 478, 823–826 CrossRef CAS PubMed.
- R. K. Venkatesvara and C. S. Sunandana, Solid State Commun., 2008, 148, 32–37 CrossRef PubMed.
- W. H. Li, Mater. Lett., 2008, 62, 4149–4151 CrossRef CAS PubMed.
- A. Askarinejad and A. Morsali, Ultrason. Sonochem., 2009, 16, 124–131 CrossRef CAS PubMed.
- T. Ghosh, T. Chattopadhyay, S. Das, S. Mondal, E. Suresh, E. Zangrando and D. Das, Cryst. Growth Des., 2011, 11, 3198–3205 CAS.
- S. Mondal, T. Chattopadhyay, S. K. Neogi, T. Ghosh, A. Banerjee and D. Das, Mater. Lett., 2011, 65, 783–785 CrossRef CAS PubMed.
- S. Mondal, T. Chattopadhyay, S. Das, S. R. Maulik, S. Neogi and D. Das, Indian J. Chem., Sect. A: Inorg., Bio-inorg., Phys., Theor. Anal. Chem., 2012, 51, 807–811 Search PubMed.
- J. Adhikary, P. Chakraborty, S. Das, T. Chattopadhyay, A. Bauzá, S. K. Chattopadhyay, B. Ghosh, F. A. Mautner, A. Frontera and D. Das, Inorg. Chem., 2013, 52, 13442–13452 CrossRef CAS PubMed.
- L. Zhang, F. X. Gu, J. M. Chan, A. Z. Wang, R. S. Langer and O. C. Farokhzad, Clin. Pharmacol. Ther., 2008, 83, 761–769 CrossRef CAS PubMed.
- M. E. Davis, Z. G. Chen and D. M. Shin, Nat. Rev. Drug Discovery, 2008, 7, 771–782 CrossRef CAS PubMed.
- D. Peer, J. M. Karp, S. Hong, O. C. Farokhzad, R. Margalit and R. Langer, Nat. Nanotechnol., 2007, 2, 751–760 CrossRef CAS PubMed.
- S. Sahu and S. Mohapatra, Dalton Trans., 2013, 2224–2231 RSC.
- S. P. Chakraborty, S. Mahapatra, M. Bal, S. Roy and A. Ameen, J. Med. Sci., 2011, 4, 152–168 CAS.
- C. Wang, C. Shao, L. Wang, L. Zhang, X. Li and Y. Liu, J. Colloid Interface Sci., 2009, 333, 242 CrossRef CAS PubMed.
- S. Farhadi and Z. Roostaei-Zaniyani, Polyhedron, 2011, 30, 1244–1249 CrossRef CAS PubMed.
- C. T. Meneses, W. H. Flores, F. Garcia and J. M. Sasaki, J. Nanopart. Res., 2007, 9, 51–55 CrossRef.
- R. W. Chantrell, M. El-Hilo and K. O'Grady, IEEE Trans. Magn., 1991, 27, 3570–3578 CrossRef.
- J. T. Richardson, D. I. Yiagas, B. Turk, K. Forster and M. V. Twigg, J. Appl. Phys., 1991, 70, 6977–6982 CrossRef CAS PubMed.
- H. Bi, S. Li, Y. Zhang and Y. Du, J. Magn. Magn. Mater., 2004, 277, 363–367 CrossRef CAS PubMed.
- S. A. Makhlouf, F. T. Parker, F. E. Spada and A. E. Berkowitz, J. Appl. Phys., 1997, 81, 5561–5563 CrossRef CAS PubMed.
- R. H. Kodama, S. A. Makhlouf and A. E. Berkowitz, Phys. Rev. Lett., 1997, 79, 1393–1396 CrossRef CAS.
- (a) G. Boschloo and A. Hagfeldt, J. Phys. Chem. B, 2001, 195, 3039 CrossRef; (b) A. T. Ngo, P. Bonville and M. P. Pileni, Eur. Phys. J. B, 1999, 9, 583 CrossRef CAS.
- J. Tauc, Amorphous and Liquid Semiconductors, Plenum, London, 1974 Search PubMed.
- (a) M. Banoee, S. Seif, Z. E. Nazari, P. Jafari-Fesharaki, H. R. Shahverdi, A. Moballegh, K. M. Moghaddam and A. R. Shahverd, J. Biomed. Mater. Res., Part B, 2010, 93, 557–561 CrossRef PubMed; (b) A. M. Fayaz, K. Balaji, M. Girilal, R. Yadav, P. T. Kalaichelvan and R. Venketesan, Nanomedicine, 2010, 6, 103–109 CrossRef CAS PubMed.
- W. M. M. Kirby, Science, 1944, 99, 452–453 CAS.
- V. M. D'Costa, K. M. McGrann, D. W. Hughes and G. D. Wright, Science, 2006, 311, 374–377 CrossRef PubMed.
- (a) L. Chen, J. M. Mccrate, J. C. Lee and H. Li, Nanotechnology, 2011, 22, 105708 CrossRef PubMed; (b) C. Wilhelm, C. Billotey, J. Roger, J. N. Pons, J. C. Bacri and F. Gazeau, Biomaterials, 2003, 24, 1001–1011 CrossRef CAS; (c) E. C. Cho, J. W. Xie, P. A. Wurm and Y. N. Xia, Nano Lett., 2009, 9, 1080–1084 CrossRef CAS PubMed; (d) Y. Zhang, M. Yang, N. G. Portney, D. Cui, G. Budak, E. Ozbay, M. Ozkan and C. S. Ozkan, Biomed. Microdevices, 2008, 10, 321–328 CrossRef CAS PubMed.
- G. M. Cooper, The Cell: a Molecular Approach, ASM Press, Washington D.C, 2nd edn, 2000 Search PubMed.
- S. K. Dash, S. P. Chakraborty, D. Mandal and S. Roy, Int. J. Life Sci. Pharma Res., 2012, 2, L-25 Search PubMed.
- V. C. Okore, Pharm. Microbiol., 2005, 55, 120 Search PubMed.
- J. May, K. Shannon and A. King, J. Antimicrob. Chemother., 2006, 42, 189–197 CrossRef PubMed.
- A. W. Bauer, W. M. M. Kirby, J. C. Sherris and M. Turch, Am. J. Clin. Pathol., 1966, 45, 493–496 CAS.
Footnote |
| † Electronic supplementary information (ESI) available. See DOI: 10.1039/c5ra00642b |
| This journal is © The Royal Society of Chemistry 2015 |

