Excited-state deactivation mechanisms of protonated and neutral phenylalanine: a theoretical study

Reza Omidyan*, Mitra Ataelahi and Gholamhassan Azimi
Department of Chemistry, University of Isfahan, 81746-73441 Isfahan, Iran. E-mail: r.omidyan@sci.ui.ac.ir; reza.omidyan@u-psud.fr; Fax: +98 311 6689732

Received 12th January 2015 , Accepted 16th March 2015

First published on 16th March 2015


Abstract

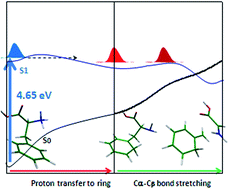
The potential energy (PE) profiles of neutral and protonated phenylalanine, as the simplest aromatic amino acid, at different electronic states have been investigated extensively using RI-MP2 and RI-CC2 methods. The PE profiles have been determined, considering the Cα–Cβ and Cα–C(COOH) bond stretching following proton transfer to the aromatic ring and CO group, respectively, as well as the hydrogen detachment reaction coordinate. The calculated results reveal that a low-barrier proton transfer process from ammonia to the aromatic chromophore, leading the excited system to Cα–Cβ bond cleavage, plays the most prominent role in the deactivation mechanism of excited PheH+ at the origin of the S1–S0 electronic transition. On the contrary, for excited neutral phenylalanine at the band origin of the S1–S0 transition, a large barrier in the S1 profile along the Cα–Cβ bond-stretching hinders the excited system from approaching the dissociative part of PE curve. This barrier may explain the large lifetime of the S1 excited phenylalanine (nanosecond range), while a low barrier in the S1 PE profile of the protonated species along the PT process explains the short-range lifetime of the protonated species (in the picosecond range).

1 Introduction

The molecular building blocks of organic systems readily absorb ultraviolet radiation. These molecules exhibit a large degree of photostability,1 originating from the quenching of excited systems through ultrafast non-radiative relaxation processes. Despite their large UV absorption cross-sections, aromatic amino acids, like tryptophan, tyrosine and phenylalanine, show very small fluorescence quantum yields. This observation deals with the presence of fast radiationless processes, which efficiently quench fluorescence.2,3 The radiationless process was assumed to be ultrafast internal conversion.2,4 This so-called photostability protects these molecules from undesired photoreactions that are triggered by UV irradiation.5,6

The spectroscopy of aromatic amino acids in molecular beams, either in their neutral state7–12 or protonated forms,13–15 has been extensively studied. Particularly, tryptophan is the most heavily studied owing to its large absorption cross section, high fluorescence intensity, and its strong sensitivity to the local protein environment.16–18 Although tyrosine and phenylalanine have weaker UV absorptions than tryptophan, understanding their spectroscopy and photophysical behavior is important due to their crucial role in biological systems.19–21

In addition, the fluorescence lifetime and intensity of aromatic amino acids are strongly dependent on the pH values of their environment and they drop dramatically at low pH. These results indicate a predominant non-radiative process, occurring after protonation.22 H. Shizuka and co-workers21 have shown that the fluorescence intensity of tryptophan markedly increases when it complexes with 18-crown-6. This observation suggests that the ammonium group plays a key role in the internal quenching of tryptophan. It has been stated that internal quenching is due to the hydrogen transfer from ammonia either to the ring or to the C[double bond, length as m-dash]O group, which produce new conformers.21,23 According to recent experimental and theoretical investigations, it has been well established that the Cα–Cβ bond stretching plays a prominent role in the photophysics of neutral and protonated aromatic amino acids.6,24 According to the experimental observations,23–25 it has been evidenced that the 1ππ* state undergoes a proton-transfer reaction from the amino group to the aromatic chromophore, which provides an efficient and fast pathway for internal conversion in protonated tryptophan and tyrosine, while a photo-fragmentation process occurring on the Cα–Cβ bond has been reported as the most prominent relaxation channel in the case of protonated phenylalanine.25 Also, in protonated tryptophan, a barrier-free H atom transfer to the carboxylic-acid oxygen through a small barrier has been predicted.23 In addition, it is well known that the photophysical properties of aromatic amino acids depend strongly on the status of the amino and carboxyl groups (in neutral and protonated states).26

The conformation of phenylalanine in a supersonic jet has been comprehensively studied by Martinez et al.9 They reported the laser induced fluorescence spectrum of the S1–S0 transition of jet-cooled phenylalanine and predicted the existence of multiple conformers using a laser saturation technique. Later, detailed investigation on the conformation of phenylalanine using IR-UV double resonance spectroscopy with ion detection and using ab initio calculations was presented by Snoek and co-workers.8

Regarding the excited state dynamics, in the case of protonated tryptophan (TrpH+), the S1 excited-state lifetime was measured as 380 fs following 266 nm excitation, and calculations of the excited-state dynamics suggest it could be even shorter.13,27 In contrast to protonated tryptophan, protonated tyrosine (TyrH+) shows a resolved vibronic spectrum and an excited-state lifetime of 22 picoseconds following excitation at 266 nm.28 In the case of phenylalanine, a combination of conformer-specific infrared and ultraviolet hole-burning spectroscopy was employed to assign structures to the five conformers.29,30 Lee et al.30 have reported that the excited state lifetimes of several phenylalanine conformers lie between 20–120 nanosecond, while the excited state lifetime of protonated phenylalanine has been estimated to be in the picosecond range.24 Nevertheless, little is known on the photophysics and photochemistry of amino acids; in particular, their relaxation dynamics are not well identified so far.

In the present paper we report our theoretical results on the deactivation mechanisms of protonated phenylalanine (PheH+) determined based on the RI-MP2/RI-CC2 methods. Thus, after summarizing the computational methods, we present ground- and excited-state optimized structures and excitation energies. We discuss and explain the potential energy curves, determined on the basis of several relaxation pathways of protonated phenylalanine, and compare our results with experimental observations on the fragmentation dynamics of protonated phenylalanine, taken from the literature. RI-CC2 is the method of choice because it gives reasonable results for medium-sized organic molecules, within a moderate computational time.23,31–37

2 Computational details

The “ab initio” calculations have been carried out with the TURBOMOLE (V 6.3) program suit,38,39 making use of the resolution-of-identity40 (RI) approximation for the evaluation of the electron repulsion integrals.

The equilibrium geometry of the titled systems at the ground state has been determined at the RI-MP2 (Möller–Plesset second order perturbation theory) level.41,42 The excitation energies and equilibrium geometry of the lowest excited singlet states have been determined at the RI-CC2 (the second-order approximate coupled-cluster method) level.43–47

The Dunning’s correlation consistent split-valence double-ζ basis set with polarization functions on all atoms (cc-pVDZ)48,49 and the augmented cc-pVDZ by diffuse functions on all atoms (aug-cc-pVDZ)50 have been employed. All of the potential energy profiles have been determined at the RI-MP2 and RI-CC2 levels, using the aug-cc-pVDZ basis function. The vibrational frequencies in both the ground and the first excited states were calculated at the MP2 and CC2 levels with the def2-SVP and aug-cc-pVDZ basis sets, in order to confirm the stationary transition points on the PE profiles, and correcting the adiabatic S1–S0 transition energies with ΔZPE (the difference between zero point vibrational energy of the ground and S1 excited states) respectively.

The abbreviations Phe and PheH+ will be used hereafter for neutral and protonated phenylalanine, respectively. In order to determine the potential energy profiles, the global minimum of protonated phenylalanine reported by Rizzo et al.14 has been considered as the initial structure of PheH+.

In addition, the validity of the RI-CC2 method for determination of the PE profiles of small organic systems has been established by Aquino and co-workers by comparison with accurate CASPT2 and MR-AQCC data.51 It has been shown that RI-CC2 predicts qualitatively reliable energy profiles of excited state proton transfer reactions. Hence, the RI-CC2 results are trustworthy for the qualitative determination of PE profiles.52–59

3 Results and discussion

3-A Ground state equilibrium structures

The peptide backbone of the neutral and protonated aromatic amino acids is very flexible; thus, several stable conformers might be available for both forms of neutral and protonated Phe. Nevertheless, it has not been the goal of the present study to perform highly accurate exploration of conformers and geometric structures. We have rather been interested in the development of a clear qualitative picture of the basic mechanisms of non-radiative deactivation processes, especially in the global minimum of protonated phenylalanine as the simplest aromatic amino acid. Fortunately, comprehensive experimental and theoretical studies on the conformations of PheH+ have been carried out by Stearns and co-workers, where they introduced the global minimum conformer of PheH+.14 We have presented this structure in Fig. 1a. As shown, the structure is stabilized by two types of H-bond: the N-terminal hydrogen interacts with the π-system (N–H15⋯π-ring) of the benzene ring, and another hydrogen atom (H13), near to the carbonyl oxygen atom, makes a N–H13⋯O[double bond, length as m-dash]C hydrogen bond.
image file: c5ra00630a-f1.tif
Fig. 1 Optimized geometries of (a) protonated phenylalanine (with its numbering pattern) and (b) the most stable conformer of neutral phenylalanine.

Similar to the protonated species, neutral phenylalanine (Phe) has several stable conformers in the gas phase. The electronic spectrum of phenylalanine in a supersonic jet, employing laser induced fluorescence (LIF) spectroscopy, has been recorded by Levy’s group.9 They also identified five different conformers, labeled A, B, C, D and E, stabilized in the low-temperature environment.9 Later, Z. Lin et al.,60 by means of full conformational space exploration, performed a comprehensive theoretical exploration of phenylalanine, and introduced 37 stable gaseous conformers for this amino acid molecule.

It has been well established that the most stable structure of phenylalanine is conformer A (of Levy’s group9), corresponding to the optimized structure represented in Fig. 1b. This structure has been selected in our present work for determination of the transition energies and oscillator strength and potential energy profiles of neutral phenylalanine.

3-B Excitation energies and molecular orbitals

The calculated vertical transition energies of neutral and protonated phenylalanine (most stable conformers), of the four lowest singlet transitions (S1–S4) together with the adiabatic S1–S0 electronic transition, have been tabulated in Table 1. In addition to oscillator strengths, the first four singlet excited-states have been presented. The vertical transition energies for protonated and neutral phenylalanine have been calculated using the optimized geometry of the global minimum of protonated and neutral phenylalanine, shown in Fig. 1a and b. Within the accuracy of the calculation, the vertical S1–S0 transition energies (as well as the adiabatic) in protonated and neutral phenylalanine are quite similar, while there is a large discrepancy between the second electronic transition (S2–S0) in neutral and protonated species.
Table 1 Excited transition energies of neutral and protonated phenylalanine, computed at the RI-MP2/RI-CC2 levels with two different basis setsa
State Transition energy/eV Oscillator strengths Configurations
aug-cc-pVDZ cc-pVDZ
a The value in brackets represent the difference between the zero point vibrational energy of the S1 excited and ground states in eV. The experimental band origins of the S1–S0 electronic transition (#ΔEexp.) for protonated and neutral phenylalanine have been adopted from ref. 25 and ref. 14, respectively.
Protonated phenylalanine (PheH+)
S1 (1ππ*)-vertical transition energy 5.07 5.17 0.0004 π2π1* (25%), π1π2* (25%), ππ1* (15%)
S1 (1ππ*)-adiabatic transition energy [ΔZPE] #ΔEexp. 4.85 [−0.21] #4.65 4.96  
S2 (ππCO*, πσ*) 6.08 6.28 0.0092 π3πCO* (18%), πσNH3* (14%), σπCO* (10%)
S3 (ππ*) 6.14 6.40 0.0160 π2π2* (28%), π1π1* (22%), π2π1* (21%)
S4 (πσ*, ππ*) 6.18 6.90 0.0170 π2σNH3* (55%), π2π2* (16%), π1σNH3* (8%)
Neutral phenylalanine (Phe)
S1 (1ππ*)-vertical transition 5.08 5.18 0.0005 π1π1* (32%), π2π2* (30%), π1π2* (19%)
S1 (1ππ*)-adiabatic transition energy #ΔEexp. 4.84 #4.65 4.99  
S2 (nσ*, nπ*) 5.56 5.81 0.0009 nOσNH3* (28%), nOπCO* (20%)
S3 (ππ*) 6.04 6.51 0.0204 π2π2* (38%), π2π1* (23%), π1π1* (23%)
S4 (nπ*, ππ*) 6.25 7.10 0.0224 nOπ1* (33%), nOπ2* (31%), π2π1* (13%)


In addition, the optical transitions to the lowest excited singlet states (S1, S2) of both neutral and protonated phenylalanine have weak oscillator strengths in the UV range. The frontier molecular orbitals (MOs) of protonated and neutral phenylalanine (the most stable conformers) are shown in Table 2. From the RI-CC2 calculations, it is found that the S1–S0 electronic transition of PheH+ gives rise to HOMO → LUMO + 1 (25%), HOMO − 1 → LUMO + 1 (15%) and HOMO − 1 → LUMO + 2 (25%) single electron transitions (HOMO and LUMO respectively indicate the highest occupied molecular orbital and the lowest unoccupied molecular orbital). As shown in Table 2, the HOMO and HOMO − 1 in PheH+ are of π nature, and LUMO + 1, LUMO + 2 are π*, located on the benzene ring. Thus, in PheH+, the first 1ππ* is a local transition. According to Tables 1 and 2, the S2–S0 transitions in Phe and PheH+ have nσ*/nπ* and ππ* characters, respectively.

Table 2 Frontier MOs of protonated and neutral phenylalanine. Only the MOs making significant contributions to the S1–S4 transitions have been depicted. H and L indicate HOMO and LUMO, respectively
Protonated phenylalanine (PheH+)
H − 4/π3 H − 2/σ2 H − 1/π2 H/π1 L/σNH3* L + 1/π1* L + 2/π2* L + 3/πCO*
image file: c5ra00630a-u1.tif image file: c5ra00630a-u2.tif image file: c5ra00630a-u3.tif image file: c5ra00630a-u4.tif image file: c5ra00630a-u5.tif image file: c5ra00630a-u6.tif image file: c5ra00630a-u7.tif image file: c5ra00630a-u8.tif
Neutral phenylalanine (Phe)
H − 2/nO H − 1/π1 H/π2 L/π1* L + 1/π2* L + 2/σ1* L + 3/πCO*  
image file: c5ra00630a-u9.tif image file: c5ra00630a-u10.tif image file: c5ra00630a-u11.tif image file: c5ra00630a-u12.tif image file: c5ra00630a-u13.tif image file: c5ra00630a-u14.tif image file: c5ra00630a-u15.tif  


For neutral phenylalanine, the S1 state corresponds to the single electron transitions from HOMO → LUMO (32%), HOMO → LUMO + 1 (19%) and HOMO − 1 → LUMO + 1 (30%). As shown in Table 2, the HOMO and HOMO − 1 orbitals of Phe are different π orbitals, which are located on the benzene ring. Also, the LUMO, and LUMO + 1 are of π* nature, indicating that the S1 state of phenylalanine has mostly ππ* nature.

In order to evaluate our method and basis set, we recalculated the adiabatic S1–S0 electronic transition energies of neutral and protonated phenylalanine, for which the jet cooled experimental data is available9,14,61 (see Table 2). The S1 band origin of neutral phenylalanine has been reported by Martinez et al., amounting to 37[thin space (1/6-em)]537 cm−1 (4.654 eV).9 For the protonated case (PheH+), it has been reported to be 37[thin space (1/6-em)]529 cm−1 (4.653 eV) by Stearns14 and Féraud.25 As shown in Table 2, there is good agreement between the experimental band origins and our calculated values at the RI-CC2/aug-cc-pVDZ level of theory (ΔE(S1–S0) = 4.85 eV and 4.84 eV, respectively, for protonated and neutral species). Nevertheless, considering the difference between the zero point vibrational energies of the ground and excited states (ΔZPE = −0.21 eV), the S1–S0 transition energy of the RI-CC2/aug-cc-pVDZ level (4.64 eV, ΔZPE corrected) is in the excellent agreement with the experimental band origin of PheH+ reported by Stearns14 and Féraud61 (see Table 1).

3-C. Photophysical behavior: potential energy profiles

3-C-A Protonated phenylalanine (PheH+).
I Cα–Cβ bond stretching (before and after PT to aromatic ring). The photofragmentation spectrum of protonated phenylalanine (PheH+) has been recorded by Stearns et al.14 and most recently by Féraud and co-workers.25 One of the most remarkable results of these experiments was the observation of specific fragmentation channels. Around the band origin of the S1–S0 electronic excitation, the protonated molecule mostly fragments through Cα–Cβ bond rupture,14,25 which is the only fragmentation leading to detection of m/z 75 and 92. The former fragment has been assigned to [HOOC–CH2–NH2]+, and the latter is related to [C6H5–CH2]+ and [C6H5–CH3]+. We have been motivated to determine the PE profiles relevant to the Cα–Cβ bond rupture mechanism under two conditions: before and after proton transfer to the benzene ring.

In Fig. 2a, the potential energy profiles calculated along the minimum energy paths (MEPs) for the bond stretching of Cα–Cβ at the S0 and S1 states are shown (full curves, designated by S0(S0) and S1(S1)). The coordinate-driven minimum-energy paths have been obtained by fixing the Cα–Cβ bond distance and optimizing the lowest S1 (1ππ*) state with respect to all other coordinates. The geometry optimizations have been performed with the RI-CC2 method. The energies at the optimized geometries have been calculated at the RI-CC2/aug-cc-pVDZ level.


image file: c5ra00630a-f2.tif
Fig. 2 Minimum energy paths (MEPs) of the S0 state (circles) and the S1 (ππ*) state (squares), determined at the RI-CC2/aug-cc-pVDZ level as a function of (a) Cα–Cβ bond stretching, (b) N–H bond stretching, and (c) Cα–Cβ bond stretching after PT in protonated phenylalanine. The solid lines (S0(s0) and S1(s1)) represent the energy profiles of the reaction paths determined in the same electronic state and the dashed lines (S0(s1) and S1(s0)) show the energy profiles determined in the complementary electronic states.

The PE profiles of the S0 state, calculated with the 1ππ*-optimized geometries (dashed lines with hollow circles), as well as the S0-optimized geometries determined with the RI-MP2 method (solid lines with filled circles), are also shown. As shown, the S1 PE profile along the Cα–Cβ bond-stretching coordinate shows a barrier of 0.65 eV. The vibrational frequency analysis at RCα–Cβ = 2.0 Å shows an imaginary frequency, confirming the transition state (TS) nature of this point in the middle of the reaction coordinate (see ESI file). Because of the large hindering effect of this barrier, the Cα–Cβ bond stretching before a PT process is not suggested to play the role of a prominent relaxation-channel for the excited PheH+ at the origin of the S0–S1 transition.

However, according to the seminal work of C. Jouvet and co-workers,23 it has been shown that proton transfer from the ammonium to the benzene ring is an important deactivation pathway in protonated tryptophan and tyrosine. Thus, we have investigated the minimum energy path (MEP) for PT from ammonia to the ring in PheH+ (Fig. 2b). The coordinate-driven minimum-energy paths for PT have been obtained by fixing the proton-transfer coordinates (N–H15), containing the N–H15⋯π hydrogen bond, and optimizing the lowest S1 (1ππ*) state geometry with respect to all other coordinates. As shown, the MEP exhibits a transition state at RN–H15 = 1.5 Å, corresponding to the top of the barrier in the middle of reaction coordinate of the PT process (ΔE = 0.35 eV). Nevertheless, the barrier is not so large and can be overcome by a wave packet prepared at the origin of the S1–S0 transition. In addition, the tunneling effect of the hydrogen atom through the barrier, due to its slight mass, can be another possibility for passing the barrier and leading the excited system to the dissociation region of the PE profile. Under this condition, the excited system may evolve to Cα–Cβ bond rupture.

In Fig. 2c, the MEP for Cα–Cβ bond breaking, following the PT process to the aromatic ring, has been depicted. As shown, there is a small barrier in panel c, which is less pronounced than that in the previous panel. This barrier locates roughly under the S1 band origin of global PheH+. Indeed, the Cα–Cβ bond cleavage after the PT process under such conditions can be triggered by proton transfer from ammonia to the benzene ring. Moreover, from inspection of Fig. 2c, it is seen that a conical intersection appears at the end of the reaction coordinate (Cα–Cβ ∼ 2.5 Å), where the Cα–Cβ bond is almost broken. With such long lengths of the Cα–Cβ bond, there is no sufficient force to turn the excited system back to the ground state, and thus photodissociation of the excited system after the CI must be more favored.

Additionally, vibrational frequency analysis has been carried out for selected points of Fig. 2a–c. The results have been presented in the ESI file. All of the vibrational frequencies for the first points of panels a and b (Fig. 2a and b) are positive, confirming the stationary nature of these points on the PE surface. Nevertheless, in Fig. 2a–c there are three transition states, corresponding to the maximum points of each panel, having one imaginary frequency along the reaction coordinate.


II PT to C[double bond, length as m-dash]O and hydrogen detachment reactions. According to the experimental results, by increasing the excitation photon energy, roughly above the band origin of the S1–S0 transition, a new fragmentation channel at m/z 120 appears. This fragmentation result has been assigned by Féraud et al.25 to the bond breaking of C8–C9 following a proton transfer to the carbonyl group, leading to the formation of an iminium ion, CO and H2O from PheH+. This fragmentation channel has been assigned to Cα–C(COOH) bond breaking following the PT process from –NH3 to carbonyl. Indeed, the carbonyl C[double bond, length as m-dash]O group, in addition to –NH2 and the benzene ring, is another electron rich center that attracts a proton. When the excess proton locates on the oxygen atom of the carbonyl group (C[double bond, length as m-dash]O), it gives an isomer with an internal energy of ∼0.80 eV (77.2 kJ mol−1) higher than that of global minimum. Nevertheless, we have determined the PE profiles of the PT reaction from –NH3 to C[double bond, length as m-dash]O at the S1 and S0 states (Fig. 3), in order to obtain more information on the PT process at the excited state. The PE profiles of Fig. 3a have been calculated along the N–H13 bond, containing the (C[double bond, length as m-dash]O⋯H13–N) hydrogen bond, while in Fig. 3b, the C8–C9 bond has been selected as the reaction coordinate. Considering the MEP curves in Fig. 3a, in the S1 (ππ*) state, there is a large barrier hindering the excited system from proceeding along the reaction coordinate. From Fig. 3a and b, it is seen that a wave packet prepared by excitation of PheH+ at the origin of the S1 transition cannot simply overcome the barriers and proceed to the dissociative region of Fig. 3a and b. Thus, sufficient excess energy, more than the band origin of the S1 state of PheH+, will be required for opening this dissociation channel.
image file: c5ra00630a-f3.tif
Fig. 3 Minimum energy paths (MEPs) of the S0 state (circles) and the S1 (ππ*) state (squares), determined at the RI-CC2/aug-cc-pVDZ level as a function of (a) N–H15, and (b) the Cα–Cβ bond stretching and (c) the N–H16 in the protonated phenylalanine.

Under such conditions, the excited system overcomes both barriers of Fig. 3a and b, and proceeds to the end of the reaction coordinate, which corresponds to the bond cleavage of Cα–C(COOH). This bond cleavage can be responsible for photo-fragmentation of PheH+, producing CO + H2O fragments, above the band origin of the S1–S0 transition.

It is noteworthy that the photo-fragment of m/z 120, corresponding to CO + H2O fragments, has been observed 531 cm−1 (0.065 eV) above the band origin of PheH+ by Féraud et al.25 However, RI-CC2, being a single reference method, is unable to precisely determine the crucial points, such as conical intersections and potential barriers, and its results are only qualitatively reliable.52–59 Additionally, the CO + H2O fragments have been observed in the CID (Collision-Induced Dissociation) experiments too.62 Thus, there is another possibility that decreasing the S1, S0 energy gap of PheH+ after proton transfer from ammonia to C[double bond, length as m-dash]O (Fig. 3, panel a) leads the excited system to the ground state via ultrafast internal conversions, and then the PheH+ system undergoes fragmentation from the S0 PE profile.

The PE profiles for the hydrogen detachment channel have been investigated, as another suggestion for the deactivation of PheH+. The potential energy profiles calculated along the minimum energy paths (MEPs) for N–H16 bond stretching at the S0 and S1 states are presented in Fig. 3c. As shown, there is a large barrier in the middle of the S1 PE profile along the reaction coordinate. From Fig. 3c, it is seen that a large barrier of 0.90 eV height hinders the excited system of the S1 (1ππ*) state from proceeding along the reaction coordinate. Thus, the hydrogen detachment deactivation pathway has been predicted to be very unlikely. However, this deactivation mechanism can be accessed only when the excited system contains plenty of excess energy (0.9 eV more than the band origin of the S1–S0 transition).

Furthermore, the vibrational frequency analysis verifies the TS nature of the maximum points (RN–H = 1.4 Å and RCα–Cβ = 1.8 Å, respectively, in Fig. 3a and b). However, the calculated vibrational frequencies for the maximum point of the S1 PE profile of Fig. 3c (RN–H16 = 1.4 Å) show more than one imaginary frequency, indicating a hilltop nature for this point. The excited system on the hilltop is extremely unstable and may undergo several reactions; among them, the N–H stretching leads the excited system to the end of the reaction coordinate, where the S1/S0 PE profiles cross with each other and produce a conical intersection in the multi dimensional picture. This CI could be responsible for the non-radiative deactivation of system via ultrafast internal conversions.

3-C-B Neutral phenylalanine. Although UV absorption and fluorescence spectra of phenylalanine and its derivatives have been studied by Wiczk’s group,63 to our knowledge, there is no extensive theoretical report on the relaxation dynamics and deactivation pathways of this molecule. Nevertheless, the long lifetime of the S1 excited phenylalanine (nanosecond range), reported by Lee et al.,30 indicates a stable S1 character of isolated Phe. Thus, we have determined the PE profiles of phenylalanine along Cα–Cβ bond stretching to obtain more information on the photophysics of this system.

In Fig. 4, the S0, S1 PE curves along with the Cα–Cβ bond stretching have been presented. From inspection of these results, it is seen that the MEP profile of the S1 (ππ*) excited state has a rising trend, showing a TS (i.e. a barrier of ∼0.61 eV magnitude) at R(Cα–Cβ) = 2.0 Å (see ESI file), then slowly shows a dissociative trend to the end of the reaction coordinate. Meanwhile, the S0 PE curve has a rising trend, and near the end of the reaction coordinate (R = 2.3 Å) the S1 (ππ*) crosses with the S0 electronic state, which develops into the conical intersections (CIs) in a multidimensional picture. Nevertheless, only the wave packet prepared in the 1ππ* state by optical excitation of adequate excess energy (≃0.60 eV) is able to pass the barrier and reach the CI, which is expected to lead the excited system to the ground state with an internal conversion. Thus, the conical intersection of the S1–S0 states at the end of reaction coordinate may mostly play the role of a photostabilizer to protect neutral phenylalanine against UV radiation of λex < 240 nm, via ultrafast internal conversion. Alternatively, from the CI region, the excited system may undergo dissociation along the Cα–Cβ bond, producing photoproduct radicals.


image file: c5ra00630a-f4.tif
Fig. 4 The MEPs profiles of the electronic ground state (circles) and the lowest excited state (squares) as a function of the Cα–Cβ stretching coordinate in neutral phenylalanine.

4 Conclusion

Ab initio electronic structure and reaction path calculations, at the RI-CC2 level of theory, have been carried out to characterize the relaxation dynamics in protonated and neutral phenylalanine. The excited state intramolecular proton transfer to the aromatic ring has been predicted to be the most favorable consequence of excitation of PheH+ at the origin of the S1–S0 transition. The low barrier PT process to the aromatic chromophore consequently leads the excited system to Cα–Cβ bond cleavage. In contrast, the PT process from ammonia to the carbonyl group (C[double bond, length as m-dash]O), the same as the hydrogen detachment reaction coordinate, involves large hindering barriers along the S1 potential energy curves. When the excited system contains small excess energy above the band origin of the S1 transition, the excited state PT process to C[double bond, length as m-dash]O leads the excited system to Cα–C(COOH) bond breaking. Although relaxation of PheH+ along the hydrogen detachment pathway should be extremely unlikely at the band origin of the S1 transition, it can be responsible for relaxation of the photoexcited system with ∼0.9 eV excess energy above the band origin.

For neutral phenylalanine, the large lifetime of the S1 state (nanosecond) can be explained by the lack of nonradiative relaxation channels from the origin of the S1 transition to the ground state. The Cα–Cβ bond stretching investigated in this study has a barrier of 0.61 eV magnitude, restricting the excited system from approaching the dissociative region and conical intersection. For definite, this relaxation channel in neutral phenylalanine can be proposed as the UV protection of phenylalanine when excited at λex < 240 nm.

Acknowledgements

The research council of Isfahan University is acknowledged for financial support. The authors are greatly indebted to Prof. C. Jouvet (University of Aix-Marseille) for helpful comments. The use of computing facility cluster GMPCS of the LUMAT federation (FR LUMAT2764) is kindly appreciated.

References

  1. D. Creed, Photochem. Photobiol., 1984, 39, 537–562 CrossRef CAS.
  2. C. E. Crespo-Hernandez, B. Cohen, P. M. Hare and B. Kohler, Chem. Rev., 2004, 104, 1977–2019 CrossRef CAS PubMed.
  3. M. B. Robin, Higher Excited States of Polyatomic Molecules, Academic, New York, 1972 Search PubMed.
  4. A. Reuther, H. Iglev, R. Laenen and A. Laubereau, Chem. Phys. Lett., 2000, 325, 360–368 CrossRef CAS.
  5. W. Domcke and A. L. Sobolewski, Nat. Chem., 2013, 5, 257–258 CrossRef CAS PubMed.
  6. C.-M. Tseng, M.-F. Lin, Y. L. Yang, Y. C. Ho, C.-K. Ni and J.-L. Chang, Phys. Chem. Chem. Phys., 2010, 12, 4989–4995 RSC.
  7. R. Cohen, B. Brauer, E. Nir, L. Grace and M. S. de Vries, J. Phys. Chem. A, 2000, 104, 6351–6355 CrossRef CAS.
  8. L. C. Snoek, E. G. Robertson, R. T. Kroemer and J. P. Simons, Chem. Phys. Lett., 2000, 321, 49–56 CrossRef CAS.
  9. S. J. Martinez, J. C. Alfano and D. H. Levy, J. Mol. Spectrosc., 1992, 156, 421–430 CrossRef CAS.
  10. J. M. Bakker, L. M. Aleese, G. Meijer and G. von Helden, Phys. Rev. Lett., 2003, 91, 203003 CrossRef PubMed.
  11. T. R. Rizzo, Y. D. Park, L. A. Peteanu and D. H. Levy, J. Chem. Phys., 1986, 84, 2534–2541 CrossRef CAS.
  12. L. C. Snoek, R. T. Kroemer, M. R. Hockridge and J. P. Simons, Phys. Chem. Chem. Phys., 2001, 3, 1819–1826 RSC.
  13. O. V. Boyarkin, S. R. Mercier, A. Kamariotis and T. R. Rizzo, J. Am. Chem. Soc., 2006, 128, 2816–2817 CrossRef CAS PubMed.
  14. J. A. Stearns, S. Mercier, C. Seaiby, M. Guidi, O. V. Boyarkin and T. R. Rizzo, J. Am. Chem. Soc., 2007, 129, 11814–11820 CrossRef CAS PubMed.
  15. F. O. Talbot, T. Tabarin, R. Antoine, M. Broyer and P. Dugourd, J. Chem. Phys., 2005, 122, 074310 CrossRef PubMed.
  16. R. H. Callender, R. B. Dyer, R. Gilmanshin and W. H. Woodruff, Annu. Rev. Phys. Chem., 1998, 49, 173–202 CrossRef CAS PubMed.
  17. M. Gruebele, Annu. Rev. Phys. Chem., 1999, 50, 485–516 CrossRef CAS PubMed.
  18. T. Q. Liu, P. R. Callis, B. H. Hesp, M. de Groot, W. J. Buma and J. Broos, J. Am. Chem. Soc., 2005, 127, 4104–4113 CrossRef CAS PubMed.
  19. C. S. Hoaglund-Hyzer, A. E. Counterman and D. E. Clemmer, Chem. Rev., 1999, 99, 3037–3079 CrossRef CAS PubMed.
  20. M. F. Jarrold, Annu. Rev. Phys. Chem., 2000, 51, 179–207 CrossRef CAS PubMed.
  21. H. Shizuka, M. Serizawa, T. Shimo, I. Saito and T. Matsuura, J. Am. Chem. Soc., 1988, 110, 1930–1934 CrossRef CAS.
  22. J. R. Lakowicz, Principles of Fluorescence Spectroscopy, Kluwer, Academic/Plenum, New York, 2nd edn, 1999 Search PubMed.
  23. G. Gregoire, C. Jouvet, C. Dedonder and A. L. Sobolewski, J. Am. Chem. Soc., 2007, 129, 6223–6231 CrossRef CAS PubMed.
  24. C. Dedonder, G. Féraud and C. Jouvet, in Photophysics of Ionic Biochromophores, ed. S. Brøndsted Nielsen and J. A. Wyer, Springer, Berlin Heidelberg, 2013, pp. 155–180 Search PubMed.
  25. G. Féraud, M. Broquier, C. Dedonder, C. Jouvet, G. Grégoire and S. Soorkia, J. Phys. Chem. A, 2014 DOI:10.1021/jp5065837 , in press.
  26. J. M. Beechem and L. Brand, Annu. Rev. Biochem., 1985, 54, 43–71 CrossRef CAS PubMed.
  27. H. Kang, C. Dedonder-Lardeux, C. Jouvet, S. Martrenchard, G. Gregoire, C. Desfrancois, J. P. Schermann, M. Barat and J. A. Fayeton, Phys. Chem. Chem. Phys., 2004, 6, 2628–2632 RSC.
  28. H. Kang, C. Jouvet, C. Dedonder-Lardeux, S. Martrenchard, G. Gregoire, C. Desfrancois, J. P. Schermann, M. Barat and J. A. Fayeton, Phys. Chem. Chem. Phys., 2005, 7, 394–398 RSC.
  29. T. Hashimoto, Y. Takasu, Y. Yamada and T. Ebata, Chem. Phys. Lett., 2006, 421, 227–231 CrossRef CAS.
  30. Y. H. Lee, J. W. Jung, B. Kim, P. Butz, L. C. Snoek, R. T. Kroemer and J. P. Simons, J. Phys. Chem. A, 2004, 108, 69–73 CrossRef CAS.
  31. I. Alata, R. Omidyan, C. Dedonder-Lardeux, M. Broquier and C. Jouvet, Phys. Chem. Chem. Phys., 2009, 11, 11479–11486 RSC.
  32. I. Alata, R. Omidyan, M. Broquier, C. Dedonder, O. Dopfer and C. Jouvet, Phys. Chem. Chem. Phys., 2010, 12, 14456–14458 RSC.
  33. M. Schreiber, M. R. Silva-Junior, S. P. Sauer and W. Thiel, J. Chem. Phys., 2008, 128, 134110 CrossRef PubMed.
  34. I. Georgieva, N. Trendafilova, A. J. Aquino and H. Lischka, J. Phys. Chem. A, 2007, 111, 127–135 CrossRef CAS PubMed.
  35. B. Chmura, M. F. Rode, A. L. Sobolewski, L. Lapinski and M. J. Nowak, J. Phys. Chem. A, 2008, 112, 13655–13661 CrossRef CAS PubMed.
  36. B. Saed and R. Omidyan, J. Phys. Chem. A, 2013, 117, 2499–2507 CrossRef CAS PubMed.
  37. B. Saed and R. Omidyan, J. Chem. Phys., 2014, 140, 024315 CrossRef PubMed.
  38. TURBOMOLE, V6.3 2011, a development of University of Karlsruhe and Forschungszentrum Karlsruhe GmbH, 1989–2007, TURBOMOLE GmbH, since 2007, available from http://www.turbomole.com.
  39. R. Ahlrichs, M. Bär, M. Häser, H. Horn and C. Kölmel, Chem. Phys. Lett., 1989, 162, 165–169 CrossRef CAS.
  40. R. Ahlrichs, Phys. Chem. Chem. Phys., 2004, 6, 5119–5121 RSC.
  41. F. Haase and R. Ahlrichs, J. Comput. Chem., 1993, 14, 907–912 CrossRef CAS.
  42. K. Eichkorn, F. Weigend, O. Treutler and R. Ahlrichs, Theor. Chem. Acc., 1997, 97, 119–124 CrossRef CAS.
  43. C. Hättig, J. Chem. Phys., 2003, 118, 7751–7761 CrossRef.
  44. C. Hattig and K. Hald, Phys. Chem. Chem. Phys., 2002, 4, 2111–2118 RSC.
  45. C. Hättig and A. Köhn, J. Chem. Phys., 2002, 117, 6939–6951 CrossRef.
  46. C. Hättig and F. Weigend, J. Chem. Phys., 2000, 113, 5154–5161 CrossRef.
  47. A. Köhn and C. Hättig, J. Chem. Phys., 2003, 119, 5021–5036 CrossRef.
  48. T. H. Dunning, J. Chem. Phys., 1989, 90, 1007–1023 CrossRef CAS.
  49. A. Hellweg, C. Hättig, S. Höfener and W. Klopper, Theor. Chem. Acc., 2007, 117, 587–597 CrossRef CAS.
  50. R. A. Kendall, T. H. Dunning and R. J. Harrison, J. Chem. Phys., 1992, 96, 6796–6806 CrossRef CAS.
  51. A. J. A. Aquino, H. Lischka and C. Hättig, J. Phys. Chem. A, 2005, 109, 3201–3208 CrossRef CAS PubMed.
  52. A. L. Sobolewski and W. Domcke, Phys. Chem. Chem. Phys., 2006, 8, 3410–3417 RSC.
  53. A. L. Sobolewski and W. Domcke, ChemPhysChem, 2007, 8, 756–762 CrossRef CAS PubMed.
  54. A. L. Sobolewski, W. Domcke and C. Hättig, J. Phys. Chem. A, 2006, 110, 6301–6306 CrossRef CAS PubMed.
  55. J. Jankowska, M. F. Rode, J. Sadlej and A. L. Sobolewski, ChemPhysChem, 2012, 13, 4287–4294 CrossRef CAS PubMed.
  56. J. Jankowska, M. F. Rode, J. Sadlej and A. L. Sobolewski, ChemPhysChem, 2014, 15, 1643–1652 CrossRef CAS PubMed.
  57. M. F. Rode, A. L. Sobolewski, C. Dedonder, C. Jouvet and O. Dopfer, J. Phys. Chem. A, 2009, 113, 5865–5873 CrossRef CAS PubMed.
  58. A. L. Sobolewski and W. G. Domcke, J. Phys. Chem. A, 2007, 111, 11725–11735 CrossRef CAS PubMed.
  59. A. L. Sobolewski, D. Shemesh and W. Domcke, J. Phys. Chem. A, 2008, 113, 542–550 CrossRef PubMed.
  60. Z. Huang, W. Yu and Z. Lin, J. Mol. Struct.: THEOCHEM, 2006, 758, 195–202 CrossRef CAS.
  61. G. Féraud, M. Broquier, C. Dedonder-Lardeux, G. Gregoire, S. Soorkia and C. Jouvet, Phys. Chem. Chem. Phys., 2014, 16, 5250–5259 RSC.
  62. A. Svendsen, U. J. Lorenz, O. V. Boyarkin and T. R. Rizzo, Rev. Sci. Instrum., 2010, 81, 073107 CrossRef PubMed.
  63. A. Rzeska, K. Stachowiak, J. Malicka, L. Lankiewicz and W. Wiczk, J. Photochem. Photobiol., A, 2000, 133, 33–38 CrossRef CAS.

Footnote

Electronic supplementary information (ESI) available. See DOI: 10.1039/c5ra00630a

This journal is © The Royal Society of Chemistry 2015
Click here to see how this site uses Cookies. View our privacy policy here.