Complexation of triblock reverse copolymer 10R5 with surface active ionic liquids in aqueous medium: a physico-chemical study

Renu Sharma, Tejwant Singh Kang* and Rakesh Kumar Mahajan*
Department of Chemistry, UGC-Centre for Advanced Studies-I, Guru Nanak Dev University, Amritsar-143005, India. E-mail: rakesh_chem@yahoo.com; tejwantsinghkang@gmail.com; Fax: +91 183 2258820

Received 10th January 2015 , Accepted 29th January 2015

First published on 29th January 2015


Abstract

A comprehensive study on the interactions of surface active ionic liquids (SAILs) 1-alkyl-3-methyl imidazolium chlorides, [Cnmim][Cl], where n = 8, 10, and 12, with a triblock reverse copolymer, 10R5, [(PPO)8–(PEO)22–(PPO)8] has been performed using various physico-chemical techniques viz. surface tension, conductivity, isothermal titration calorimetry (ITC), turbidity, fluorescence spectroscopy, and dynamic light scattering (DLS). The interactions between triblock reverse copolymer with SAILs have been emphasized in terms of three concentration regions due to different modes of interactions between them whereas the previous studies reported that interactions between cationic surfactants and triblock copolymers are moderately weak. Different transitions corresponding to different stages of interactions of 10R5 with SAILs are observed from different techniques. Various thermodynamic parameters are calculated using conductivity and ITC measurements, whereas fluorescence studies have provided useful information about the polarity of the cybotactic region of the probe in the complexes formed by 10R5 and SAILs. The size of polymer–SAIL complexes has been investigated using dynamic light scattering and ITC measurements. The results obtained from different techniques have been correlated with each other to get a concise picture regarding the type of interactions prevailing between polymer and SAILs.

1. Introduction

Water soluble triblock copolymers of poly(ethylene oxide) (PEO) and poly(propylene oxide) (PPO) in the form of PEO–PPO–PEO (normal pluronics) and PPO–PEO–PPO (reverse pluronics) are a series of high molecular weight nonionic surfactants comprised of hydrophilic PEO blocks and hydrophobic PPO blocks. Triblock copolymers have attracted much attention in the past few years due to their wide spread applications in diverse fields.1–4 The flexible molecular framework of pluronics makes them special in undergoing self-aggregation in aqueous solution above their critical micelle concentration (cmc) at and above their critical micelle temperature (cmt).5,6 The reverse pluronics exhibit different characteristics in aqueous solution as compared to normal pluronics. The other area of immediate interest is the utilization of these pluronics in conjunction with surfactants to achieve better colloidal properties. In this regard, the micellization of triblock copolymers in the presence of surfactants,7,8 organic additives9 and inorganic salts10 have been reported. Our own research group has performed numerous investigations related to the interactions of triblock copolymers and ionic surfactants.11–13 In this regard, O. Ortona et al.,14 have investigated the interactions of normal PE6200 and reverse 25R4 pluronics with anionic sodium decylsulfate, C10OS, cationic decyltrimethyl ammonium bromide, C10TAB and nonionic pentaethylene glycol monodecyl ether, C10E5 surfactants using various techniques. Both pluronics have been found to interact strongly with anionic surfactants, feebly with cationic and unresponsive in the presence of nonionic surfactants. J. Mata et al.,15 have investigated the aggregation behavior of triblock copolymer P105 with sodium dodecyl sulphate (SDS) and dodecyltrimethylammonium bromide (DTAB) in aqueous and salt solutions. They concluded that addition of ionic surfactants in low concentration to micellar solution of P105 cause demicellization. A few reports are also available for the interactions between reverse pluronics and ionic surfactants.14,16–18 Recently, S. P. Moulik et al.,17 have reported the solution behavior of normal L44 (L) and reverse 10R5 (R) pluronics, individually and in binary mixture exploiting various techniques. In another report, anionic surfactant sodium N-dodecanoylsarcosinate (SDDS) has been found to bind more strongly to R than L due to difference in the arrangement of PPO/PEO segments of pluronics used.18

On the other hand, in the past few years, ionic liquids (ILs) have attracted a great interest owing to their unique physico-chemical properties19–22 and find numerous applications in different areas.23–30 One of the important classes of ILs is surface active ionic liquids (SAILs), which are structurally similar to conventional ionic surfactants. Till date, a variety of SAILs have been reported for their aggregation behavior in aqueous medium.31–34 The nature of cationic/anionic head group, counter-ion and the length of alkyl chain has been found to affect their aggregation behavior.35–38 In some cases, SAILs have been found to exhibit better surface active properties as compared to conventional ionic surfactants.39,40 Amphiphilic nature of these SAILs can be varied by plethora of possible ion-pair combinations that offer an unparalleled ability to tune both physical and chemical properties for specific applications. Utilizing the surface active properties of SAILs, many research groups have investigated the interactions of SAILs with a variety of biopolymers like gelatin, agarose, chitosan and bovine serum albumin etc. to get better colloidal properties.41–45 However, with few exceptions, the detailed investigations on interactions of SAILs with block copolymers in aqueous medium are much lacking.46–48 Further, the novelty of the work lies in the fact that there exists no report shedding light on interactions between SAILs and reverse pluronics, in literature.

In the present work, we have focused on the interactions between reverse pluronic 10R5 and SAILs: 1-alkyl-3-methyl imidazolium chlorides, [Cnmim][Cl], where n = 8, 10, and 12. The interactional behavior of SAILs with block copolymer have been investigated by surface tension, conductivity, isothermal titration calorimetry (ITC), turbidity, fluorescence, and dynamic light scattering (DLS) techniques. Various surface parameters like critical micelle concentration (cmc) surface tension at cmc (γcmc), Gibbs surface excess (Γmax), minimum area per molecule (Amin) have been calculated using surface tension data. Thermodynamic parameters of micellization i.e. Gibbs free energy (ΔGmic), enthalpy (ΔHmic) and entropy (ΔSmic) of micelle formation have been calculated using conductivity and ITC measurements. Fluorescence measurements have provided information about cmc, polarity and the aggregation number of the aggregates of SAILs in the absence and presence of polymer 10R5. The variation in size of the aggregates formed by SAILs and polymer have been observed using DLS technique.

2. Experimental section

2.1 Materials

The surface active ionic liquids (SAILs), 1-alkyl-3-methylimidazolium chloride [Cnmim][Cl] where n = 8, 10, and 12 were prepared by the procedure mentioned elsewhere in the literature40 and then characterized by 1H NMR technique. 1-Methyl imidazole, 1-chlorooctane, 1-chlorodecane, 1-chlorododecane, reverse pluronic 10R5 and fluorescence probe pyrene with 98% purity were purchased from Sigma Aldrich. The molecular structures of SAILs and polymer are shown in Scheme 1(a) and (b). Cetylpyridinum chloride (CPC) with 98% purity was purchased from Lancaster Synthesis, UK. All the materials were used as received. All the solutions were prepared in double distilled deionized water. A sartorius analytical balance with a precision of ±0.0001 g was used for weighing purpose.
image file: c5ra00515a-s1.tif
Scheme 1 Molecular structures of (a) 1-alkyl-3-methyl imidazolium chloride (SAIL) (b) reverse pluronic 10R5.

2.2 Methods

For all the measurements, titration method was used keeping the concentration of polymer, 10R5 constant at 0.5 mmol dm−3. Surface tension measurements were carried out using Kruss (Hamburg, Germany) Easy dyne tensiometer using ring detachment method at 298.15 K with an accuracy of ±0.15 mN m−1. Tensiometer was calibrated with double distilled water before measurements. The aqueous solution of SAILs were added into the aqueous polymer solution and stirred for two minutes to ensure proper mixing. The surface tension was measured after an equilibration time of 5 minutes. Conductivity was measured using a digital Systronics conductivity meter model 306 with a dip-type conductivity cell having a cell constant of 1.01 cm−1. Temperature of the measurement cell was controlled using an Escy IC201 thermostatic bath within the accuracy of ±0.1 K. Steady-state fluorescence measurements were performed using HITACHI F-1600 Fluorescence Spectrophotometer using a 10 mm path length quartz cuvette at 298.15 K employing pyrene as a fluorescent probe. Pyrene was excited at an excitation wavelength of 334 nm and emission spectrum was recorded in the wavelength range of 350–470 nm using an excitation and emission slit width of 2.5, each. To determine the aggregation numbers (Nagg) of micelles in the absence and presence of polymer, cetyl pyridinium chloride (CPC) was used as a quencher. Turbidity measurements were performed using Systronics Digital Nepheloturbidity Meter model 132 after equilibration for 5 minutes. Dynamic light scattering measurements were performed using a Malvern Zetasizer Nano-ZS instrument employing a He–Ne laser (λ = 632 nm) at 298.15 K at a scattering angle of 173°. The temperature of the measurement was maintained by built-in temperature controller having an accuracy of ±0.1 K. The solutions were filtered through membrane filters (0.45 μm) to remove dust particles. Calorimetric measurements were carried out using MicroCal ITC200 microcalorimeter. The titrations were done by adding 2 μL aliquots of stock solutions of SAILs in 240 μL of aqueous polymer solution using Hamilton syringe. All the measurements were carried out at 298.15 K and repeated twice. ITC measurements could only be performed for 10R5–[C10mim][Cl] and 10R5–[C12mim][Cl] mixed systems with high accuracy.

3. Results and discussion

3.1 Tensiometric measurements

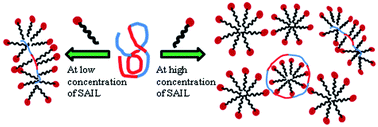
The interactional behavior of SAILs under investigation with block co-polymer, 10R5, at air–solution interface has been investigated using tensiometry. The variation of surface tension (γ) as a function of concentration of SAILs in the absence and presence of 0.5 mmol dm−3 10R5 in aqueous solution for [C8mim][Cl], [C10mim][Cl], and [C12mim][Cl] is shown in Fig. 1(a)–(c), respectively. The presence of polymer shows a marked decrease in γ of water from 72.8 to 48.4 mN m−1 which indicates highly surface active nature of polymer. The tensiometric profiles of different SAILs have shown one minima before reaching a plateau indicating the onset of critical micelle concentration (cmc). The critical micelle concentrations of SAILs agree well their literature values49,50 and are given in Table 1. Various parameters of micellization of SAILs have been obtained from surface tension measurements and are provided in Table 1. Contrary to simple tensiometric profiles of SAILs, the outline of tensiometric profiles of SAILs in the presence of polymer, 10R5 show complicated behavior indicating the presence of interactions between SAILs and polymer. In all the investigated systems, three transitions in different concentration regimes, namely C1, C2 and C3, designated as critical aggregation concentration (cac), critical saturation concentration of polymer (Cs) and critical micelle concentration (cmc), respectively, have been observed. The concentrations corresponding to these transitions are provided in Table 1. In dilute concentration regime, γ remains almost stable followed by a decrease at a concentration marked as C1 (cac). The cac indicates the onset of interactions between respective SAILs and polymer, 10R5 where the formation polymer–SAIL (monomer complex) at air–solution interface is expected. Beyond C1, γ decreases with a greater slope as a consequence of progressive formation of polymer–SAIL (aggregate) complex with increase in concentration of SAILs. The formation of polymer induced small micelles and their cooperative binding with the polymer sites at air–solution interface reduces γ up to a concentration marked as Cs. At Cs, all the binding sites available on polymer are saturated due to adsorption of SAIL on polymer backbone. With further addition of respective SAIL, γ decreases with a lower slope. This can be assigned to solubilization of some of the polymer–SAIL (aggregate) complex into bulk where at the same time, monomers of SAILs start populating the air–solution interface, thus reducing γ to C3 (cmc). At and above cmc, free micelles of SAILs are formed. At lower polymer concentration (0.5 mmol dm−3) which is much below its cmc, the polymer molecules are present in monomeric form. It has been observed that at first, the PPO segments undergo dehydration from the water phase which is further followed by dehydration of PEO segments.16 Therefore it is inferred that at first, the cationic component of SAIL bind to PEO segments and then to PPO segments through hydrophobic interactions. The phenomenon is described in Scheme 2. Our results showing three transitions are in contrast with those reported by Moulik et al.,18 in which mixed micelle formation of reverse pluronic 10R5 and anionic surfactant sodium N-dodecanoylsarcosinate (SDDS) showed only two transitions i.e. Cs and cmc. The discrepancy is assigned to the difference in nature of surfactant head group where a positively charged head group of SAILs under investigation is assumed to interact with the 10R5 via hydrophobic as well as electrostatic and ion–dipole forces of interactions between lone pair of oxygen atom and the charged head group. Such interactions between ionic liquids (ILs) and water49 have been reported. However, interactions of cationic gemini surfactants with triblock copolymers are somewhat more intricated than traditional ionic surfactants.8,51 Zheng et al.,52 has reported that the surfactant head groups do not affect the intensity of interactions between surfactants and copolymers whereas increase in hydrophobicity of surfactant leads to increase in the interactions among them. On comparing the tensiometric profiles of all the three mixed systems, it is clear that the cac depends on hydrophobicity of the chain length. This indicates that near to cac, SAIL monomers interact with 10R5 via hydrophobic interactions leading to formation of normal micellar structures on polymer backbone. The ratio of cmc to cac has been used to get insights into the affect of alkyl chain length of SAILs on their interactional behavior with polymer at air–solution interface. It has been observed that with increase in alkyl chain length, the ratio cmc/cac decrease which indicates that onset of formation of polymer induced micelles is delayed with increase in alkyl chain length. The main driving forces responsible for the interactions between 10R5 and SAILs in various concentration regimes seems to be hydrophobic and ion–dipole interactions in which hydrophobic interactions dominate in first concentration regime where aggregation of SAIL monomers start on the polymer backbone and later on, in higher concentration regions, ion–dipole forces also come into play.
image file: c5ra00515a-f1.tif
Fig. 1 Variation of surface tension (γ) as a function of logarithm of concentration of SAIL (a) [C8mim][Cl]; (b) [C10mim][Cl]; and (c) [C12mim][Cl].
Table 1 Interaction characteristic concentrations (mmol dm−3) observed from surface tension (S.T.), fluorescence (Flu.), turbidity (Turb.) and conductance (Cond.) measurements in the absence and presence of polymer 10R5 at 298.15 K
  S.T. Flu. Turb. Cond.
a Refer to ref. 49.b Refer to ref. 50.
Pure [C8mim][Cl]
cmc 168.4 (234)a 152.5 172.0 158.4 (220)a
10R5–[C8mim][Cl]
C1 (cac) 7.4 17.6
C2 (Cs) 50.4 74.2 68.4
C3 (cmc) 190.5 172.2 180.0 158.6
Pure [C10mim][Cl]
cmc 35.3 (53.8)a 32.6 30.1 39.8 (56.4)b
10R5–[C10mim][Cl]
C1 (cac) 2.1 3.5
C2 (Cs) 8.1 8.4 16.7
C3 (cmc) 36.6 35.8 37.7 40.4
Pure [C12mim][Cl]
cmc 12.3 14.1 16.4 14.9 (14.1)b
10R5–[C12mim][Cl]
C1 (cac) 2.0 2.4
C2 (Cs) 4.8 5.2 10.0
C3 (cmc) 16.4 13.8 17.0 16.4


image file: c5ra00515a-s2.tif
Scheme 2 Schematic presentation of binding interactions between polymer 10R5 and surface active ionic liquids (SAILs).

Various thermodynamic parameters like surface tension at cmc (γcmc), maximum surface excess concentration at the air–solution interface (Γmax), minimum area per molecule (Amin), effectiveness of surface tension reduction (πcmc), Gibbs free energy of adsorption (ΔG°ads) (using ΔGmic from conductivity) have been calculated using the standard equations (Annexure S1, ESI) and are given in Table 2. The values of Γmax are minimum for [C8mim][Cl] as compared to other SAILs, in both aqueous and in polymer solution suggesting the relatively loose packing of [C8mim][Cl] at air–solution interface. The Γmax values decrease in the presence of polymer in all the systems which commends that in the presence of the polymer, it is difficult for the SAILs to populate the air–solution interface effectively leading to formation of polymer–SAIL complexes. The Amin values decrease with the increase in alkyl chain length of SAILs in accordance with the literature reports53 suggesting the increasing extent of packing of SAILs at air–solution interface with increase in alkyl chain length. Further, the values of Amin are more in the presence of polymer solution as compared to that in water which is in line with the variation of Γmax. The ΔG°ads values are more negative in water as compared to that in polymer solution indicating that the adsorption a air–solution interface is confined to some extent in the presence of polymer solution and is less feasible which is assigned to the surface active nature of polymer itself. Further the magnitude of ΔG°ads don't vary much with variation in alkyl chain length of SAIL in the presence of polymer confirming the higher affinity of the polymer at air–solution interface as compared to that for SAILs.

Table 2 Interfacial parameters i.e. surface tension at cmc (γcmc), effective surface tension reduction (πcmc), surface excess (Γmax), minimum area per molecule (Amin), Gibbs free energy of adsorption (ΔG°ads) and aggregation number (Nagg) of SAILs in the absence and presence of polymer 10R5 at 298.15 K
  γcmc (mN m−1) πcmc (mN m−1) Γmax × 106 (mol dm−3) Amin2) ΔG°ads kJ mol−1 Nagg
SAILs in water
[C8mim][Cl] 32.4 38.8 1.6 103.0 −42.9 40
[C10mim[Cl] 26.4 44.9 2.1 80.0 −45.6 45
[C12mim][Cl] 31.2 40.0 2.3 71.4 −48.8 56
SAILs in 0.5 mmol dm−3 10R5
[C8mim][Cl] 31.7 16.7 0.7 233.6 −42.1 25
[C10mim][Cl] 27.6 20.8 1.1 144.9 −42.7 35
[C12mim][Cl] 32.1 16.3 1.3 131.8 −42.6 38


3.2 Conductivity measurements

The variation of conductivity as function of concentration of [C12mim][Cl] in aqueous and aqueous solutions of polymer 10R5 in a temperature range 298.15 to 318.15 K is shown in Fig. 2(a) and (b) respectively, whereas respective plots for other SAILs are provided as ESI (Fig. S1a–d). The intersection of two linear fragments of different slopes in conductivity profiles indicates the cmc, after which, rate of increase in conductance become smaller because micelles have lower mobility than free ions and fraction of the counter ions are paired with the micelles. The ratio of slopes of post to pre-micellar region gives the degree of dissociation (α) which is further related to degree of counter ion binding (β) by the equation β = 1 − α.34 The values of cmc and β of SAILs in aqueous and aqueous polymer solutions are given in Tables 4 and 5. The cmc values of SAILs have been found to be in good agreement with those obtained from surface tension measurements and with literature at 298.15 K.49,50 The cmc values of SAILs increases in presence of polymer as SAILs saturate the polymer surface before undergoing micellization, leading to delay in micellization process. An increase in temperature has also been found to retard the micellization. This can be ascribed to the aspect that the increase in temperature increases the solubility of hydrophobic chains which disrupt the iceberg structure surrounding the hydrophobic chain and thus, it delays the micelle formation.54 However, it is well established that with increase in temperature, the PPO and PEO blocks undergo dehydration, which is also expected to have a role in delaying of cmc. It is clear from the values given in the Table 5 that β increases with the increase in alkyl chain length of SAIL and is maximum for [C12mim][Cl] in both aqueous and aqueous polymer solution. This indicates that with the increase in chain length, more compact micelles are formed and counter ions are firmly bound to the stern layer. On comparing the β values of SAILs in aqueous and in aqueous polymer solution, it has been observed that β values are relatively small in the presence of polymer. This can be explained on the assumption that just before micellization or upon micellization, the polymer segments undergo rehydration and bound to the outer region of micelles via hydrophobic and electrostatic interactions, leading to stabilization of micelles resulting in decrease in β to some extent as that of aqueous solution.
image file: c5ra00515a-f2.tif
Fig. 2 Variation of specific conductivity (κ) as a function of concentration of [C12mim][Cl] in the (a) absence; and (b) presence of polymer 10R5 at different temperatures.
Table 3 Critical micelle concentration, Gibbs free energy (ΔGmic), enthalpy (ΔHmic) and entropy (ΔSmic) of micellization of SAILs in the presence of polymer 10R5 as obtained from isothermal titration calorimetry studies at 298.15 K
In 0.5 mmol dm−3 10R5 cac/Cs/cmc mmol dm−3 ΔGcacGCsGcmc kJ mol−1 ΔHcacHCsHcmc kJ mol−1 ΔScacSCsScmc J K−1 mol−1
[C10mim][Cl] —/25.4/36.6 —/−25.5/−24.3 —/−3.7/−0.8 —/73.3/84.1
[C12mim][Cl] 2.5/7.5/13.3 −36.7/−32.7/−30.6 0.8/4.6/−5.3 125.8/124.9/84.7


Table 4 Critical micelle concentration (cmc), degree of counter ion binding (β), Gibbs free energy of micellization (ΔGmic), enthalpy of micellization (ΔHmic) and entropy of micellization (ΔSmic) of SAILs in aqueous medium at different temperatures
In water T (K) cmc (mmol dm−3) β ΔGmic (kJ mol−1) ΔHmic (kJ mol−1) ΔSmic (J K−1 mol−1)
[C8mim][Cl]
  298.15 156.4 0.28 −18.6 −30.3 39.2
  303.15 161.1 0.24 −18.3 −31.3 43.0
  308.15 163.3 0.20 −17.9 −32.3 46.9
  313.15 165.7 0.18 −17.8 −33.4 49.6
  318.15 168.5 0.15 −17.6 −34.4 52.9
[C10mim][Cl]
  298.15 39.8 0.35 −24.2 −38.8 48.9
  303.15 40.1 0.35 −24.1 −40.1 53.1
  308.15 42.1 0.28 −23.6 −41.5 58.1
  313.15 43.8 0.25 −23.3 −42.8 62.5
  318.15 44.5 0.20 −23.2 −44.2 66.1
[C12mim][Cl]
  298.15 14.9 0.54 −31.4 −51.1 66.0
  303.15 15.1 0.50 −31.0 −52.8 71.8
  308.15 15.4 0.47 −30.8 −54.6 77.0
  313.15 15.7 0.43 −30.4 −56.3 82.9
  318.15 16.0 0.38 −29.8 −58.2 89.3


Table 5 Critical micelle concentration (cmc), degree of counter ion binding (β), Gibbs free energy of micellization (ΔGmic), enthalpy of micellization (ΔHmic) and entropy of micellization (ΔSmic) of SAILs in polymer solution at different temperatures
In 0.5 mmol dm−3 10R5 T (K) cmc (mmol dm−3) β ΔGmic (kJ mol−1) ΔHmic (kJ mol−1) ΔSmic (JK−1 mol−1)
[C8mim][Cl]
  298.15 158.6 0.25 −18.2 −33.0 −49.9
  303.15 163.3 0.22 −17.9 −34.1 −53.5
  308.15 165.2 0.18 −17.6 −35.3 −57.4
  313.15 168.0 0.15 −17.4 −36.4 −60.7
  318.15 171.4 0.11 −16.9 −37.6 −64.8
[C10mim][Cl]
  298.15 40.4 0.34 −23.8 −36.2 41.5
  303.15 41.7 0.31 −23.6 −37.4 45.6
  308.15 43.6 0.28 −23.3 −38.6 49.9
  313.15 45.1 0.26 −23.0 −39.9 54.1
  318.15 46.3 0.23 −22.5 −41.2 58.8
[C12mim][Cl]
  298.15 15.1 0.48 −30.1 −45.5 51.7
  303.15 15.4 0.43 −29.5 −47.1 57.9
  308.15 15.5 0.40 −29.3 −48.6 62.6
  313.15 16.1 0.37 −29.1 −50.2 67.6
  318.15 16.4 0.34 −28.8 −51.8 72.4


The Gibbs free energy of micelle formation, ΔGmic was calculated using the eqn (1):34

 
ΔGmic = (1 + β)RT[thin space (1/6-em)]ln[thin space (1/6-em)]Xcmc (1)
where, R, T and Xcmc are gas constant, temperature on Kelvin scale and cmc expressed in mole fraction. The enthalpy of micelle formation, ΔHmic was calculated by employing Gibbs–Helmholtz equation using free energy of micellization.
 
image file: c5ra00515a-t1.tif(2)

Then the entropy of micelle formation, ΔSmic is obtained as:

 
image file: c5ra00515a-t2.tif(3)

The thermodynamic parameters obtained are given in Tables 4 and 5. The negative values of ΔGmic suggest that micellization process is spontaneous. The ΔGmic values become more negative with the increase in alkyl chain length of SAIL as expected. However, ΔGmic become less negative in the presence of polymer for all investigated polymer–SAIL mixed systems as compared to that in the absence of polymer. As can be seen from Tables 4 and 5, the negative values of ΔGmic are contributed by negative values of ΔHmic over the whole temperature range, similar to that observed in case of aqueous solutions. It has been observed that hydrophobic effect and electrostatic interactions are mainly responsible for micellization in aqueous media55 and the micellization process is an enthalpy-driven phenomenon. However in case of [C12mim][Cl], the entropy factor contributes significantly towards free energy change relative to that in other systems in the presence of polymer.

3.3 Calorimetric measurements

Isothermal titration calorimetry (ITC) is a versatile technique for acquiring information regarding self-organization of surfactants into micelles which permits the determination of critical micelle concentration (cmc) and the enthalpy of micellization (ΔH) in a single experiment without the need of any probe.56–58 The enthalpograms of SAILs, [C10mim][Cl] and [C12mim][Cl] in the presence and absence of 0.5 mmol dm−3 10R5 aqueous polymer as a function of concentration of SAILs are shown in Fig. 3(a) and (b), respectively, and the corresponding profiles for differential enthalpy (dP) for SAILs in aqueous and polymer solution are shown in Fig. S3 and S4 respectively (ESI). For [C8mim][Cl], a very high concentration of SAIL is required (3 mol dm−3) and even with such high concentration, micellization process is not complete. Due to this, cmc and ΔHmic for this SAIL could not be obtained using ITC measurements. The shape of the enthalpograms obtained can be rationalized in terms of polymer induced formation of aggregates of SAIL on or near the hydrophobic sites of polymer.59 From Fig. 3(a) and (b), it is obvious that the enthalpograms obtained for aqueous solution of SAILs in the presence of 10R5 are different from that obtained in absence of polymer at least in the magnitude, which is a direct consequence of the interaction between the two components. Inset of Fig. 3(a) and (b) shows the differential thermogram, which has been obtained by subtracting the enthalpograms obtained in the absence of 0.5 mmol dm−3 of 10R5 from that obtained in the presence of 0.5 mmol dm−3 of 10R5 to get a concise view of the events. As can be seen from inset of Fig. 3(a) and (b), for the system having [C10mim][Cl], two transitions namely, C2 and C3 have been observed, whereas in case of system having [C12mim][Cl], three transitions namely C1, C2 and C3 have been observed. The obtained values of different transitions are tabulated in Table 3. The heat changes involved are mainly due to dissociation of micelles into monomers before cmc, dilution effects, dehydration or rehydration of polymer segments and binding interactions between surfactant in monomeric form and in micellar form (after cmc) with polymer. For 10R5–[C10mim][Cl] systems, the titration curve has been found to be sigmoidal in shape. In the first few injections of [C10mim][Cl] (C ≤ 13.0 mmol dm−3), endothermic heat changes occur which is due to demicellization of concentrated solution of [C10mim][Cl] and is likely to be affected by dehydration of PPO/PEO segments where the monomers of [C10mim][Cl] bind to the polymer through hydrophobic interactions leading to formation of polymer–SAIL (monomer) complexes in this concentration regime. With the increase in concentration of respective SAIL (13.0 mmol dm−3 < C > cmc), the magnitude of endothermic change increase to reach a maximum and gives the critical saturation concentration (Cs) where polymer–SAIL (aggregate) complex are formed. The Cs value obtained from calorimetry is higher than those obtained from techniques discussed earlier. This might be due to fact that different techniques sense different stages of interactions. After Cs, the concentration of unbound monomers exceeds the cmc, and here occurs the onset of micellization where the added micelles no longer dissociate into monomers that lead to decrease in enthalpy. As also indicated by other techniques, it is anticipated that the PEO segments undergo rehydration in this concentration regime and bind to the surface of micelles via ion–dipole interactions and resulting in exothermic heat changes.
image file: c5ra00515a-f3.tif
Fig. 3 Calorimetric profiles of SAILs as a function of concentration (a) [C10mim][Cl]; and (b) [C12mim][Cl] in the absence and presence of polymer 10R5 (inset shows the differential thermogram obtained in the presence and absence of polymer 10R5).

For 10R5–[C12mim][Cl] system, at low concentration of [C12mim][Cl] (C ≤ 3.0 mmol dm−3), the added micelles dissociate into monomers which bind to polymer that results in formation of polymer–SAIL (monomer) complex and thus, endothermic heat changes take place. In higher concentration regime i.e. 3.0 mmol dm−3 < C > cmc, polymer gets saturated with the SAIL monomers and gives the critical saturation concentration (Cs). With further addition of [C12mim][Cl], free micelles of SAIL start forming at and above cmc. The values of various transitions for 10R5–[C12mim][Cl] are in well agreement with those obtained from other techniques. The thermodynamic parameter i.e. Gibbs free energy, (ΔGmic) of interaction between 10R5 and SAILs has been calculated using the cmc obtained from ITC and degree of counter-ion binding (β) obtained from conductivity measurements.18 The corresponding value of entropy change (ΔS) is calculated using the Gibbs–Helmholtz equation.

The calculated values of different thermodynamic parameters (ΔH, ΔG, ΔS) corresponding to different transitions observed from ITC are shown in Table 3. A keen analysis of Table 3 reveals that enthalpy changes are exothermic as well as endothermic for various transitions in polymer–SAIL mixed systems. The enthalpy changes (ΔH) corresponding to cac and Cs are endothermic and whereas they are exothermic for cmc and listed in Table 3. At sufficiently high concentration of both the SAILs, the dilution curves are near to merge with those obtained in water. The obtained ΔGmic at cmc is in good agreement with that obtained from conductivity measurements at 298.15 K. However, there are differences in values of other thermodynamic parameters. The differences arise due to various physicochemical processes other than aggregation responsible for heat changes. Calorimetry involves integral heat of process whereas conductivity gives differential heat of micellization. Also, counterion binding of aggregates and dynamic nature of aggregation strongly influence ΔHmic values in calorimetry but these factors do not have pronounced effect in conductivity measurements.60

3.4 Turbidity measurements

The plots for variation in turbidity in 10R5–[C8mim][Cl], –[C10mim][Cl], and –[C12mim][Cl] systems are shown in Fig. 4(a)–(c), respectively. For all the investigated systems, turbidity initially increases slightly with the increase in concentration of SAILs up to C1 (observed in surface tension). Above C1, turbidity increases sharply up to a concentration Cs which is due to formation of polymer–SAIL (aggregate) complex at Cs. The increase in size of the forming polymer–SAIL (aggregate) complex with an increase in concentration of SAIL leading to increase in turbidity also cannot be ruled out. Above Cs, turbidity increases with a slightly lower slope and reaches a maximum at C3 (cmc). This increase in turbidity is due to phase separation behavior by virtue of hydrophobic interactions between PPO segments of polymer and alkyl chain of SAIL in polymer–SAIL (aggregate) complex. The behavior of turbidity changes is different from that reported by Singh et al.41 between gelatin–[C8mimCl] mixed systems in which only two transitions have been observed as the nature of polymer used and charge on the polymer affects their interaction with surfactants. Above cmc, the turbidity decreases initially followed by a constant value in case of 10R5–[C10mim][Cl] and 10R5–[C12mim][Cl]. The decrease in turbidity after cmc indicates the partial solubilization of polymer–SAIL (aggregate) complex by the formed micelle which remains stable in the presence of micelles. However in 10R5–[C8mim][Cl], no such phenomenon of solubilization of polymer–SAIL (aggregate) complex has been observed as indicated by constant turbidity after cmc.
image file: c5ra00515a-f4.tif
Fig. 4 Variation of turbidity versus concentration of SAILs in polymer solution (a) [C8mim][Cl]; (b) [C10mim][Cl]; and (c) [C12mim][Cl].

3.5 Fluorescence measurements

Fluorescence of pyrene is highly sensitive to polarity of the medium and the ratio of first and third vibronic peak (I1/I3) is used as a measure of polarity.61 The ratio of I1/I3 decreases with the decrease in polarity of the medium. Fig. 5(a)–(c) represents the variation of I1/I3 as a function of concentration of [C8mim][Cl], [C10mim][Cl], and [C12mim][Cl], respectively, in water and in aqueous polymer solutions. For all the investigated systems, I1/I3 shows a constancy initially up to a concentration corresponding to Cs followed by a sharp decrease until it reaches a plateau at cmc. No transition corresponding to C1 (cac) has been observed from fluorescence measurements indicating the non-formation of any hydrophobic domains in polymer–SAIL (monomer) complex at the sensing level of pyrene. At Cs, the polymer backbone is saturated with the monomers of SAILs, and a decrease in I1/I3 beyond Cs is due to the formation of polymer–SAIL (aggregate) complex which exhibit decreased hydrophilic character. The cmc values obtained from fluorescence are smaller than those obtained from surface tension and are in lines with conductometry as different techniques senses different techniques of micellization. The I1/I3 values at cmc for the 10R5–[C8mim][Cl], [C10mim][Cl], [C12mim][Cl] systems are 1.54, 1.41, 1.31 indicating an increase in hydrophobic character of micelle with increase in alkyl chain length of SAIL. Very interestingly, the I1/I3 values in the presence of polymer have found to be higher as compared to that observed in the absence of polymer. This indicates that the pyrene occupies relatively less hydrophobic region in the presence of polymer most probably in the polymer–SAIL (aggregate) complex along with the free micelles and an average of the environment of pyrene has been detected. Further, the presence of water in vicinity of polymer–SAIL (aggregate) complex leading to relatively higher value to I1/I3 cannot be ruled out.
image file: c5ra00515a-f5.tif
Fig. 5 Variation of I1/I3 versus concentration of SAILs (a) [C8mim][Cl]; (b) [C10mim][Cl]; and (c) [C12mimCl].

The aggregation number (Nagg) is a characteristic feature of surfactants which gives the average number of surfactants forming the micelle. The Nagg of investigated SAILs in aqueous and in aqueous polymer solution has been determined by steady-state fluorescence quenching technique using the method described by Turro–Yekta62 employing pyrene and CPC as fluorescent probe and quencher, respectively, using the relation:

 
image file: c5ra00515a-t3.tif(4)
where, I0 and I are the fluorescence intensities in the absence and presence of quencher, respectively, [Q] is concentration of quencher, ST gives the total concentration of surfactant. Fig. S2a and b (ESI) shows the variation of ln(I0/I) versus [Q], the slope of which have been used to calculate the Nagg for SAILs in absence and presence of polymer. The Nagg of SAILs in the absence and presence of polymer are given in Table 2. The Nagg of the SAILs [C8mim][Cl], [C10mim][Cl], [C12mim][Cl] in aqueous solution are 40, 45, 56 and found to be in good agreement with their literature values.63,64 The Nagg of SAILs decreases in the presence of polymer which is a normal behavior observed for surfactants–polymer systems65 as the presence of polymer restricts the formation of large aggregates which is liable for the decrease in Nagg in polymer solution.

3.6 Morphology of polymer–SAIL aggregates

Dynamic light scattering studies have been carried out to investigate the changes in hydrodynamic diameter, Dh of the complexes formed between polymer and SAIL in different concentration regime of respective SAILs. The variation of Dh for aqueous polymer systems (0.5 mmol dm−3) as a function of concentration for [C8mim][Cl], [C10mim][Cl], and [C12mim][Cl] are presented in Fig. 6(a)–(c), respectively. The values of Dh along with poly dispersity index (PDI) as a function of concentration of respective SAIL in mixed systems is provided in Table S1 ESI. The schematic representation showing the binding interaction mechanism between 10R5 and SAILs adopted based on the observations made from various techniques is shown as Scheme 2. The Dh of native 0.5 mmol dm−3 10R5 is ≈3.1 nm indicating the presence of polymer as random coil in water at this concentration. In the case of 10R5–[C12mim][Cl], upon the addition of [C12mim][Cl], Dh size increases initially up to a concentration of 7.0 mmol dm−3 to Dh of 90 nm, which further shows a rapid decrease to a size of 12 nm at a concentration of 9.1 mmol dm−3. The initial increase in Dh is due to interaction between polymer and monomers of [C12mim][Cl] which result in formation of expanded polymer–SAIL (monomer) complex as shown Scheme 2 (step-I to III). Such large increase in size of aggregates from 3 to 90 nm can be due to counter-ion mediated electrostatic interactions between charged species.66 Therefore, It is assumed that a few polymer–SAIL (monomer) complexes comes together intermediated by counter-ions to form large sized aggregates as shown in Scheme 2. This concentration range falls between Cs and cmc values obtained from surface tension plots. On further addition of [C12mim][Cl], size increases only slightly and remains constant afterwards. The concentration corresponding to endothermic maximum appearing in ITC thermogram (Fig. 5(b)) also matches well with the concentration of maximum Dh which reveals that monomers of SAIL are absorbed on the PPO block through hydrophobic interactions and thus, they form large mixed aggregates with the polymer corroborating well with DLS data. Further, increase in concentration of SAIL induces electrostatic repulsions between similarly charged head groups and thus destabilizes the micelles resulting in the decrease in size of the polymer–SAIL complexes and the consequence is the formation of smaller mixed micelles of polymer and [C12mim][Cl]. In case of 10R5–[C10mim][Cl], on small addition of SAIL, size increases abruptly to a size of 77 nm around a concentration of 2.0 mmol dm−3 which matches with C1 as obtained from surface tension and turbidity measurements. The size further increases to a maximum size of 122 nm with further addition of SAIL up to 26 mmol dm−3, which is followed by a decrease up to a concentration of 35.6 mmol dm−3 which corresponds to cmc of SAIL, which is also evidenced from other techniques employed. The size further remains constant on the addition of SAIL in corroboration with the turbidity measurements. In case of 10R5–[C8mim][Cl], Dh remains constant upto 8.4 mmol dm−3 which suggests that short chain [C8mim][Cl] adsorbs relatively to lesser extent onto the polymeric backbone initially as compared to other SAILs possibly due to decreased hydrophobic interactions and then increases to attain a plateau around C2. The appearance of plateau in the mixed systems indicates the saturation of polymer backbone due to adhered aggregates of SAIL. This is followed by a decrease in size at 131.0 mmol dm−3. The size further increases with the increase in concentration which indicates that free micelles of SAIL are formed which are growing in size.
image file: c5ra00515a-f6.tif
Fig. 6 Variation of hydrodynamic diameter (Dh) versus concentration of SAILs in the aqueous solution of polymer, 10R5 (a) [C8mim][Cl]; (b) [C10mim][Cl]; and (c) [C12mim][Cl].

4. Conclusions

The present work is focused on the interactions between triblock reverse copolymer 10R5 and surface active ionic liquids (SAILs), [C8mim][Cl], [C10mim][Cl], and [C12mim][Cl] using multi-technique approach. The interactions between 10R5 and SAILs are illustrated in terms of different concentration regimes and these interactions are mainly driven by ion–dipole among cationic head group of SAILs with PEO blocks and hydrophobic interactions between hydrophobic chain length of SAILs and PPO blocks of 10R5. The ratio of these interactional modes in the described concentration regions is different. The various techniques employed give the same picture of interactions between 10R5 and SAILs. Tensiometry has revealed that in very dilute concentration regime of SAIL i.e. at cac, polymer–SAIL (monomer) complex is formed on the polymer backbone which later transformed to polymer–SAIL (aggregates) complex at higher concentration of SAIL. The calculated thermodynamic parameters using conductivity and isothermal titration calorimetry techniques suggest that the micellization process in the presence of polymer is an enthalpy driven in investigated temperature range where maximal entropic contribution has been observed in case of [C12mim][Cl]. Thermodynamic analysis reveals that hydrophobic interactions play an important role in mixed micellization of proposed systems. Fluorescence measurements have suggested that the hydrophobicity of the formed complexes between polymer and SAILs increases with increase in alkyl chain length of SAIL. The turbidity and dynamic light scattering measurements also indicate the presence the three concentration regions and the results obtained are in corroboration with those extracted from other techniques. In nut shell, we conclude that micellization of polymer and SAILs are governed by hydrophobic interactions as well as ion–dipole interactions and these interactions increase with the increase in alkyl chain length of SAILs. The polymer–SAILs mixed systems have tremendous potential which can be utilized in future in many fields to get more economical, environment friendly mixed systems with improved characteristics like viscosity, surface activity and solubilization.

Acknowledgements

This work was financially supported by the Department of Science and Technology (DST) New Delhi, India as a part of Project no. SR/S1/PC-02/2011. Renu Sharma is thankful to University Potential for Excellence (UPE) scheme, Guru Nanak Dev University, Amritsar for the award of research fellowship (RF).

References

  1. V. P. Torchilin, J. Controlled Release, 2001, 73, 137–172 CrossRef CAS.
  2. T. Moore, C. Scott, M. Surya and P. Nivedita, J. Controlled Release, 2000, 67, 191–202 CrossRef CAS.
  3. A. Lavasanifar, J. Samuel and G. S. Kwon, Adv. Drug Delivery Rev., 2002, 54, 169–190 CrossRef CAS.
  4. Z. Zhou and B. Chu, Macromolecules, 1994, 27, 2025–2033 CrossRef CAS.
  5. J. S. Namban and J. Philip, J. Phys. Chem. B, 2012, 116, 1499–1507 CrossRef PubMed.
  6. C. Wu, T. Liu, B. Chu, D. K. Schneider and V. Graziano, Macromolecules, 1997, 30, 4574–4583 CrossRef CAS.
  7. J. B. Vieira, R. K. Thomas, Z. X. Li and J. Penfold, Langmuir, 2005, 21, 4441–4451 CrossRef CAS.
  8. X. Li, S. D. Wettig and R. E. Verall, J. Colloid Interface Sci., 2005, 282, 466–477 CrossRef CAS PubMed.
  9. K. S. Mali, G. B. Dutt and T. Mukherjee, J. Phys. Chem. B, 2007, 111, 5878–5884 CrossRef CAS PubMed.
  10. R. Ganguly, V. K. Aswal, P. A. Hassan, I. K. Gopalakrishnan and J. V. Yakhmi, J. Phys. Chem. B, 2005, 109, 5653–5658 CrossRef CAS PubMed.
  11. R. Kaur, S. Kumar, V. K. Aswal and R. K. Mahajan, Langmuir, 2013, 29, 11821–11833 CrossRef CAS PubMed.
  12. R. Sanan and R. K. Mahajan, Colloids Surf., A, 2013, 433, 145–153 CrossRef CAS PubMed.
  13. R. Sharma, A. Shaheen and R. K. Mahajan, Colloid Polym. Sci., 2011, 289, 43–51 CAS.
  14. O. Ortona, G. D. Errico, L. Paduano and V. Vitagliano, J. Colloid Interface Sci., 2001, 301, 63–77 CrossRef PubMed.
  15. J. Mata, T. Joshi, D. Varade, G. Ghosh and P. Bahadur, Colloids Surf., A, 2004, 247, 1–7 CrossRef CAS PubMed.
  16. S. Dai, K. C. Tam and L. Li, Macromolecules, 2001, 34, 7049–7055 CrossRef CAS.
  17. B. Naskar, S. Ghosh and S. P. Moulik, J. Colloid Interface Sci., 2014, 414, 82–89 CrossRef CAS PubMed.
  18. B. Naskar, S. Ghosh and S. P. Moulik, Langmuir, 2012, 28, 7134–7146 CrossRef CAS PubMed.
  19. T. Welton, Chem. Rev., 1999, 99, 2071–2084 CrossRef CAS PubMed.
  20. J. L. Anderson, V. Pino, E. C. Hagberg, V. V. Sheares and D. W. Armstrong, Chem. Commun., 2003, 2444–2445 RSC.
  21. P. T. P. Thi, C. W. Cho and Y. S. Yun, Water Res., 2010, 44, 352–372 CrossRef PubMed.
  22. R. D. Rogers and K. R. Seddon, Science, 2003, 302, 792–793 CrossRef PubMed.
  23. P. Kubisa, Prog. Polym. Sci., 2004, 29, 3–12 CrossRef CAS PubMed.
  24. J. M. Crosthwaite, M. J. Muldoon, J. K. Dixon, J. L. Anderson and J. F. Brennecke, J. Chem. Thermodyn., 2005, 37, 559–568 CrossRef CAS PubMed.
  25. A. E. Jimenez and M. D. Bermudez, Tribol. Lett., 2007, 26, 53–60 CrossRef CAS PubMed.
  26. C. P. Mehnert, R. A. Cook, N. C. Dispenziere and M. Afeworki, J. Am. Chem. Soc., 2002, 124, 12932–12933 CrossRef CAS PubMed.
  27. A. B. Mcewen, H. L. Ngo, K. Lecompte and J. L. Goldman, J. Electrochem. Soc., 1999, 146, 1687–1695 CrossRef CAS PubMed.
  28. K. Ding, Z. Miao, Z. Liu, G. An, Y. Xie, R. Tao and B. Han, J. Mater. Chem., 2008, 18, 5406–5411 RSC.
  29. H. Kaper, S. Sallard, I. Djerdj, M. Antonietti and B. M. Smarsly, Chem. Mater., 2010, 22, 3502–3510 CrossRef CAS.
  30. Q. Ji, S. Acharya, G. J. Richards, S. Zhang, J. Vieaud, J. P. Hill and K. Ariga, Langmuir, 2013, 29, 7186–7194 CrossRef CAS PubMed.
  31. R. Sharma and R. K. Mahajan, RSC Adv., 2014, 4, 748–774 RSC.
  32. J. Luczak, J. Hupka, J. Thoming and C. Jungnickel, Colloids Surf., A, 2008, 329, 125–133 CrossRef CAS PubMed.
  33. S. Mahajan, R. Sharma and R. K. Mahajan, Langmuir, 2012, 28, 17238–17246 CrossRef CAS PubMed.
  34. R. Sanan, T. S. Kang and R. K. Mahajan, Phys. Chem. Chem. Phys., 2014, 16, 5667–5677 RSC.
  35. T. Singh and A. Kumar, J. Phys. Chem. B, 2007, 111, 7843–7851 CrossRef CAS PubMed.
  36. G. Bai, A. Lopes and M. Bastos, J. Chem. Thermodyn., 2008, 40, 1509–1516 CrossRef CAS PubMed.
  37. M. Blesic, M. H. Marques, N. V. Plechkova, K. R. Seddon, L. P. N. Rebelo and A. Lopes, Green Chem., 2007, 9, 481–490 RSC.
  38. J. Wang, H. Wang, S. Zhang, H. Zhang and Y. Zhao, J. Phys. Chem. B, 2007, 111, 6181–6188 CrossRef CAS PubMed.
  39. T. J. Trivedi, K. S. Rao, T. Singh, S. K. Mandal, N. Sutradhar, A. B. Panda and A. Kumar, Task-specific, biodegradable amino acid ionic liquid surfactants, ChemSusChem, 2011, 4, 604–608 CrossRef CAS PubMed.
  40. B. Dong, N. Li, L. Zheng, L. Yu and T. Inoue, Surface formation and micelle formation of surface active ionic liquid in aqueous solution, Langmuir, 2007, 23, 4178–4182 CrossRef CAS PubMed.
  41. T. Singh, S. Boral, H. B. Bohidar and A. Kumar, Interaction of gelatin with room temperature ionic liquids: a detailed physicochemical study, J. Phys. Chem. B, 2010, 114, 8441–8448 CrossRef CAS PubMed.
  42. P. Bharmoria and A. Kumar, RSC Adv., 2013, 3, 19600–19608 RSC.
  43. P. Bharmoria, T. Singh and A. Kumar, J. Colloid Interface Sci., 2013, 407, 361–369 CrossRef CAS PubMed.
  44. X. Wang, J. Liu, L. Sun, L. Yu, J. Jiao and R. Wang, J. Phys. Chem. B, 2012, 116, 12479–12488 CrossRef CAS PubMed.
  45. T. Singh, P. Bharmoria, M. Morikawa, N. Kimizuka and A. Kumar, J. Phys. Chem. B, 2012, 116, 11924–11935 CrossRef CAS PubMed.
  46. L. Zheng, C. Guo, J. Wang, X. Liang, S. Chen, J. Ma, B. Yang, Y. Jiang and H. Liu, J. Phys. Chem. B, 2007, 111, 1327–1333 CrossRef CAS PubMed.
  47. T. Inoue and H. Yamakawa, J. Colloid Interface Sci., 2011, 356, 798–802 CrossRef CAS PubMed.
  48. P. M. Reddy and P. Venkatesu, J. Colloid Interface Sci., 2014, 420, 166–173 CrossRef PubMed.
  49. C. Jungnickel, J. Luczak, J. Ranke, J. F. Fernandez, A. Muller and J. Thoming, Colloids Surf., A, 2008, 316, 278–284 CrossRef CAS PubMed.
  50. P. D. Galeno and O. A. El Seoud, J. Colloid Interface Sci., 2011, 361, 186–194 CrossRef PubMed.
  51. R. Wang, Y. Tang and Y. Wang, Langmuir, 2014, 30, 1957–1968 CrossRef CAS PubMed.
  52. J. Liu, M. Zhao, Q. Zhang, D. Sun, X. Wei and L. Zheng, Colloid Polym. Sci., 2011, 289, 1711–1718 CAS.
  53. B. Dong, X. Y. Zhao, L. Q. Zheng, J. Zhang, N. Li and T. Inoue, Colloids Surf., A, 2008, 317, 666–672 CrossRef CAS PubMed.
  54. Y. Wei, F. Wang, Z. Zhang, C. Ren and Y. Lin, J. Chem. Eng. Data, 2014, 59, 1120–1129 CrossRef CAS.
  55. D. Myers, Surfaces, Interfaces and Colloids: Principles and Applications, Wiley-VCH, New York, 2nd edn, 1999 Search PubMed.
  56. N. M. Vas Os, G. J. Daane and G. Haandrikman, J. Colloid Interface Sci., 1991, 141, 199–217 CrossRef.
  57. B. Anderson and G. Olofsson, J. Chem. Soc., Faraday Trans. 1, 1988, 4087–4095 RSC.
  58. G. Olofsson and G. Wang, in Polymer–Surfactant Systems, Surfactant Science Series, 77, ed. J. C. T. Kwak, Marcel Dekker, New York, 1998, pp. 318–356 Search PubMed.
  59. G. Wang and G. Olofsson, J. Phys. Chem. B, 1998, 102, 9276–9283 CrossRef CAS.
  60. A. Chatterjee, S. P. Moulik, S. K. Sanyal, B. K. Mishra and P. M. Puri, J. Phys. Chem. B, 2001, 105, 12823–12831 CrossRef CAS.
  61. K. Kalyanasundaram and J. K. Thomas, J. Am. Chem. Soc., 1977, 99, 2039–2044 CrossRef CAS.
  62. N. J. Turro and A. Yekta, J. Am. Chem. Soc., 1978, 100, 5951–5952 CrossRef CAS.
  63. N. M. Vaghele, N. V. Sastry and V. K. Aswal, Colloid Polym. Sci., 2011, 289, 309–322 Search PubMed.
  64. O. A. El Seoud, P. A. R. Pires, T. Abdel-Moghny and E. L. Bastos, J. Colloid Interface Sci., 2007, 313, 296–304 CrossRef CAS PubMed.
  65. O. Ortona, G. D'Errico, L. Paduano and R. Sartorio, Phys. Chem. Chem. Phys., 2002, 4, 2604–2611 RSC.
  66. S. Perkin, Phys. Chem. Chem. Phys., 2012, 14, 5052–5062 RSC.

Footnote

Electronic supplementary information (ESI) available. See DOI: 10.1039/c5ra00515a

This journal is © The Royal Society of Chemistry 2015
Click here to see how this site uses Cookies. View our privacy policy here.