Binding interactions of agents that alter α-synuclein aggregation

K. Sivanesama, A. Byrnea, M. Bisagliab, L. Bubaccob and N. Andersen*a
aDepartment of Chemistry, University of Washington, Seattle, WA 98195, USA. E-mail: andersen@chem.washington.edu
bDepartment of Biology, University of Padua, 35121 Padova, Italy

Received 12th August 2014 , Accepted 7th January 2015

First published on 16th January 2015


Abstract

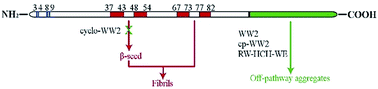
Further examination of peptides with well-folded antiparallel β strands as inhibitors of amyloid formation from α-synuclein has resulted in more potent inhibitors. Several of these had multiple Tyr residues and represent a new lead for inhibitor design by small peptides that do not divert α-synuclein to non-amyloid aggregate formation. The most potent inhibitor obtained in this study is a backbone cyclized version of a previously studied β hairpin, designated as WW2, with a cross-strand Trp/Trp cluster. The cyclization was accomplished by adding a D-Pro-L-Pro turn locus across strand termini. At a 2[thin space (1/6-em)]:[thin space (1/6-em)]1 peptide to α-synuclein ratio, cyclo-WW2 displays complete inhibition of β-structure formation. Trp-bearing antiparallel β-sheets held together by a disulphide bond are also potent inhibitors. 15N HSQC spectra of α-synuclein provided new mechanistic details. The time course of 15N HSQC spectral changes observed during β-oligomer formation has revealed which segments of the structure become part of the rigid core of an oligomer at early stages of amyloidogenesis and that the C-terminus remains fully flexible throughout the process. All of the effective peptide inhibitors display binding-associated titration shifts in 15N HSQC spectra of α-synuclein in the C-terminal Q109-E137 segment. Cyclo-WW2, the most potent inhibitor, also displays titration shifts in the G41–T54 span of α-synuclein, an additional binding site. The earliest aggregation event appears to be centered about H50 which is also a binding site for our most potent inhibitor.


The misfolding of proteins can lead to the formation of off-path intermediates that can be detrimental to living cells. Protein aggregates often result from protein misfolding and are known to be associated with more than 40 diseases.1 Many of these are characterized as amyloid diseases, e.g. Alzheimer's, Parkinson's and Huntington's diseases, deriving their class name from the ordered aggregate structures (amyloid fibrils) that form. The topologies of a variety of amyloid fibrils have been determined2,3 and these have provide some mechanistic insights. However, the currently held view is that β-sheet oligomers are the toxic species4,5 of these diseases rather than the mature fibrils. Hence, developing therapeutic strategies that can target the earliest stages of amyloidogenesis has become a prominent feature of protein folding disease research. There are four major therapeutic strategies4,6–10 for amyloid associated diseases: (1) interfering with protein processing that yields the amyloidogenic sequences, (2) native fold stabilization,11 (3) diverting pre-amyloid intermediates to non-toxic aggregates,12 and (4) reducing the steady-state concentration of toxic intermediates in an amyloidogenic pathway by altering the relative rates of reactions within that aggregation pathway13,14 Only the third and fourth strategies appear viable in the case of α-synuclein aggregation, the subject of the present study.

Alpha-synuclein (α-syn) is a 140-residue protein that is implicated in Parkinson's disease and is the primary component of Lewy bodies found in patients. In the case of α-syn, there is evidence contrary to the toxic oligomer hypothesis: that fibrillar assemblies are even more toxic.15 It is found predominantly in neural tissue, but the exact function of α-syn is not fully understood. A role in dopamine homeostasis has been suggested16 and the association of α-syn with synaptic vesicles stabilizes the vesicles and inhibits neurotransmitter release.17 Conformation-specific interaction between α-syn and a number of proteins have been detected18 and a role in the assembly of a soluble NSF attachment protein receptor has been reported.19 Interactions with mitochondrial membranes have also been detected.20,21

The primary structure of α-syn is divided into three distinct sections: (1) residues 1–60 – an amphipathic, helix-forming N-terminal region made up of 11-residue repeats with a nearly conserved KTKEGV hexamer motif (see Fig. 1), (2) residues 61–95 – the central hydrophobic region which includes the NAC region which is implicated in amyloid aggregation, and (3) residues 96–140 – a highly acidic and proline-rich section with no distinct structural propensity. The NAC region was originally observed as the non-Aβ component of amyloid plaques associated with Alzheimer's disease.22,23 The full sequence is shown in Fig. 1.


image file: c5ra00325c-f1.tif
Fig. 1 Full sequence of α-syn, with the NAC region underlined. It can be viewed as having seven 11-residue pseudo-repeats including a nearly conserved hexamer (blue highlighting) in the five N-terminal repeats, the less conserved equivalents within the NAC region are shown in yellow. Another repeating unit which include the most amyloidogenic fragments of the central section is shown by bold residue labels.

The greater density of β-branched residues in the adjacent sixth and seventh repeats is particularly important for fibril formation.24,25 In studies of constructs with reordered repeats, it was observed that when the sixth and seventh repeats are separated by the insertion of other repeats mature fibril formation did not occur and β-structure formation was inhibited. Features outside of the NAC region also have effects on amyloidogenesis, the dramatic reduction in amyloid formation associated with Tyr → Ala mutations,26 none of which are in the NAC region, serves an example. A recent NMR study27 of a non-amyloidogenic protein complex formed by α-syn has focused attention on the V37-T54 sequence segment which includes one Tyr residue.

Monomeric α-syn has a predominantly random coil structure in aqueous media, but some transient long-range contacts have been implicated26 and detected.28–30 There are partially populated helical conformations in the lipid binding N-terminal region and the helical preference in this region is enhanced31 in the native N-acetylated form32 of α-syn. Enhanced helicity can be mimicked in vitro with non-acetylated α-syn in the presence of membranes and membrane-like environments.33–37 NMR studies38 have revealed avid lipid vesicle binding for the N-terminal region, and to a somewhat lesser extent, the NAC region. In the presence of small unilamellar vesicles, there is evidence31 for an extended helix conformation (residues 2–89), but such a structure is likely in equilibrium with a variety of broken-helix states.39 Enhanced transient helicity, with the possibility of helix bundle formation, could set the stage for peptide chain association into β sheet structures,38 particularly when the helices have not extended into the NAC region. However, it has been demonstrated that the rate of fibril formation for N-Ac-α-syn is decreased by N-acetylation.40 This reflects enhanced helicity that is limited to residues 1–9. Evidence presented to date41 indicates that enhanced helicity in the residue 14–31 and 50–57 spans enhances fibrilization but that the inhibitory effect of N-terminal helicity is more dramatic. Thus non-acetylated α-syn remains a suitable model for biologically relevant aggregation studies.

As is the case for essentially all peptide systems that form amyloid fibrils,42–45 amyloid formation by α-syn is readily detected13,26,46 as a dramatic increase in fluorescence of thioflavin-T (ThT) at 482 nm when bound to amyloid structures; this attributed to a restriction of rotation about the bond connecting the two aryl rings of ThT47,48 when ThT binds to structure-defining channels49,50 within “cross-β” architecture β-sheets.42,43,45,48

Inhibitors of α-syn amyloid formation

Reported inhibitors fall into three categories: (1) small molecule polyphenols, (2) peptides representing solubilized or mutated (so as to prevent a β-structuring transitions) segments drawn from particularly amyloidogenic segments of the α-syn structure, and (3) aryl-residue-rich β-hairpins with no sequence homology to α-syn. In the first category, (−)-epi-gallocatechin-3-gallate (EGCG), a green tea component, has been examined most extensively. Resveratrol, found in red grapes and wine, may serve as another example.51 EGCG possesses ‘inhibitory potency’ against at least five amyloidogenic systems.12,52 It has been proposed that this polyphenol compound acts by diverting poorly folded species to non-amyloidogenic oligomers and eventually to non-toxic aggregates. Such a diversion would avoid formation of toxic pre-amyloid species, along the path to amyloid fibrils. Some further studies of EGCG are reported herein.

Turning to the second class, the majority of the protein and peptide amyloidogenesis inhibitors are solubilised53,54 and/or mutated versions of the most amyloidogenic sequence fragments of the protein or peptide of interest. A popular approach to creating an agent which could interfere with the fibril growth process is to synthesise short peptides that correspond to a self-recognition element (SRE) of a native amyloid sequence but contain modifications so that the peptides bind to the parent protein at this element and prevent further aggregation.55 This is a β-assembly disruption strategy, with the introduction of proline, N-methylated, or α-disubstituted amino acids56,57 as the typical approach.

Numerous studies indicate that the NAC region (Fig. 1) of α-syn is linked to protein aggregation (e.g.34,58). Quite potent inhibitors of fibril formation have been reported based on both the residue 68–72 (GAVVT) and 77–82 (VAQKTV) segment of the NAC region. Madine59 examined N-methylation of sites in residues 71–82, with VAQKT-(N-Me)V emerging as an effective inhibitor. El-Agnaf54 synthesised an overlapping library of synthetic 7-mer peptides spanning the entire region for binding studies using full-length α-syn. The peptide that immerged from this study, RGAVVTGR-NH2, was reported to completely inhibit amyloid fibril formation at 2[thin space (1/6-em)]:[thin space (1/6-em)]1, 1[thin space (1/6-em)]:[thin space (1/6-em)]1 and 1[thin space (1/6-em)]:[thin space (1/6-em)]2 (peptide[thin space (1/6-em)]:[thin space (1/6-em)]α-syn) molar ratios. Some additional studies of this peptide appear in the present study.

The aryl-residue-rich hairpin category first appeared as a GB1 domain evolved to be an inhibitor of Alzheimer Aβ40 aggregation. The mutations that appeared in the inhibitor included K → W, G → W, K → Y and E → Y mutations with seven of the eight mutations occurred on the exposed face of a single hairpin of the B1 domain.60 With this as an inspiration, we examined mutants of the KKLTVS-IpGK-KITVSA hairpin sequence (p = D-Pro, to favour hairpin turn formation), with pairs of tyrosine and tryptophan residues introduced at a variety of positions, as potential inhibitors of amyloid formation from both human pancreatic amylin (hAM) and α-syn.13,61,62 Several of these proved to be potent inhibitors of amyloid fibril formation in both cases even though they bore no structural resemblance to either of the amyloidogenic systems. The mechanism of inhibition however appeared to be quite different: in the case of hAM, the effective inhibitors caused a long delay to amyloid formation onset and reduced the final yield of fibrils; in the case of α-syn, the formation of non-amyloid aggregates occurred instead. Peptide WW2 (KKLTVW-IpGK-WITVSA) was the most potent inhibitor for both amyloid processes. A highly truncated version of the hairpin employed as a control, μPro1 (C2H5CO-W-IpGK-WTG-NH2), also had quite different effects on the two amyloid-producing systems: in the case of hAM, it accelerated fibril formation but in the case of α-syn, it delayed amyloid fibril formation. The present study is an effort to extend the study to other hairpin analogs in the case of α-syn and to examine the earliest stages of the processes by solution-state NMR. EGCG and RGAVVTGR-NH2 were also included in the study.

Materials and methods

Materials

Labelled (15N) and unlabeled α-synuclein samples were prepared at the University of Padova by over-expression in E. coli BL2(DE3) growing in Luria–Bertani medium and purified as previously described.13 All solvents and chemicals used were reagent or spectroscopic grade commercial materials. Thioflavin-T was purchased from Sigma-Aldrich and used as obtained.

Peptide synthesis

Peptide hairpins and controls were synthesized by standard Fmoc Solid Phase Peptide Synthesis methods. Wang resin preloaded with C-terminal amino acids as well as Rink Amide-MBHA resin were employed. Peptides were cleaved from the resin using a 95[thin space (1/6-em)]:[thin space (1/6-em)]2.5[thin space (1/6-em)]:[thin space (1/6-em)]2.5 trifluoroacetic acid (TFA)[thin space (1/6-em)]:[thin space (1/6-em)]triisopropylsilane[thin space (1/6-em)]:[thin space (1/6-em)]water mixture. Cleaved peptides were purified by reverse-phase high pressure liquid chromatography (HPLC). Fractions that were collected, were lyophilized and characterized using a Bruker Esquire Ion Trap mass spectrometer as well as by NMR.
Peptide cyclization. Peptides that needed to be backbone cyclized were made using 2-Cl-Trt resin that was preloaded with the C-terminal resin. The protected peptide was cleaved from the resin using 3 × 30 min treatment with 1% TFA in dichloromethane (DCM). The peptide was then dissolved in 10 ml of N,N-dimethylformamide (DMF) and titrated into 30 ml of DMF with 5 eq. PyAoP/HATU and 3 eq. diisopropyl ethyl amine (DIEA). The mixture was allowed to cyclize overnight with constant stirring. DMF was then removed via rotavap and the product was dissolved in DCM and purified using solvent extraction methods with water. The cyclic protected peptide was then deprotected by dissolving the peptide in a mixture of 95[thin space (1/6-em)]:[thin space (1/6-em)]2.5[thin space (1/6-em)]:[thin space (1/6-em)]2.5 TFA[thin space (1/6-em)]:[thin space (1/6-em)]triisopropylsilane[thin space (1/6-em)]:[thin space (1/6-em)]water. The cyclic deprotected peptide was purified using HPLC as mentioned above.

Experimental methods

NMR spectroscopy. The characterization of peptides by TOCSY/NOESY spectra was done using 500 MHz and 700 MHz Bruker spectrometers. None of the peptide inhibitors displayed aggregate formation (or precipitation of any material) in NMR experiments that included addition of limited amounts of HFIP. The concentration range examined was 0–8 or 0–20 vol% HFIP. In most cases, there was an increase in β structure stability observed at 8 or 20 vol% HFIP as has previously been observed for other β hairpins.63–67
Circular dichroism spectroscopy. All spectra were recorded on a Jasco J-720 Circular Dichroism instrument. Typical spectral accumulation parameters were as follows: scan rate of 100 nm min−1 with a 2 nm bandwidth and a 0.1 nm step resolution over the wavelength range of 190–270 nm with eight scans averaged for each spectrum. Raw ellipticity data were converted into mean residue-molar ellipticity units (degrees square centimeters per residue-decimole), using the Jasco software. In all cases, the CD spectrum was corrected for a blank after reverse FT smoothing of both.
Fluorescence measurement. A Perkin Elmer LS-55 Fluorescence Spectrometer was employed as previously described13 with the fluorescence recorded in arbitrary intensity units. Sample preparation and further details are given in the “ThT fluorescence enhancement assays” section.
Stock solution preparations. Stock solutions of α-syn (200 μM) were made up in 50 mM NaCl, 50 mM phosphate buffer pH 6.5. Stock solutions of inhibitors (1 mM) were made in 50 mM NaCl, 50 mM phosphate buffer pH 6.5. HFIP additions employed either the pure materials or a stock solution of 10% in HFIP in the previously mentioned buffer. Stock solutions of ThT were prepared by weight in 50 mM phosphate buffer, pH 6.5 with further dilution by the same buffer to a 720 μM ThT basis.

CD assays of amyloidogenesis inhibition

Our previously reported13 assay was modified to include a preliminary incubation with peptides prior to adding an aggregatory stimulus (2 vol% HFIP) to allow the observation of the relative potency of the peptides (and EGCG) in promoting the precipitation of non-amyloid aggregates. Alpha-synuclein (final conc. 85 ± 5 μM) was dissolved in pH 6.6 buffer (50 mM in both potassium phosphates and NaCl) and 100 μl aliquots of the resulting solution were placed in a 2 ml glass vials with a screw cap lid and 7 mm stirbar. Potential inhibitors (1–4 molar equivalents) were added and the assay mixtures were rapidly stirred while maintaining the temperature at 37 ± 3 °C in a water bath. CD spectra were recorded throughout the course of the experiment using a 10 μl aliquot diluted to a total volume of 200 μl, a final α-syn concentration of 4.5 μM, in a 1 mm pathlength cell. The adjustment to a final solvent composition of 2 vol% HFIP was accomplished by addition of a 1[thin space (1/6-em)]:[thin space (1/6-em)]10 HFIP[thin space (1/6-em)]:[thin space (1/6-em)]buffer mixture after a 4 h period of stirring. As the assays continued, 10 μl samples were taken every 2–6 h for CD spectral acquisition. Typical CD changes during the course of such experiments appear in Fig. 2 and 3 as well as the panels of Fig. S3 (vide infra). The blank for experiments containing inhibitors was the buffer containing the same concentration of the inhibitor. No changes were observed in the inhibitor-containing blank upon adjusting the HFIP concentration to 2 vol%.
image file: c5ra00325c-f2.tif
Fig. 2 (A, and B) The time course, after HFIP addition, of two uninhibited control runs. (C) CD spectral changes observed in the presence of 2 molar equivalents of added EGCG which displayed an intermediate helical spectrum and no final CD spectrum, presumably due to aggregate precipitation. The t = 0 spectrum is for immediately after HFIP addition, not the initial spectrum recorded in the experiment; these were uniformly the same and very similar to the t = 0 trace in panel A.

image file: c5ra00325c-f3.tif
Fig. 3 (A) CD spectra at the 18 h point for an uninhibited control and runs with one molar equivalent of WW2, cyclo-WW2, and cpWW2. (B) Similar spectra, no control included, with 2 molar equivalents of cyclo-WW2, WW2, mWWhp, and WW2-DS. The spectrum with 2 equiv. of cyclo-WW2 is essentially identical to the starting spectrum of monomeric α-syn.

In the case of CD spectra recorded in the presence of amyloidogenesis inhibitors, we record the maximal β CD signal at the 217 nm minimum and the increase in ellipticity at 196 nm (196 nm is near the minimum observed for monomeric α-syn and the location of the β-structure maximum observed at 18 h in the absence of inhibition) as percentages of the specific controls and the average values observed for all controls with the same batch of α-syn. For samples containing inhibitors, the CD blank subtracted prior to generating the traces in Fig. 3 (and in the ESI) contained the same concentration of the inhibitor. The values reported in Table 2 are the mean of [θ]218/[θ]218(control) and Δ[θ]196/Δ[θ]196(control) values for at least two experiments.

ThT fluorescence enhancement assays

The ‘red shifted’ (from 450 to 482 nm) and enhanced fluorescence of ThT when it binds to amyloid forms of α-syn has been used for fluorescence assays of the effects of mutations on both the extent of aggregation26,46,68 and as a probe of amyloid formation kinetics26,41,68,69 and amyloidogenesis inhibition.13 While the increase in fluorescence intensity observed for other amyloid systems is much greater,43,48 the increase for α-syn is still readily detected. There are, however, α-syn aggregates that do not afford an enhanced ThT fluorescence.69 As with other amyloid systems,42,45 and in prior α-syn studies,26,46 we find that excitation at 450 nm with emission measured at 482 nm was optimal. As an assay for validating amyloidogenesis inhibition, it was essential to demonstrate that the ThT fluorescence measures correlated with the appearance of β structure and were reproducible. The changes, with time, in the emission spectrum of 32 μM ThT in the presence of 4.5 μM α-syn after adjusting the medium to 2 vol% HFIP appear in Fig. S4A. The increase in fluorescence intensity begins to appear at 4 hours and reaches a maximum at 16–18 hours, mirroring the corresponding changes in the CD spectrum (see Fig. 2A and S3-A1 and A2 for the comparison) that indicate the formation of β-sheet structure. In the absence of HFIP addition, the fluorescence intensity at 482 nm does not increase over this time period and is, at the 18 h point, 7-fold less than that observed in the presence of HFIP (see Fig. S4A). Similar increases in ThT fluorescence intensity has been reported in prior studies of α-synuclein, both in purely aqueous buffers46 and in media with added HFIP providing the stimulus for accelerated aggregation.13

In studies of the extent of amyloid formation inhibition effected by added peptides (and EGCG), the assays were performed using the CD sample prepared 16–18 hours after HFIP addition. To obtain the ThT fluorescence measurement, 10 μl of a 720 μM ThT stock solution (corresponding to an 8-fold excess based on the original monomeric α-syn content) was added to that CD sample. The resulting solution was examined in a 10 mm pathlength quartz cuvette using Perkin Elmer LS-55 Fluorescence Spectrometer with an excitation wavelength of 450 nm and measuring emission at 482 nm. For uninhibited control experiments during the course of this study, the A482 value was relatively reproducible, 775 ± 150 units. Typical values for full inhibition, based on parallel CD assays, were A482 ≤ 60. A typical set of excitation/emission spectra from aggregation inhibition studies appears as Fig. S4C.

NMR binding studies

The binding studies were conducted using HSQC spectra obtained on 700 MHz or 800 MHz Bruker spectrometers. NMR samples were made up using 15N-labeled α-syn dissolved in 10% 1 mM DSS in D2O with 90% buffer. Increasing amounts of inhibitors were added to the sample and spectra were taken. Pure HFIP was added to a final concentration of 1.5 vol% to initiate aggregation once the inhibitor titration was complete with continuing NMR monitoring.

Results & discussion

An underlying hypothesis that guided the previous, and the present, study was that the outward-directed H-bonding sites of the strands of a folded β-hairpin could facilitate intermolecular sheet formation with a pre-amyloid state and hence prevent the self-self-recognition associated with fibril growth and as a result inhibit amyloid formation. The inclusion of Trp and Tyr residues in the strands was based on analogy40 and the observation that these hydrophobic residues are often observed at peptide/protein interfaces.51

Although the hairpins we tested13 display rather high fold populations, χF = 0.6–0.9, under the aggregation inhibition assay conditions, the fold stabilities were not so great as to preclude unfolding prior to association with α-syn. As a test of the “hairpin hypothesis” inherent in our inhibitor design strategy, we prepared two version of peptide WW2 in which a folded hairpin conformation is fixed by cyclization: in one case (WW2-DS) by a disulphide closure between cross-strand non-H-bonded sites, in the other case (cyclo-WW2) by including a tight IpPK β-turn connecting the far ends of the hairpin. Cyclo-WW2 was prepared by folding-assisted amide formation with cp-WW2 as the substrate. This sequence (cp-WW2) corresponds to a “circular permutation” of the original WW2 sequence which moves the edge-to-face Trp/Trp interaction from a turn-flanking position64,66 to an end-capping position.63,67 The NMR diagnostics of an EtF indole/indole cluster (the far upfield shift of Hε3 of the edge-indole)64–66 were evident in both species, see ESI. The additional β-sheet models examined as potential inhibitors were available from other studies of hairpins with cross-strand aryl clusters flanking a turn (as in WW2) or at the chain termini (as in cp-WW2) appear below. The peptides designated as mWWhp and cp-mWWhp are mutated fragments corresponding to the N-terminal hairpin of the Pin1 WW domain and its circular permutant (Table 1).67

Table 1 Peptides examined as possible α-syn amyloidogenesis inhibitors
WW2 KKLTVW-IpGK-WITVSA
WW2-DS KCLTVW-IpGK-WITVCA
Cyclo-WW2 Cyclo-(K-KLTVW-IpGK-WITVS-IpP)
cp-WW2 GKWITVS-IpPK-KLTVWIp
mWWhp RWEKRW-DRGSGR-WFYFND
cp-mWWhp RWFYFN-DRGSGK-WEKRWD
RAVWW RAVTW-NPATGK-WITVWE
RW-HCH-WE (RWTTHCHRKWE)2
μPro1 C2H5CO-W-IpGK-WTG-NH2
RY-HCH-YE (RYTTHCHRKYE)2
RY-VCI-YE (RYTTVCIRKYE)2
YY-μPro CH3CO-Y-IpGK-YTG-NH2
AcY-VCI-YTG (Ac-YTTVCIRKYTG)2
RGAVVTGR-NH2


Peptides RW-HCH-WE, RY-HCH-YE, RY-VCI-YE, and AcY-VCI-YTG are β-sheet models that are not hairpins; antiparallel strand association occurs due to the disulphide linkage and an edge-to-face aryl/aryl cluster at the β-strand termini. RW-HCH-WE can be viewed as a mimic of cp-WW2 (and cp-mWWhp) since it has a two similar Trp/Trp β-caps at the strand ends. In RY-HCH-YE these are replaced by Tyr/Tyr clusters the β-sheet population drops significantly, from 94% to 28% at 300 K (χF = 0.94 ± 0.02 and 0.28 ± 0.13). RY-VCI-YE and AcY-VCI-YTG are more stably folded constructs. AcY-VCI-YTG mimics, at both termini, the Y/Y cluster present in YY-μPro; however, both AcY-DS-YTG and YY-μPro are only partially folded into the hairpin state under the assay conditions, with folded state populations (χF) of 0.84 and 0.55, respectively, at 300 K based on the NMR data collected. We also included the peptide inhibitor, RGAVVTGR-NH2, reported by El-Agnaf54 in the study.

We also included one non-peptidic inhibitor in our study, EGCG.12 In the case of EGCG we employed CD spectroscopy and visual inspection (for precipitate formation) for our initial examination of interactions with α-syn. The α-syn concentration was kept constant at 100 μM and samples at 1[thin space (1/6-em)]:[thin space (1/6-em)]1, 1[thin space (1/6-em)]:[thin space (1/6-em)]5, and 1[thin space (1/6-em)]:[thin space (1/6-em)]10 α-syn[thin space (1/6-em)]:[thin space (1/6-em)]EGCG ratios were prepared. In agreement with the prior literature,12 the 1[thin space (1/6-em)]:[thin space (1/6-em)]10 sample resulted in immediate precipitation and the no CD signals were evident. The 1[thin space (1/6-em)]:[thin space (1/6-em)]1 sample showed an initial random coil signature which remained for 8 hours after HFIP was added to a 1.5 vol% concentration, upon performing a CD scan at 24 hours, the signature had changed to that of a β-sheet. The 1[thin space (1/6-em)]:[thin space (1/6-em)]5 sample gave noisier CD spectra (presumably due to some α-syn aggregate formation) and a much weaker β-sheet CD signature at the 6 h post HFIP addition point. Upon standing for longer times, precipitate formed and CD spectra could not be collected.

Quantitating amyloidogenesis and its inhibition

Our prior assay was modified to include a preliminary incubation with peptides prior to adding an aggregatory stimulus (2 vol% HFIP). Munishkina et al.70 have examined α-syn in aqueous HFIP with a range of HFIP compositions; CD changes reflecting increased helicity were not observed at ≤2 vol% HFIP. In our assay, the α-syn concentration was 85 ± 5 μM in pH 6.6 50 mM potassium phosphate buffer containing 50 mM NaCl. All assay were performed at 37 ± 3 °C in water bath with constant stirring. In the absence of added peptides, the CD spectra indicate a predominantly random coil state ([θ]198 = −15[thin space (1/6-em)]800 ± 1200) with a modest level of helicity indicated by the negative shoulder near 222 nm. This spectrum did not change until the solvent composition was adjusted to 2 vol% HFIP. After HFIP addition, the CD spectrum changes with a maximal β-sheet signature appearing after 16–20 hours of stirring and heating (Fig. 2, panels A and B vide supra).

The changes in the CD spectrum for uninhibited controls was qualitatively reproducible and a close match to literature reports,13,47,71–73 a random coil signal first disappearing and then being replaced by a distinct β-structure signature (Fig. 2). In a few but not all runs with added EGCG or μPro1, the CD spectrum at intermediate times was distinctly more helical than those observed for controls; one such example appears as panel C of Fig. 2. The β-oligomer state is characterized by a minimum at 217.6 ± 1 nm ([θ] ≈ −16[thin space (1/6-em)]000) and a less reproducible maximum at 196 nm ([θ] = 22[thin space (1/6-em)]000–35[thin space (1/6-em)]000). In some assays (particularly with added peptides), the minimum is red-shifted to 220–223 nm suggesting some residual helical structure contributions.

We cross-validated the CD assays with ThT fluorescence assays. ThT fluorescence has been a well-established probe for the formation of cross-β structured amyloid systems since 1959.42,74,75 ThT was added to the CD samples and the resulting fluorescence emission spectra were recorded and compared to the uninhibited control (see Fig. S4C for an example). The resulting fluorescence intensity, as a “%-of-control”, is given in Table 2. CD spectra were also recorded as “%-of-control” values for the specific diagnostics of β-structure. The diagnostic employed and the reference values for uninhibited β-structure formation appear in the Methods section. The %-of-control values are also converted to %-inhibition measures for the added peptides (and EGCG) in Table 2.

Table 2 Extent of HFIP-induced α-syn amyloid formation in the presence of EGCG and peptides. The right-hand column converts these values to a %-inhibition value
Inhibitor Molar equiv. Assay measure (% of the uninhibited control) %-Inhib.
ThT fluor. β-structure CD signature
RGAVVTGR-NH2 2 91 ± 15 74 ± 23 <25
EGCG 2 22 ± 7 38 ± 11 ∼65
[thin space (1/6-em)]
Trp/Trp species
WW2 1 40 ± 16 57 ± 31 ∼50
2 27 ± 11 20 ± 14 ∼75
WW2-DS 1 65 ± 16 84, 100 <30
2 49 ± 21 64 ± 9 ∼50
Cyclo-WW2 1 26 ± 13 22 ± 14 ∼75
2 8 ± 4 9 ± 7 >90
cp-WW2 1 76 ± 15 52 ± 22 ∼35
2 34 ± 19 33 ± 16 ∼65
mWWhp 2 44 ± 9 51 ± 10 ∼50
cp-mWWhp 2 89 ± 13 80 ± 7 <20
RAVWW 2 37 ± 7 46 ± 10 ∼60
RW-HCH-WE 1 34 ± 10 36 ± 9 ∼65
2 16 ± 11 25 ± 7 ≥75
μPro1 2 37 ± 10 56 ± 10 ∼50
[thin space (1/6-em)]
Tyr/Tyr species
RY-HCH-YE 2 37 ± 8 23, 26 ∼70
RY-VCI-YE 1 38, 44 55 ± 9 ∼50
2 19 ± 7 22 ± 9 ∼80
AcY-VCI-YTG 2 27 ± 6 30 ± 11 ∼70
YY-μPro 1 11 ± 5 16 ± 8 ∼85
2 8 ± 7 4, 5 ≥90


Under our assay conditions, El-Agnaf's solubilized α-syn sequence fragment (RGAVVTGR-NH2)54 failed to display any inhibitory activity (see Fig. S3C); the absence of inhibitory activity was confirmed in a single experiment using 4 molar equivalents of the peptide. EGCG was an effective inhibitor (65% inhibition) at the 2[thin space (1/6-em)]:[thin space (1/6-em)]1 molar ratio, condition under which non-amyloid aggregate precipitation was not observed (see Fig. S3C). A modest level of inhibition was confirmed for μPro1. In the case of agents that produce precipitates (which includes most of the WW2-related sequences in at least some of the assay runs), the quantitation of both the extent of β-structure formation (CD) and amyloid protofibril formation (ThT fluorescence) are less than ideal due to particulate effects on optical spectroscopies and the effective removal of an unknown portion of the α-syn-derived species from solution. As can be seen from the tabulation in Table 2, there was quite large variability in the “amyloid signals (% of control)” values. In the case of WW2, cp-WW2 and cyclo-WW2 at an equimolar ratio, the averages reflect at least three measures of the “amyloid signals” in each of four separate assay runs using two batches of α-syn. Although there was significant variability, the inhibitory potencies of WW2, its cyclic form and its circular permutant, a clear trend emerged – cyclo-WW2 ≫ WW2 ≥ cp-WW2 in inhibitory activity. Cyclo-WW2 emerged as the most effective α-syn amyloidogenesis inhibitor. The alternative cyclization strategy, disulfide formation across the terminal non-H-bonded sites of the β strands rather than backbone cyclization with an additional β-turn, afforded WW2-DS which is distinctly less effective as an inhibitor. Some CD assay comparisons appear in Fig. 3.

The two peptides, mWWhp (Fig. 3B) and RAVWW, with a Trp/Trp flanked six-residue turn were, as previously seen for an analogous peptide with this motif,13 less effective inhibitors and did not produce off-path precipitates in this set of assays. One hairpin (cp-WW2) with the cross-strand Trp/Trp pair placed near the termini rather than in a turn-flanking position does display significant inhibitory potency. A non-hairpin β sheet model, RW-HCH-WE, incorporating two such β-capping63 features proved to be among the more potent inhibitors and the CD spectra provided clear evidence that this β-peptide co-precipitates, incorporated in the α-syn aggregates that form. RW-HCH-WE has a particularly large exciton couplet feature in its CD spectrum; this feature disappears from the spectrum shortly after HFIP addition as the aggregates precipitate (see Fig. S3C).

The last four peptides in Table 2 have Tyr/Tyr clusters rather than Trp/Trp clusters. In our prior report,13 YY2 (the tyrosine analog of WW2) was shown to be an equally potent inhibitor as measured by a ThT fluorescence assay. In the present study, four peptides with chain terminal Y/Y interactions gave circa 70–80% inhibition at a 2[thin space (1/6-em)]:[thin space (1/6-em)]1 molar ratio. By both assays, the tyrosine analog of μPro1 (YY-μPro) proved to be one of the more potent inhibitors of β-structure formation (see Fig. S4C for a CD assay).

15N-HSQC spectral studies of α-syn β-oligomerization and its inhibition

We explored the changes that result during the early stages of uninhibited amyloid formation and modifications to these that occur in the presence of added peptide inhibitors by 2D NMR experiments with 15N-labelled α-syn. In a variety of buffers, both with and without the addition of 1.5 vol% HFIP, the initial 15N-HSQC spectra of 100–400 μM α-syn alone nearly reproduced the results reported by Bax:38 and Baum:40 75–80% of the signals produced were sufficiently resolved for an unambiguous assignment by analogy. Several different batches of 15N-labelled α-syn were employed in these studies (and the inhibitor titrations, vide infra). The chemical shifts observed in the initial 15N-HSQC spectra observed were completely reproducible from batch to batch but some of the peaks (most notably the H50 resonance) which were shown to display rapid attenuation of peak intensity (see Fig. 4) were absent in the initial spectra of some batches, particularly at the higher temperature.
image file: c5ra00325c-f4.tif
Fig. 4 Time course of α-syn spectral changes associated with the early stages of amyloid formation. Panel A shows an α-syn 15N-HSQC spectrum collected on another sample (400 μM) in the absence of added HFIP (20 mM phosphate buffer, pH 7). Panels B – D record incubation time changes in the spectrum of 100 μM α-syn in 20 mM Tris buffer (pH 7) at 303 K with 1.5 vol% HFIP present throughout, panel B is the initial spectrum (t ≈ 1 h), some of the peak displaying diminished intensity are labelled. Panel C is an overlay of the t = 6.5 h point (blue) on the t = 1 h spectrum (red), residues which have disappeared by 6.5 hours are indicated. Parenthetic assignments in panel C are viewed as less than fully established by analogy due to buffer-induced shift changes versus panel A. Panel D is the t = 12 h spectrum (red) superimposed on t = 6.5 h (blue), the assignable residues remaining in the spectrum are labelled. Two glycine residues (G31 and G86), appearing at 15N δ values less than 108 ppm, are missing (off-scale) from panel A; these have completely disappeared in the first spectrum collected with HFIP present. Throughout the C-terminal A140 peak appears at 130.63 and 7.942 ppm with undiminished intensity and is not shown in the panels.

The time course of spectral changes for uninhibited α-syn was examined first. The intent was to ascertain whether there were specific sequence segments of α-syn that would disappear from the spectra or if the disappearing peaks were ‘randomly’ spread throughout the sequence. The spectral changes for an uninhibited 100 μM α-syn sample with 1.5 vol% HFIP present as the aggregatory stimulus were followed over a 12 hour period (Fig. 4). The NMR sample was still a transparent homogeneous solution at the 12 hour time point, this implied the absence of mature fibrils. Fibrils do precipitate out of these solutions at longer times (several days).

In Fig. 4, peaks (besides G31 and G86) that disappeared most rapidly are labelled in panel A (V3, S9, K21, K23, G41, S42, K43, T44, H50, K58, G73, V77, K80), with additional rapidly attenuated peaks labelled in panel B (T22, K32, G68, A76, A85, G93). These and the additional peaks (F4, L8, K10, G25, A27, A29, T33, G51, A53, T72, G84, T92, N103) that disappeared by the 6.5 h point (panel C), with the exceptions of T92/G93/N103, were either in the V37-T54 residue span (bold), near the N-terminus, or located about previously recognized “amyloidogenic patches” (G67GAVVTG73 or V77AQKTV82). The disappearance of the amyloidogenic patch peaks, the L8-K10/G41-A53 segments and the T92 & G93 peaks is viewed as an indicator of pre-amyloid oligomer formation. By the 12 hour time point, the remaining peaks that could be definitively assigned were all in the C-terminal sequence: E104-A140.

The experiment shown in Fig. 4, panels B–D was repeated with a 200 μM concentration of two potential inhibitors present. In the case of μPro1, the final disappearance of peaks outside of C-terminal segment was delayed: significant “protection” was observed for the L8, V37, V40 and V48 sites. With peptide WW2 added, shifts in the peak locations (notably at D121, N122, S129, G132 and Y133) were observed at the t = 1 h point, and a number of peaks were more attenuated or broadened by the 6 h point (notably A17 and M127). WW2 also provided some protection from HFIP-induced peak attenuation at L38 and K97; in addition, the M127 peak showed extensive broadening by the 6 h point. Otherwise, the selective peak attenuations, appeared to be essentially the same in the presence and absence of WW2. No precipitates were evident after 14 hours of incubation of 2[thin space (1/6-em)]:[thin space (1/6-em)]1 WW2/α-syn in the presence of 1.5 vol% HFIP. When the experiment was repeated with 3[thin space (1/6-em)]:[thin space (1/6-em)]1 WW2/α-syn, peak lineshapes degraded by t = 6 h, presumably due to particulate formation.

Determining binding shifts

Shifts due to initial inhibitor binding to monomeric α-syn were more readily observed at higher α-syn concentrations (200 or 400 μM) in the absence of added HFIP and stirring. In the case of WW2, 15N-HSQC spectra were recorded for 400 μM α-syn (in 20 mM phosphate pH 7 buffer) as the WW2 concentration was serially increased to 120, 240 and 600 μM at 293 K. Following the final addition of inhibitor, 1.5 vol% HFIP was added. Substantial titration shifts were observed upon adding peptide WW2 (Fig. 5).
image file: c5ra00325c-f5.tif
Fig. 5 Titration shifts in segments of the HSQC spectrum of 400 μM α-syn upon increasing the peptide WW2 concentration from 240 (blue) to 600 μM (red). Smaller shifts, in the same direction were observed for the 120 to 240 μM change in peptide WW2 concentration. The peaks that shifted are labelled at their 240 μM position.

Fig. 5 shows some of the largest titration shifts observed as well as a smaller shift at Y136. Shifts were also observed at E130 and E131 (Fig. S5); small but still significant shifts were also observed at A124, M127, Y136, and E137. No comparable shifts were detected for the resolved peaks from residues 52 through 103. We view this as evidence for a specific binding interaction between WW2 and the M116-E137 sequence segment of α-syn. The shifts may reflect ring current effects due to the Trp residues in WW2 or a binding-induced conformational change in this region. The addition of HFIP (to 1.5 vol%) partially reversed the titration shifts and after 2 hours, aggregates (presumably of the non-amyloid type) began to precipitate.

In a similar study (400 μM α-syn in 50 mM phosphate pH 6.5 buffer, 303 K) of the effects of cp-WW2 addition, the V118, D119, D121, N122, S129, and G132 signals displayed titration shifts in the same direction (Fig. 6, mostly in the left panel) as observed for peptide WW2 with 0.6 equivalents of the peptide added. Chemical shift changes were also observed at M116/A124/Y133/Y136/E137 (Fig. 6, right panel) and these were larger than those observed with peptide WW2. Titration shifts were also observed at E130 and E131 but these were in the opposite direction to those observed for WW2 (Fig. S5). These changes in relative binding shift magnitudes (and in two cases direction of shift) may reflect the structural changes in the peptide: while the hairpin strands may form the same local structure, the Trp residues in cp-WW2 appear at the strand ends remote from the turn and the residues comprising the turn are different. Nonetheless, the binding locus on α-syn remains isolated to the C-terminus for both peptides.


image file: c5ra00325c-f6.tif
Fig. 6 Titration shifts in segments of the HSQC spectrum of 400 μM α-syn upon increasing the cp-WW2 concentration from 0 (blue) to 0.6 molar equivalents (red). Signal attenuation was also evident at S129, G132 and Y133. The shifted peaks are labelled at their location in the absence of added peptide.

When the cp-WW2[thin space (1/6-em)]:[thin space (1/6-em)]α-syn ratio was increased to 1.5[thin space (1/6-em)]:[thin space (1/6-em)]1.0 in this experiment, the E126/S129/G132/Y133/Y136 signal broadened to the extent that they disappeared completely from the spectrum and the peaks associated with D119 and E137 displayed much larger shift changes. Titration shifts also appeared for L113 and A124.

A more extensive titration (0, 0.6, 1.2, and 2.2 equivalent of peptide added to 200 μM α-syn at 293 K) was carried out with cyclo-WW2 (Fig. S7). For the first two points of the titration, all of the residues in the Q109/E137-span that are resolved display titration shifts and these are, in all cases, in the same direction and have the same relative magnitudes as was observed for WW2. There were also clearly discernable titration shifts at G41,V48,H50,V52,T54; this likely represents an important secondary binding locus. Of these the chemical shift change at H50 was the largest and was accompanied by substantial peak attenuation: the H50 signal is absent from Fig. S7A for the 1.2 equivalent added point. As previously noted, the H50 resonance is also the first peak to disappear from the spectrum of uninhibited α-syn. Upon increasing the amount of cyclo-WW2 to 2.2 molar equivalents (a ratio not examined in the WW2 experiment), all the peaks with large titration shifts at 1.2 equivalents were attenuated to point that they do not show up (Fig. S7B) with our usual signal cut-off for 2D spectral figures. Some cloudiness suggesting aggregate precipitation was evident at the end of the NMR data collection at 2.2 molar equivalents. Upon adjusting the solvent composition to 1.5 vol% HFIP, precipitate formation was clearly evident but an HSQC spectrum with comparable peak intensities could be recorded. The previously noted upfield shift of many signals upon HFIP addition was also observed in this case and a number the peaks that had disappeared in the 2.2 equivalents spectrum recorded prior to HFIP addition were now visible although still somewhat attenuated. Possible explanations for the shift changes and the reappearance of attenuated peaks appear in the ESI.

Similar studies of μPro1 and YY-μPro did not result in measurable titration-related changes in the chemical shifts of the α-syn HSQC peaks. The data for the YY-μPro experiment (0.5 or 1.5 equivalents titrated into 200 μM α-syn at 303 K) appears in Fig. S6. While there were no titration shifts in these experiments, there was, however, a common feature in these experiments and the prior experiments on WW2 analogs and RW-HCH-WE experiment, HFIP addition at the end of the titration results in an upfield displacement along both shifts axes, particularly for 15N-shifts in this experiment (Fig. S8), of most of the α-syn peaks when the A140 is employed for cross-referencing. However, this may reflect a change in the chemical shifts for A140 and other carboxylate bearing sites rather than a general solvent effect on the other shifts.

A titration study was also performed with RW-HCH-WE: very large shifts were observed at C-terminal sites (Fig. 7), often (but not always) in the same direction as observed for the WW2 hairpins examined: the largest shifts were at Y125 and E126. A number of these titration shifts were larger than those observed with the WW2 peptide analogs. In contrast to the WW2 hairpins, the titration shifts observed with RW-HCH-WE were not reversed upon HFIP addition (Fig. S8); this may reflect higher affinity due to the greater concentration of Trp-residues in this dimeric β-sheet structure. We did, however, observe the general upfield shift of numerous signals from the N-terminal two-thirds of the sequence upon HFIP addition (Fig. S8).


image file: c5ra00325c-f7.tif
Fig. 7 Titration shifts observed upon adding peptide RW-HCH-WE to 200 μM a-syn at 303 K. The original spectrum prior to peptide addition appears as blue peaks with the spectra with 0.5 and 1.5 equivalents of peptide added shown in red and green, respectively.

Thus, for four β-peptide inhibitors, the titration studies indicate binding predominantly in the non-amyloidogenic C-terminal segment of monomeric α-syn. The C-terminus of monomeric α-syn is generally viewed as a random coil structure. This suggests that both the formation of the non-amyloid aggregates previously noted for some of these inhibitors13 and the observed inhibition of the amyloid-producing pathway result from a C-terminal binding-induced structuring transition of α-syn.

A similar mechanism, non-amyloid aggregate formation with a C-terminal binding site, has also been suggested for EGCG.12,76 The binding site for EGCG on monomeric α-syn proposed by Ehrnhoefer et al. was based on NMR binding studies, inhibitor titration followed by 15N HSQC experiments, the results of which were summarized12 thus: “progressive broadening of resonances, which was most evident at five-fold and ten-fold excess of EGCG. Resonances concentrated at the C-terminus of α-syn (D119, S129, E130, D135) disappeared already at equimolar compound concentration, indicating that the compound binds preferentially to [this] highly flexible region of the protein.” Based on the α-syn HSQC spectral assignments of Bax38 which we utilize, the published 15N-HSQC titration spectra of Ehrnhoefer et al. do not support the statement concerning the disappearance of the D119, S129, and E130 signals. These peaks are all far removed from other peaks and clearly visible in the published spectra12 even at the 5[thin space (1/6-em)]:[thin space (1/6-em)]1 ratio of EGCG to α-syn. The published spectra do, based on the assignments used herein, display titration shifts at Q109/E110/L113/D119/D121/S129 in the C-terminus but there were also equally large shifts elsewhere (A17, A27, V40, G41, V95). The most notable feature of the published spectra was a relative similar (0.04 ppm) upfield 1H shift for most of the peaks in the spectrum on going from 1[thin space (1/6-em)]:[thin space (1/6-em)]1 to 5[thin space (1/6-em)]:[thin space (1/6-em)]1 EGCG/α-syn. This anomaly and the apparent discrepancy regarding peaks shifting rather than disappearing prompted us to re-examine EGCG/α-syn mixtures. The binding of EGCG to flexible C-terminus of α-syn oligomers has been confirmed in a recent study.76

As previously noted, we observed immediate precipitation at a 10[thin space (1/6-em)]:[thin space (1/6-em)]1 EGCG/α-syn ratio which precluded solution NMR studies. At 200 μM α-syn (50 mM phosphate, pH 6.5, 303 K) with 5 molar equivalents of EGCG added, the time window prior to precipitation and β-oligomer formation was sufficient to allow the collection of 15N HSQC data. We also observe many peaks that move upfield, but these shifts (Δδ(1H) = 0.007–0.010 ppm) were much smaller than those in the prior literature spectra,12 see ESI and Fig. S9 for more details regarding this experiment. We turned to a direct titration at lower EGCG/α-syn ratios to ascertain whether there were loci of higher affinity binding for EGCG (Fig. S10). None of the titration shifts at 1.5[thin space (1/6-em)]:[thin space (1/6-em)]1 EGCG/α-syn were as large as those we observed for the 0.6[thin space (1/6-em)]:[thin space (1/6-em)]1 “WW2-peptide”/α-syn mixtures. There were shifts at C-terminal sites, the largest ones at L113 and D119 (see Fig. S10) but there were also shifts in the N-terminal region, A17-S42, with those at A17 and G41 as large as the largest shifts in the C-terminal segment. No titration shift information was available for S9, K10, A11, K43 and H50 as these peaks disappeared almost immediately.

With the exceptions noted above, all of the α-syn HSQC peaks were still present in the 1.5[thin space (1/6-em)]:[thin space (1/6-em)]1 EGCG/α-syn sample 6 hours after preparation (see Fig. S10) although a number of the peaks that display diminished intensity in Panel C of Fig. 4 were somewhat attenuated at this point. We added HFIP to a 1.5 vol% level to monitor further changes. No precipitation occurred over the next 96 hours, but the set of peaks displaying decreasing intensity with time (see Fig. S11) was the same as that seen upon incubation of α-syn with HFIP in the absence of an inhibitor (Fig. 4). The peaks for V3, F4, L8, G31, 41, 68, 93, K21, 32, 58, 80, T54, N103 were completely absent from the spectrum 72 hours after HFIP addition. Incubation time dependent changes in chemical shifts after HFIP addition for some residues in the C-terminal segment of α-syn reversed the shifts that were observed upon EGCG addition. Taken together these observations suggest a normal course, but slower rate, of β-oligomer formation in the presence of EGCG.

Conclusions

Studies of the inhibition of β-structure formation by α-syn have been extended to eleven β-structured peptides bearing multiple tryptophan and tyrosine residues. While the precipitation of aggregates does reduce the accuracy of relative inhibitory potencies that can be obtained from the CD and ThT fluorescence assays in some cases, a number of conclusions can be reached and additional insights were gained by inhibitor titration studies that defined binding loci. In the discovery13 peptide, WW2, the Trp residues flanked the turn and the hairpin conformation was not the only possible state for the peptide. The cyclization of a circularly permuted sequence (cp-WW2) provided a cyclic hairpin that must retain a hairpin conformation under all conditions including upon binding to α-syn. This cyclic hairpin proved to be the most potent inhibitor of α-syn amyloidogenesis. Here it should be noted that a Trp-flanked hairpin has also been reported to inhibit Aβ and transthyretin amyloid formation.77 With our prior observations13 regarding peptide WW2, it appear that hairpins with a cross-strand W/W pair may be a general strategy for obtaining amyloidogenesis inhibition. Significant inhibition of β-structuring was also observed for a number peptide β-structures with Tyr/Tyr clusters replacing the edge-to-face indole/indole cluster found in the Trp-bearing systems. Of these, YY-μPro (the smallest representative, Ac-Y-IpGK-YTG-NH2) may serve as the basis for optimization of another series of α-syn amyloidogenesis inhibitors.

The time course of HSQC spectral changes for 15N-α-syn upon addition of an aggregatory stimulus, adjusting the medium to 1.5% HFIP by volume, with and without added peptide inhibitors, indicated by signal attenuation, the sites that become immobilized in oligomeric states that form. Early signal attenuation was noted at the extreme N-terminus (V3, F4, L8 and S9), in two previously recognized amyloidogenic patches (G67GAVVTG73 or V77AQKTV82),54,59 and in two β-strand segments (V37-K43 and V48-T54) that have recently been implicated as a binding-induced structural unit in another α-syn aggregation inhibition study. Mirecka et al.27 have reported the formation of a hairpin structure for the V37LYVGSK43-TKEG-V48VHGVAT54 sequence in a complex between α-syn and a re-engineered protein that is a sub-stoichiometric inhibitor of α-syn amyloid formation. These segments are also part of the parallel β-core of α-syn fibrils.2,78–80

The sequence of HSQC peak attenuations in the presence of limited amounts of both EGCG and peptide WW2 that produced partial inhibition, but did not produce non-amyloid aggregate precipitates, was the same as that observed in the absence of an inhibitor. This suggests that the earliest stages of the amyloidogenesis process are not altered although they occur at a slow rate and less extensively with both of these inhibitors present.

At the final point (12–16 h post HFIP addition) in the HSQC studies of uninhibited α-syn, the only peaks remaining are from the carboxylate- and proline-rich C-terminal E104-A140 sequence. This implies a fully flexible C-terminus in the resulting oligomers. The nature of the oligomeric species at this point is not fully elucidated. CD and ThT fluorescence studies on other samples which appear to be at the same point in the amyloidogenic time course display β-structures by CD and enhanced ThT fluorescence indicative of binding to a cross-β structure42,43,45,48 comparable to that observed for fully-formed amyloid species derived from α-syn.26,45,71–73 On that basis, these β-oligomers should likely be viewed as protofibrils. Upon further standing the NMR samples lacking added inhibitors do yield amyloid fibril precipitates. A recent NMR study of α-syn oligomers76 finds a somewhat longer section of the C-terminus to be unstructured, with all residues past G86 observed in the standard solution conditions spectra. This study also reported binding in this region by EGCG.

When WW2 (as well as its circular permutant and cyclo-WW2) is titrated into an 15N-α-syn solution in media lacking the aggregatory stimulus, inhibitor-concentration-dependent titration shifts are observed throughout the C-terminal sequence. These were also observed for peptide RW-HCH-WE, a Trp-bearing β-structured peptide with high amyloid inhibition potency that associates with α-syn in aggregates that precipitate from solution. Fernandez et al.81 have shown that polyamines enhance the aggregation of α-syn by binding to the C-terminal tail of the protein (residues 109–140). Hoyer et al. and Li et al.82,83 have separately shown that truncation of the C-terminal tail results in an increased rate of oligomer formation. These results show that the C-terminal tail must play a significant modulating role in the formation of preamyloid β-oligomers.84 The interactions of peptides in this region could therefore disrupt oligomer formation and, in some cases, redirect the pathway to form non-toxic aggregates.

Fig. 8 places our inhibitor binding loci studies in the structural context of α-syn and its fibril forming behavior. The present study indicates that peptide binding at C-terminal sites inhibits early β-strand association steps. At the highest levels of added peptide inhibitor, the HSQC peaks that display titration shifts display significant signal attenuation implying both a relatively slow dissociation rate for the peptide/α-syn complex and a significant conformational change associated with this process. These titration shifts are all within the C-terminal segment of α-syn. While this region retains random coil flexibility in the beta oligomeric (or protofibril) state we observe; an early C-terminal binding event may also result in changes in the transient contacts between C-terminal sites and the NAC region or conformational changes in the amyloidogenic N-terminal regions that impedes the formation of pre-amyloid oligomers.


image file: c5ra00325c-f8.tif
Fig. 8 Scheme depicting the α-synuclein sequence and the binding loci for some inhibitors. The red area represents identified, potential β-structuring loci within (residues 67–82) and just to the N-terminus (residues 37–54) of the NAC region. Together these may represent the minimum sequence necessary for fibril formation. The green area represents the C-terminal region where binding of most inhibitors seems to occur. In some cases, binding at C-terminal sites has been associated with the formation of non-amyloid aggregates.

In the case of our most potent amyloidogenesis inhibitor, cyclo-WW2, complex formation with the C-terminal α-syn region results first in larger binding-induced shifts and then, with stoichiometric and greater amounts of added peptide, the shifted α-syn signals disappear from the spectrum. This suggests greater complex stability with either the formation of oligomeric structures or a major structuring transition on a slower timescale in this segment. As is indicated in Fig. 8, we also observed titration shifts within another sequence segment with cyclo-WW2, quite large shifts were observed at G41, V48, H50, and V52 (and probably at G51, but peak overlap makes this a less secure assignment) with discernable shifts also observed at A53 and T54. These same sites are part of the β-hairpin observed in the studies27 reported by Mirecka et al. The hairpin was observed in an inhibitory α-syn/wrappin complex. These residues have also been implicated in disease-causing α-syn mutations: notably, the A53T and E46K mutations. None of the titration shifts observed with our potent peptide inhibitors of aggregation were within the NAC region of α-syn (residues 61–95); direct interaction of inhibitors with the NAC region may not be necessary to inhibit preamyloid β-oligomer formation. This may also indicate that other non-covalent interactions within α-syn play the more important role in its misfolding to form the toxic species and disrupting such interactions may prove to be effective in preventing aggregation. Indeed, with the changes in the 15N-HSQC spectrum of uninhibited samples of α-syn indicating a very early aggregation event (or conformational transition) in the vicinity of H50 and this region being a confirmed binding site for our most potent amyloidogenesis inhibitor, the conformational states and binding properties of the V37-T54 segment of α-syn will be the target of further study.

Acknowledgements

The initial studies were supported by a grant from the NIH (GM059658-08S1). A. Byrne and K. Sivanesam received research assistant support from NIH grant GM099889 while working on this project.

References

  1. F. Chiti and C. M. Dobson, Annu. Rev. Biochem., 2006, 75, 333–366 (Nat. Chem. Biol., 2009, 5, 15–22) CrossRef CAS PubMed.
  2. G. Comellas, L. R. Lemkau, A. J. Nieuwkoop, K. D. Kloepper, D. T. Ladror, R. Ebisu, W. S. Woods, A. S. Lipton, J. M. George and C. M. Rienstra, J. Mol. Biol., 2011, 411, 881–895 CrossRef CAS PubMed.
  3. Y. Su, C. J. Sarell, M. T. Eddy, G. T. Debelouchina, L. B. Andreas, C. L. Pashley, S. E. Radford and R. G. Griffin, J. Am. Chem. Soc., 2014, 136, 6313–6325 CrossRef CAS PubMed; A. K. Paravastu, R. D. Leapman, W. Yau and R. Tycko, Proc. Natl. Acad. Sci. U. S. A., 2008, 105, 18349–18354 CrossRef PubMed.
  4. B. E. Roberts and J. Shorter, Nat. Struct. Mol. Biol., 2008, 15, 544–546 CAS.
  5. C. Haass and D. J. Selkoe, Nat. Rev. Mol. Cell Biol., 2007, 8, 101–112 CrossRef CAS PubMed; B. Winner, R. Jappelli, S. K. Maji, P. A. Desplats, L. Boyer, S. Aigner, C. Hetzer, T. Loher, M. Vilar, S. Campioni, C. Tzitzilonis, A. Soragni, S. Jessberger, H. Mira, A. Consiglio, E. Pham, E. Masliah, F. H. Gage and R. Riek, Proc. Natl. Acad. Sci. U. S. A., 2011, 108, 4194–4199 CrossRef PubMed.
  6. E. S.-H. Chang, T.-Y. Liao, T.-S. Lim, W. Fann and R. P.-Y. Chen, J. Mol. Biol., 2009, 385, 1257–1265 CrossRef CAS PubMed.
  7. P. T. Lansbury Jr, Curr. Opin. Chem. Biol., 1997, 1, 260–267 CrossRef CAS.
  8. C. Nerelius, A. Sandegren, H. Sargsyan, R. Raunak, H. Leijonmarck, U. Chatterjee, A. Fisahn, S. Imarisio, D. A. Lomas, D. C. Crowther, R. Strömberg and J. Johansson, Proc. Natl. Acad. Sci. U. S. A., 2009, 106, 9191–9196 CrossRef CAS PubMed.
  9. C. I. Stains, K. Mondal and I. Ghosh, ChemMedChem, 2007, 2, 1674–1692 CrossRef CAS PubMed.
  10. T. Takahashi and H. Mihara, Acc. Chem. Res., 2008, 41, 1309–1318 CrossRef CAS PubMed.
  11. S. M. Johnson, R. L. Wiseman, Y. Sekijima, N. S. Green, S. L. Adamski-Werner and J. W. Kelly, Acc. Chem. Res., 2005, 38, 911–921 CrossRef CAS PubMed.
  12. D. E. Ehrnhoefer, J. Bieschke, A. Boeddrich, M. Herbst, L. Masino, R. Lurz, S. Engemann, A. Pastore and E. E. Wanker, Nat. Struct. Mol. Biol., 2008, 15, 558–566 CAS.
  13. K. N. L. Huggins, M. Bisaglia, L. Bubacco, M. Tatarek-Nossol, A. Kapurniotu and N. H. Andersen, Biochemistry, 2011, 50, 8202–8212 CrossRef CAS PubMed.
  14. P. Y. Cho, G. Joshi, J. A. Johnson and R. M. Murphy, ACS Chem. Neurosci., 2014, 5, 542–551 CrossRef CAS PubMed.
  15. L. Pieri, K. Madiona, L. Bousset and R. Melki, Biophys. J., 2012, 102, 2894–2905 CrossRef CAS PubMed.
  16. R. G. Perez, J. C. Waymire, E. Lin, J. J. Liu, F. Guo and M. J. Zigmond, J. Neurosci., 2002, 22, 3090–3099 CAS.
  17. V. M. Nemani, W. Lu, V. Berge, K. Nakamura, B. Onoa, M. K. Lee, F. A. Chaudhry, R. A. Nicoll and R. H. Edwards, Neuron, 2010, 65, 66–79 CrossRef CAS PubMed.
  18. W. S. Woods, J. M. Boettcher, D. H. Zhou, K. D. Kloepper, K. L. Hartman, D. T. Ladror, Z. Qi, C. M. Rienstra and J. M. George, J. Biol. Chem., 2007, 282, 34555–34567 CrossRef CAS PubMed.
  19. J. Burré, M. Sharma, T. Tsetsenis, V. Buchman, M. R. Etherton and T. C. Südhof, Science, 2010, 329, 1663–1667 CrossRef PubMed.
  20. K. Nakamura, V. M. Nemani, E. K. Wallender, K. Kaehlcke, M. Ott and R. H. Edwards, J. Neurosci., 2008, 28, 12305–12317 CrossRef CAS PubMed.
  21. K. Nakamura, V. M. Nemani, F. Azarbal, G. Skibinski, J. M. Levy, K. Egami, L. Munishkina, J. Zhang, B. Gardner, J. Wakabayashi, H. Sesaki, Y. Cheng, S. Finkbeiner, R. L. Nussbaum, E. Masliah and R. H. Edwards, J. Biol. Chem., 2011, 286, 20710–20726 CrossRef CAS PubMed.
  22. K. Uéda, H. Fukushima, E. Masliah, Y. Xia, A. Iwai, M. Yoshimoto, D. A. Otero, J. Kondo, Y. Ihara and T. Saitoh, Proc. Natl. Acad. Sci. U. S. A., 1993, 90, 11282–11286 CrossRef.
  23. A. Iwai, E. Masliah, M. Yoshimoto, N. Ge, L. Flanagan, H. A. de Silva, A. Kittel and T. Saitoh, Neuron, 1995, 14, 467–475 CrossRef CAS.
  24. J.-E. Suk, S. B. Lokappa and T. S. Ulmer, Biochemistry, 2010, 49, 1533–1540 CrossRef CAS PubMed.
  25. J. N. Rao, Y. E. Kim, L. S. Park and T. S. Ulmer, J. Mol. Biol., 2009, 390, 516–529 CrossRef CAS PubMed.
  26. N. P. Ulrih, C. H. Barry and A. L. Fink, Biochim. Biophys. Acta, 2008, 1782, 581–585 CrossRef CAS PubMed.
  27. E. A. Mirecka, H. Shaykhalishahi, A. Gauhar, S. Akgül, J. Lecher, D. Willbold, M. Stoldt and W. Hoyer, Angew. Chem., Int. Ed. Engl., 2014, 53, 4227–4230 CrossRef CAS PubMed.
  28. P. Bernadó, C. W. Bertoncini, C. Griesinger, M. Zweckstetter and M. Blackledge, J. Am. Chem. Soc., 2005, 127, 17968–17969 CrossRef PubMed.
  29. M. M. Dedmon, K. Lindorff-Larsen, J. Christodoulou, M. Vendruscolo and C. M. Dobson, J. Am. Chem. Soc., 2005, 127, 476–477 CrossRef CAS PubMed.
  30. L. Salmon, G. Nodet, V. Ozenne, G. Yin, M. R. Jensen, M. Zweckstetter and M. Blackledge, J. Am. Chem. Soc., 2010, 132, 8407–8418 CrossRef CAS PubMed.
  31. E. R. Georgieva, T. F. Ramlall, P. P. Borbat, J. H. Freed and D. Eliezer, J. Am. Chem. Soc., 2008, 130, 12856–12857 CrossRef CAS PubMed.
  32. J. P. Anderson, D. E. Walker, J. M. Goldstein, R. de Laat, K. Banducci, R. J. Caccavello, R. Barbour, J. Huang, K. Kling, M. Lee, L. Diep, P. S. Keim, X. Shen, T. Chataway, M. G. Schlossmacher, P. Seubert, D. Schenk, S. Sinha, W. P. Gai and T. J. Chilcote, J. Biol. Chem., 2006, 281, 29739–29752 CrossRef CAS PubMed.
  33. M. Bisaglia, I. Tessari, L. Pinato, M. Bellanda, S. Giraudo, M. Fasano, E. Bergantino, L. Bubacco and S. Mammi, Biochemistry, 2005, 44, 329–339 CrossRef CAS PubMed.
  34. M. Bisaglia, A. Trolio, M. Bellanda, E. Bergantino, L. Bubacco and S. Mammi, Protein Sci., 2006, 15, 1408–1416 CrossRef CAS PubMed.
  35. D. Eliezer, E. Kutluay, R. Bussell Jr and G. Browne, J. Mol. Biol., 2001, 307, 1061–1073 CrossRef CAS PubMed.
  36. C. C. Jao, A. Der-Sarkissian, J. Chen and R. Langen, Proc. Natl. Acad. Sci. U. S. A., 2004, 101, 8331–8336 CrossRef CAS PubMed.
  37. T. S. Ulmer, A. Bax, N. B. Cole and R. L. Nussbaum, J. Biol. Chem., 2005, 280, 9595–9603 CrossRef CAS PubMed.
  38. C. R. Bodner, A. S. Maltsev, C. M. Dobson and A. Bax, Biochemistry, 2010, 49, 862–871 CrossRef CAS PubMed.
  39. S. B. Lokappa and T. S. Ulmer, J. Biol. Chem., 2011, 286, 21450–21457 CrossRef CAS PubMed.
  40. L. Kang, G. M. Moriarty, L. A. Woods, A. E. Ashcroft, S. E. Radford and J. Baum, Protein Sci., 2012, 21, 911–917 CrossRef CAS PubMed.
  41. L. Kang, M. K. Janowska, G. M. Moriarty and J. Baum, PLoS One, 2013, 8, e75018 CAS.
  42. H. Naiki, K. Higuchi, M. Hosokawa and T. Takeda, Anal. Biochem., 1989, 177, 244–249 CrossRef CAS.
  43. M. Groenning, M. Norrman, J. M. Flink, M. van de Weert, J. T. Bukrinsky, G. Schluckebier and S. Frokjaer, J. Struct. Biol., 2007, 159, 483–497 CrossRef CAS PubMed.
  44. M. Groenning, J. Chem. Biol., 2010, 3, 1–18 CrossRef PubMed.
  45. M. Biancalana and S. Koide, Biochim. Biophys. Acta, 2010, 1804, 1405–1412 CrossRef CAS PubMed.
  46. K. A. Conway, J. D. Harper and P. T. Lansbury Jr, Biochemistry, 2000, 39, 2552–2563 CrossRef CAS PubMed.
  47. A. I. Sulatskaya, I. M. Kuznetsova and K. K. Turoverov, J. Phys. Chem. B, 2012, 116, 2538–2544 CrossRef CAS PubMed.
  48. N. Amdursky, Y. Erez and D. Huppert, Acc. Chem. Res., 2012, 45, 1548–1557 CrossRef CAS PubMed.
  49. E. S. Voropai, M. P. Samtsov, K. N. Kaplevskii, A. A. Maskevich, V. I. Stepuro, O. I. Povarova, I. M. Kuznetsova, K. K. Turoverov, A. L. Fink and V. N. Uverskii, J. Appl. Spectrosc., 2003, 70, 868–874 CrossRef CAS.
  50. M. R. H. Krebs, E. H. C. Bromley and A. M. Donald, J. Struct. Biol., 2005, 149, 30–37 CrossRef CAS PubMed.
  51. M. Caruana, T. Högen, J. Levin, A. Hillmer, A. Giese and N. Vassallo, FEBS Lett., 2011, 585, 1113–1120 CrossRef CAS PubMed.
  52. S. A. Hudson, H. Ecroyd, F. C. Dehle, I. F. Musgrave and J. A. Carver, J. Mol. Biol., 2009, 392, 689–700 CrossRef CAS PubMed.
  53. B. M. Austen, K. E. Paleologou, S. A. E. Ali, M. M. Qureshi, D. Allsop and O. M. A. El-Agnaf, Biochemistry, 2008, 47, 1984–1992 CrossRef CAS PubMed.
  54. O. M. A. El-Agnaf, K. E. Paleologou, B. Greer, A. M. Abogrein, J. E. King, S. A. Salem, N. J. Fullwood, F. E. Benson, R. Hewitt, K. J. Ford, F. L. Martin, P. Harriott, M. R. Cookson and D. Allsop, FASEB J., 2004, 18, 1315–1317 CAS.
  55. K. L. Sciarretta, D. J. Gordon and S. C. Meredith, Methods Enzymol., 2006, 413, 273–312 CAS.
  56. M. A. Etienne, J. P. Aucoin, Y. Fu, R. L. McCarley and R. P. Hammer, J. Am. Chem. Soc., 2006, 128, 3522–3523 CrossRef CAS PubMed.
  57. S. Gilead and E. Gazit, Angew. Chem., Int. Ed. Engl., 2004, 43, 4041–4044 CrossRef CAS PubMed.
  58. H.-N. Du, H.-T. Li, F. Zhang, X.-J. Lin, J.-H. Shi, Y.-H. Shi, L.-N. Ji, J. Hu, D.-H. Lin and H.-Y. Hu, FEBS Lett., 2006, 580, 3657–3664 CrossRef CAS PubMed.
  59. J. Madine, A. J. Doig and D. A. Middleton, J. Am. Chem. Soc., 2008, 130, 7873–7881 CrossRef CAS PubMed.
  60. T. J. Smith, C. I. Stains, S. C. Meyer and I. Ghosh, J. Am. Chem. Soc., 2006, 128, 14456–14457 CrossRef CAS PubMed.
  61. N. H. Andersen, K. N. L. Huggins, M. Bisaglia and L. Bubacco, in Proc. of the 31st European Peptide Symposium, ed. M. Lebl, M. Meldal, K. J. Jensen and H. Jensen, EPS, 2010, pp. 22–23 Search PubMed.
  62. A. Byrne, M. Bisaglia, L. Bubacco and N. H. Andersen, in Proc. of the 31st European Peptide Symposium, ed. G. Kokotos, V. Constantinou and J. Matsoukas, EPS, 2012, pp. 546–547 Search PubMed.
  63. B. L. Kier, I. Shu, L. A. Eidenschink and N. H. Andersen, Proc. Natl. Acad. Sci. U. S. A., 2010, 107, 10466–10471 CrossRef CAS PubMed.
  64. N. H. Andersen, K. A. Olsen, R. M. Fesinmeyer, X. Tan, F. M. Hudson, L. A. Eidenschink and S. R. Farazi, J. Am. Chem. Soc., 2006, 128, 6101–6110 CrossRef CAS PubMed.
  65. L. Eidenschink, B. L. Kier, K. N. L. Huggins and N. H. Andersen, Proteins: Struct., Funct., Bioinf., 2009, 75, 308–322 CrossRef CAS PubMed.
  66. M. Scian, I. Shu, K. A. Olsen, K. Hassam and N. H. Andersen, Biochemistry, 2013, 52, 2556–2564 CrossRef CAS PubMed.
  67. B. L. Kier, J. M. Anderson and N. H. Andersen, J. Am. Chem. Soc., 2014, 136, 741–749 CrossRef CAS PubMed.
  68. J. A. Cohlberg, J. Li, V. N. Uversky and A. L. Fink, Biochemistry, 2002, 41, 1502–1511 CrossRef CAS PubMed.
  69. M. S. Celej, R. Sarroukh, E. Goormaghtigh, G. D. Fidelio, J.-M. Ruysschaert and V. Raussens, Biochem. J., 2012, 443, 719–726 CrossRef CAS PubMed.
  70. L. A. Munishkina, C. Phelan, V. N. Uversky and A. L. Fink, Biochemistry, 2003, 42, 2720–2730 CrossRef CAS PubMed.
  71. T. Antony, W. Hoyer, D. Cherny, G. Heim, T. M. Jovin and V. Subramaniam, J. Biol. Chem., 2003, 278, 3235–3240 CrossRef CAS PubMed.
  72. K. Milowska, M. Malachowska and T. Gabryelak, Int. J. Biol. Macromol., 2011, 48, 742–746 CrossRef CAS PubMed.
  73. W. Hoyer, T. Antony, D. Cherny, G. Heim, T. M. Jovin and V. Subramaniam, J. Mol. Biol., 2002, 322, 383–393 CrossRef CAS.
  74. P. S. Vassar and C. F. Culling, Arch. Pathol., 1959, 68, 487–498 CAS.
  75. H. LeVine, Protein Sci., 1993, 2, 404–410 CrossRef CAS PubMed.
  76. N. Lorenzen, S. B. Nielsen, Y. Yoshimura, B. S. Vad, C. B. Andersen, C. Betzer, J. D. Kaspersen, G. Christiansen, J. S. Pedersen, P. H. Jensen, F. A. A. Mulder and D. E. Otzen, J. Biol. Chem., 2014, 31, 21299–21310 CrossRef PubMed.
  77. G. Hopping, J. Kellock, B. Caughey and V. Daggett, ACS Med. Chem. Lett., 2013, 4, 824–828 CrossRef CAS PubMed.
  78. H. Heise, W. Hoyer, S. Becker, O. C. Andronesi, D. Riedel and M. Baldus, Proc. Natl. Acad. Sci. U. S. A., 2005, 102, 15871–15876 CrossRef CAS PubMed.
  79. M. Chen, M. Margittai, J. Chen and R. Langen, J. Biol. Chem., 2007, 282, 24970–24979 CrossRef CAS PubMed.
  80. M. Vilar, H.-T. Chou, T. Luhrs, S. K. Maji, D. Riek-Loher, R. Verel, G. Manning, H. Stahlberg and R. Riek, Proc. Natl. Acad. Sci. U. S. A., 2008, 105, 8637–8642 CrossRef CAS PubMed.
  81. C. O. Fernandez, W. Hoyer, M. Zweckstetter, E. A. Jares-Erijman, V. Subramaniam, C. Griesinger and T. M. Jovin, EMBO J., 2004, 23, 2039–2046 CrossRef CAS PubMed.
  82. W. Li, N. West, E. Colla, O. Pletnikova, J. C. Troncoso, L. Marsh, T. M. Dawson, P. Jäkälä, T. Hartmann, D. L. Price and M. K. Lee, Proc. Natl. Acad. Sci. U. S. A., 2005, 102, 2162–2167 CrossRef CAS PubMed.
  83. W. Hoyer, D. Cherny, V. Subramaniam and T. M. Jovin, Biochemistry, 2004, 43, 16233–16242 CrossRef CAS PubMed.
  84. R. P. McGlinchey, T. L. Yap and J. C. Lee, Phys. Chem. Chem. Phys., 2011, 13, 20066–20075 RSC.

Footnote

Electronic supplementary information (ESI) available. See DOI: 10.1039/c5ra00325c

This journal is © The Royal Society of Chemistry 2015
Click here to see how this site uses Cookies. View our privacy policy here.