
 Open Access Article
 This Open Access Article is licensed under a
 Creative Commons Attribution 3.0 Unported Licence
Imaging a specific mRNA in pollen with atomic force microscopy†
Jung Sook
Kim‡§
a,
Yu Shin
Park‡
b,
Hong Gil
Nam
*cd and
Joon Won
Park
*a
aDepartment of Chemistry, Pohang University of Science and Technology, Pohang 790–784, Republic of Korea. E-mail: jwpark@postech.ac.kr
bCenter for Core Research Facilities, DGIST, Daegu 711–873, Republic of Korea
cCenter for Plant Aging Research, Institute for Basic Science (IBS), Daegu 711–873, Republic of Korea. E-mail: nam@dgist.ac.kr
dDepartment of New Biology, DGIST, Daegu 711–873, Republic of Korea
First published on 9th February 2015
Abstract
Intracellular localization of RNA is important in regulating various cellular functions. Here, we determined the intracellular localization of the ammonium transporter (AtAMT1;4) mRNA in the sperm cells of Arabidopsis pollen by atomic force microscopy (AFM). The AFM probe was modified with cone-shaped dendron molecules, and an oligonucleotide complementary to the mRNA was attached to the apex. This configuration allowed facile detection of the mRNA within a sectioned pollen cell at the single-molecule level by measuring the mRNA–oligonucleotide interaction force. The AtAMT1;4 mRNA was largely localized in the nucleus rather than the cytosol of the sperm cells.
Introduction
Messenger RNAs (mRNAs) are localized at discrete cellular regions by several transport pathways.1–3 mRNA localization is essential for organizing cellular architecture and function.4 Therefore, unveiling the cellular distribution of localized mRNAs with high resolution is crucial for our understanding of fundamental cellular processes.5,6Several methods have been used to visualize cellular mRNAs. Fluorescence in situ hybridization (FISH) utilizes fluorescently labeled oligonucleotides, proteins, or aptamers to localize mRNAs.7–11 Electron microscopy, such as a scanning electron microscopy (SEM) and transmission electron microscopy (TEM), has also been employed.12–14 However, fine mapping of individual mRNAs within a whole cell has yet to be achieved.4
The atomic force microscope (AFM) has become a powerful tool for bio-imaging. Recent studies have proven the value of AFM for morphological imaging of biological surfaces and for mapping the forces in biological interactions under physiological conditions.15–20 Because AFM has spatial resolution on the nanometer scale, AFM images provide structural information of high lateral resolution that augments the results from the other approaches. Furthermore, interaction forces between biomolecules are detected sensitively, down to a sensitivity of ten piconewtons.21 In our previous study, a newly developed self-assembly process was employed to enhance recognition efficiency and suppress undesirable nonspecific binding during force measurement.22–26 We reported imaging of Pax6 mRNA distribution in mouse brain tissue,23 and more recently, demonstrated its capability to quantify the concentration of hepatitis C virus (HCV) RNA without labeling or amplification.27
In the current work, we investigate the subcellular localization and distribution of AtAMT1;4 mRNA, which encodes an ammonium transporter (AMT),28 in the sperm cells of the model plant Arabidopsis. Ammonium is the main source of nitrogen for plant growth and development. Earlier studies reported that ammonium plays a key role during nitrogen assimilation in plants, and its membrane transport is mediated primarily by the AMT family.29–32 Recently, a pollen-specific high-affinity ammonium transporter of the plasma membrane in a pollen cell, AtAMT1;4, has been characterized.28
Here, we utilized AFM-based mRNA mapping technology to map the AtAMT1;4 mRNA molecules within a whole pollen cell with a spatial resolution of nanometers and with single-molecule mRNA sensitivity. Our initial expectation was that the mRNA would be mostly localized in the cytosol in the vegetative cells to provide ammonia, a nitrogen source, to the pollen cells. However, we found that the mRNA was abundant in the nuclei of sperm cells, where it is not translated.
Methods
Plant materials
Arabidopsis thaliana plant, ecotype Columbia (Col-0) was grown on soil in an environmentally controlled growth room with a 16 h photoperiod of 120 μmol photons per m2 s−1 at 22/18 °C day/night temperature.General information
Silicon nitride AFM probes were purchased from NanoInk, Inc (PEN-0012-03), and a probe type (S-4) of which spring constant is 16 pN nm−1 and tip radius is about 15 nm was used. A silane coupling agent N-(3-(triethoxysilyl)propyl)-O-polyethyleneoxide urethane was purchased from Gelest. All other chemicals are of reagent grade from Sigma-Aldrich. Deionized water was obtained by passing distilled water through a Barnstead E-pure 3-Module system. All water used in RNA experiments was pretreated overnight with diethylpyrocarbonate (0.05% v/v) and subsequently autoclaved. All oligonucleotides were purchased from Samchully Pharm (Korea).Preparation of the AFM tips and substrates
A previously reported method was employed with modifications for preparing the DNA-immobilized AFM probes and silicon wafers.22–24 AFM probes and silicon wafers were treated with N-(triethoxysilylpropyl)-O-polyethylene oxide urethane (TPU) to produce an interlayer with a terminal hydroxyl group. Then, a dendron layer was introduced on the hydroxylated surface via an esterification reaction. A subsequent deprotection step generated a reactive amine group at the apex of the immobilized dendron. The amine group was treated with di(N-succinimidyl) carbonate (DSC), and then the resulting NHS (N-hydroxysuccinimide) group was used for conjugation with the oligonucleotides.Silylation
Substrates and AFM probes were dipped in anhydrous toluene (20 ml) dissolving a TPU, silane coupling agent (0.20 ml), under a nitrogen atmosphere for 4 h. After reaction, the substrates and AFM probes were rinsed with toluene and then put the baking oven for 30 min at 110 °C. The substrates were cleaned by sonication in toluene, toluene–methanol [1![[thin space (1/6-em)]](https://www.rsc.org/images/entities/char_2009.gif) :1 (v/v)], and methanol for 3 min sequentially. The AFM probes were rinsed carefully with toluene and methanol sequentially. Finally, the substrates and AFM probes were placed in a vacuum (30–40 mTorr).
:1 (v/v)], and methanol for 3 min sequentially. The AFM probes were rinsed carefully with toluene and methanol sequentially. Finally, the substrates and AFM probes were placed in a vacuum (30–40 mTorr).
Preparation of 27-acid modified surfaces
The above silylated substrates and AFM probes were dipped for 12–24 h in a methylene chloride solution containing the 27-acid dendron (1.0 mM), a coupling agent, 1,3-dicyclohexylcarbodiimide (DCC) (29.7 mM), and 4-dimethylaminopyridine (DMAP) (2.9 mM). The 27-acid dendron (or 27-acid) used in this research was prepared by ourselves. For the preparation, an extension of the published approach33 was employed, and 27-acid was dissolved in 10 ml of dimethylformamide (DMF) before adding into methylene chloride (90 ml). After the reaction, the substrates were cleaned by sonication in methylene chloride, methanol, and deionized water for 3 min sequentially. The AFM probes were rinsed with methylene chloride, methanol, and water sequentially. Finally, the substrates and AFM probes were placed in a vacuum (30–40 mTorr).Secondary structure of target mRNA and the probe design
The ORF of ammonium transporter AtAMT1;4 mRNA in Arabidopsis consists of 1515 nucleotides and encodes a protein of 504 amino acids (molecular mass of 53.7 kDa). Typically, mRNA folds to form its unique secondary structure, driven by the hybridization of the self-complementary sequences. There is an enhanced hybridizing probability between the mRNA and the probe DNA if the mRNA detection region exists as a single strand. For this reason, the secondary structure of the 1515 nucleotides was simulated for analysis using an available program (http://www.genebee.msu.su/services/rna2_reduced.html). A region of AtAMT1;4 mRNA, RNA sequences 944–977 (5′-AAA GAC UUA UUG AUG GGU AUU GGA AUG UAA CU GA-3′), was selected for the study, and a 34-mer DNA complementary of this region was employed as the DNA probe [5′-NH2(CH2)6-TCA GTT ACA TTC CAA TAC CCA TCA ATA AGT CTT T-3′]. Possible secondary structures of the constructs were presented in Fig. S1.†Immobilization of DNA/isolated short RNA
The NHS-modified substrates were placed in a solution containing 34-mer RNA [20 μM in 25 mM NaHCO3 buffer (pH 8.5) with 5.0 mM MgCl2] for 12 h. In parallel, the NHS-modified AFM probes were placed in a solution of 34-mer DNA [20 μM in 25 mM NaHCO3 buffer (pH 8.5) with 5.0 mM MgCl2] for 12 h. After the reaction, the substrates and AFM probes were placed in a buffer solution [2× SSPE buffer (1× SSPE is 0.18 M NaCl, 10 mM NaH2PO4, and 1 mM EDTA, pH 7.4) containing 7.0 mM sodium dodecyl sulfate] with stirring at 37 °C for 1 h, and were rinsed thoroughly with water to remove non-specifically bound oligonucleotides. Finally, the substrates and AFM probes were dried under vacuum (30–40 mTorr).Synthesis of the 1515-nucleotide cRNA for AtAMT1;4 mRNA
The DNA corresponding to the ORF (open reading frame) of AtAMT1;4 mRNA was amplified by PCR (polymerase chain reaction) from genomic DNA of the Arabidopsis Col-0 using two specific primers, AtAMT-Nter, 5′-ACA ATG GCG TCG GCT CTC TCT TGC TC-3′ and AtAMT-Cter, 5′-AAT CAA ACA CCT ACA TTG GGA TCA TTA-3′. The sequence information on Arabidopsis AtAMT1;4 DNA (At4g28700), which was possible due to the absence of introns, was obtained from a database. This 1515-nucleotide PCR product was cloned into a pGEM-T Easy vector (Promega, USA) and confirmed by sequencing. The resulting pGEM-AtAMT1;4 vector was linearized with Sal I and Aat II and used as a template to synthesize the 1515-nucleotide sense and antisense RNA of AtAMT1;4 mRNA, respectively, performing an in vitro transcription using SP6/T7 transcription kits (Roche Diagnostics, Germany). After transcription, the cDNA template was removed with RNase-free DNase I. The remaining RNA solution was adjusted to 0.4 M LiCl and centrifuged to pellet the precipitated RNA. The final concentration of RNA was quantified by UV spectrometry.Immobilization of the 1515-nucleotide cRNA on a glass slide
The mRNA was dissolved in sodium phosphate buffer (150 mM, pH 7.4) to make a solution of 0.50 μg μl−1. Using a gel loading pipette tip, 1.0 μl of the RNA solution was placed onto a glass slide (ProbeOn Plus, Fisher Scientific, USA) and was allowed to stand at room temperature for 30 min. The drying process led to a spot of 5 mm in diameter. To immobilize the RNA on the glass surface, the slide was heated in an oven at 65 °C for 30 min, and was subsequently irradiated with UV light (120 mJ) for 2 min 40 s with a UV Stratalinker (Stratagene, USA). The RNA-immobilized glass slide was then incubated in a blocking buffer [50% formamide, 10% dextran sulfate, 250 μg ml−1 yeast tRNA, 0.30 M NaCl, 20 mM Tris–HCl (pH 8.0), 5.0 mM EDTA, 10 mM sodium phosphate, 1.0% sarcosyl, 0.10% bovine serum albumin, 0.10% ficoll, and 0.10% polyvinylpyrollidone] at 65 °C for 1 h. The slide was washed by dipping in PBS buffer five times for 10 min each time. Finally, the slide was kept in water for a few seconds before air-drying. For the force measurements, the air-dried slide was again rehydrated in PBS buffer.Preparation of sections of pollen cells on the glass slide using high-pressure freezing methods
Mature pollen grains from flower buds were dissected and placed into a sample carrier with 1-hexadecene and then frozen in a high-pressure freezer (BAL-TEC HPM010, Leica Microsystems). The frozen samples were transferred to a freeze substitution system at −140 °C, and the temperature was raised gradually to −90 °C for 48 h, and then to −60 °C for 8 h with cooled ethanol. After dehydration with ethanol, the samples were infiltrated into LR White-embedding medium (London Resign Company Ltd., UK). The samples in the embedding medium were polymerized in an oven at 55 °C for 24 h. A series of 100–200 nm thick sections of pollen was prepared with an ultra AFM knife (Diatome, USA) and was placed onto glass slides (Nexterion Glass B, Schott Nexterion, Germany) coated with BIOBOND Tissue Section Adhesive (BBInternational, England). The sections were fixed with distilled water, and the slides were heated in an oven at 60 °C for 2 h. Finally, the slides were rinsed with PBS solution prior to AFM analysis. In this experiment, we adopted the sectioning method that has been successfully utilized for in situ detection of proteins and for EM-based detection of mRNA in a cell on the exposed surface of the section. Our sectioning method using by acrylic resins, such as LR White and Lowicryl K4 that provide the hydrophilic environment adequate for hybridization, is described in a few references including the report by Herpers et al.14 In this experiment, we used the LR White resin. The hydrophilic surface of the LR White resin is accessible “without etching and any pretreatment” (Quoted from the LR White manufacturer manuals, London Resin Company Ltd., UK).AFM force measurements
All force measurements were performed with a NanoWizard AFM (JPK Instruments, Germany). The spring constant of each AFM tip was calibrated in solution before each experiment with the built-in program. The spring constant of the cantilevers was between 14 and 25 pN nm−1. All measurements were carried out in fresh DEPC (diethylpyrocarbonate)-treated PBS buffer (pH 7.4) at room temperature. All force measurements were recorded with a tip velocity of 0.54 μm s−1. Force measurements of model systems were as follows: to measure the mean force values, the force–distance curves were recorded at least 100 times at one position on a substrate, and more than five spots were examined in each experiment. Force measurements of a sectioned cell were as follows: force mapping experiments were performed immediately after morphological scanning on the sectioned cell surface. Topographic scanned area was divided into 50 × 50 (2500) pixels. Force maps were obtained by processing the force values recorded during the raster-scanning on areas. Typically force–distance curves were recorded five times at each pixel, and the presented force value of each pixel is the average of the unbinding-force values.AFM imaging on sectioned pollen surface
All AFM images were obtained with a NanoWizard AFM (JPK Instruments, Germany) using intermittent contact mode in a fluid environment [PBS (phosphate buffered saline) buffer, pH 7.4] with 1.0 Hz tip velocity. The scan line was 512.Transmission electron microscopy analysis
To observe the components of pollen, mature pollen grains were dissected and fixed with the high-pressurized liquid nitrogen system in a high-pressure freezer (BAL-TEC HPM010, Leica Microsystems). The pollen samples were post-fixed with 2% osmium tetroxide (OsO4) and were dehydrated with a graded series of ethanol. After dehydration, the pollen samples were infiltrated with propylene oxide twice for 30 min each, and then infiltrated into EMbed-812 embedding medium (Electron Microscopy Science, USA). The samples in the embedding medium were polymerized at 60 °C for 30 h. Pollen sections (70–80 nm thickness) were stained with 2% uranium acetate followed by 2% lead citrate and visualized using a JEOL JEM-1011 transmission electron microscope (JEOL, Tokyo, Japan). Cryofixation of Arabidopsis pollen was performed as previously published34 with some modifications. Briefly, the frozen samples were transferred to a freeze substitution system at −140 °C, and the temperature was raised gradually to −90 °C for 48 h and then to −60 °C for 8 h with cooled acetone.Results and discussion
Force mapping the AtAMT1;4 mRNAs in model systems
 | ||
| Fig. 1 A model system for the detection of AtAMT1;4 mRNA. (A) Schematic drawing of the experimental setup. (B) A typical force–distance curve for the interaction between the DNA probe [5′-NH2(CH2)6-TC AGT TAC ATT CCA ATA CCC ATC AAT AAG TCT TT-3′] and the 34-mer complementary RNA [5′-NH2(CH2)-AA AGA CUU AUU GAU GGG UAU UGG AAU GUA ACU GA-3′]. (C) The histogram of the unbinding-force values. (D) Histograms of the unbinding-force derived from the force–distance curves of the interaction with the non-complementary 34-mer RNA; antisense RNA of AtAMT1;4 [5′-NH2(CH2)6-UC AGU UAC AUU CCA AUA CCC AUC AAU AAG UCU UU-3′]. | ||
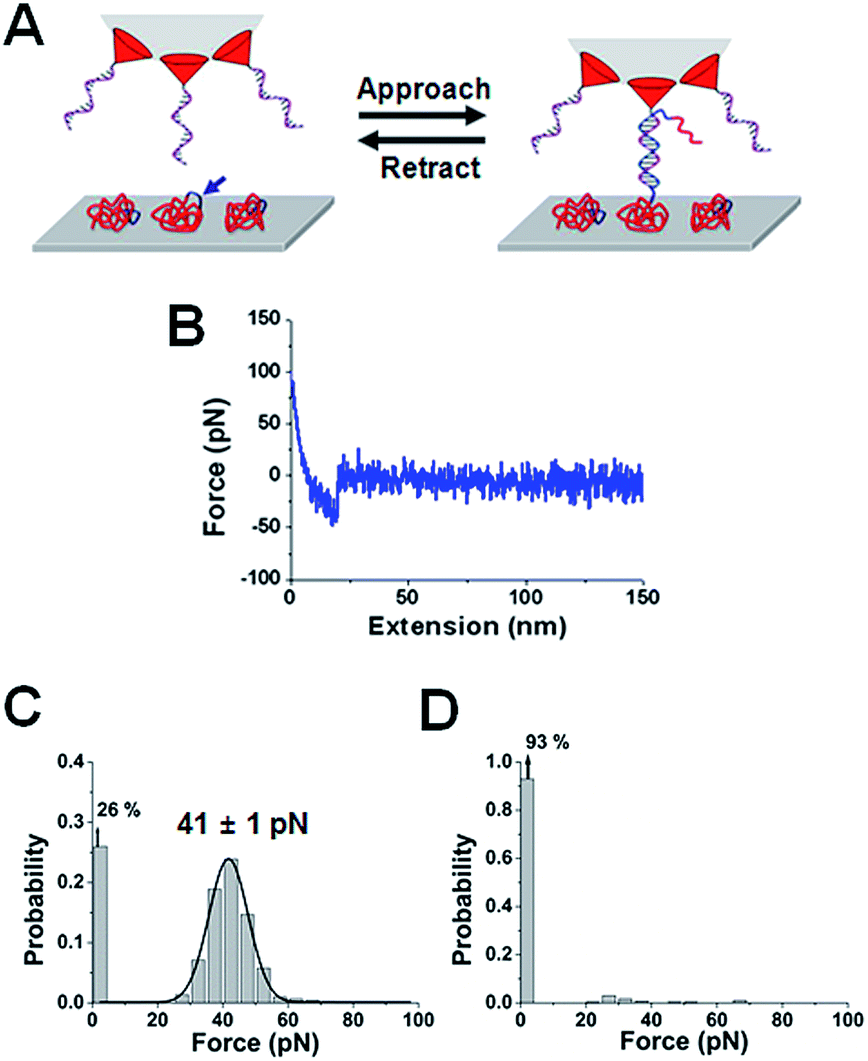 | ||
| Fig. 2 The specific interaction force between in vitro transcribed AtAMT1;4 cRNA and the DNA probe. (A) Schematic diagram of the experimental setup. (B) A force–distance curve showing the single unbinding event. (C) The histogram of the unbinding-force values. (D) The histogram of the unbinding-force values between the DNA probe and the antisense mRNA. | ||
Force mapping the AtAMT1;4 mRNAs on a sectioned pollen
The most probable unbinding-force value in the above model systems was 44 ± 1 and 41 ± 1 pN, respectively, and the measurements showed characteristic stretching distances (the most probable distance of 7 nm and 11 nm, respectively). The unbinding-force was also examined using a model system exposing the RNA on a cross-sectioned surface of an embedded resin, which simulates conditions that are similar to the sectioned pollen surface (ESI, Fig. S2†).To investigate the interaction between the 1515-nucleotide AtAMT1;4 mRNA and the DNA probe on the sectioned pollen surface, 100 force–distance curves were recorded. Fig. S3A† is the force histogram from the specific force curves recorded at a certain position. For curves with multiple events, the force value calculated from the last rupture event was incorporated into the force histogram. Gaussian fitting gave the most probable unbinding-force of 39 ± 1 pN (n = 50/100; σ = 3). The percentage of no event was 50%. Gaussian fitting provided the most probable unbinding-distance value of 16 ± 1 nm (n = 50/100; σ = 2) (Fig. S3B†). Fig. S3C and D† show typical force–distance curves recorded in this experiment. The mapping was performed by measuring the specific unbinding-force between the DNA probe and the complementary part of AtAMT1;4 mRNA (Fig. 3A). The AFM topographic image of the sectioned surface showed the subcellular structure of pollen (Fig. 3C), and the area was divided into 50 × 50 pixels (i.e., 400 nm interval) for the force mapping. Although hundreds measurements were required at each pixel for high accuracy, a compromise strategy recording five force–distance curves at each pixel was taken so that the entire area could be measured in six hours. After the force measurements were complete, an AFM topographic image was obtained again to confirm that the lateral drift was not significant. The mean value of the measured unbinding-force and stretching distance, and the probability of obtaining the specific curves, were used as the criteria for the location of mRNAs in the map.
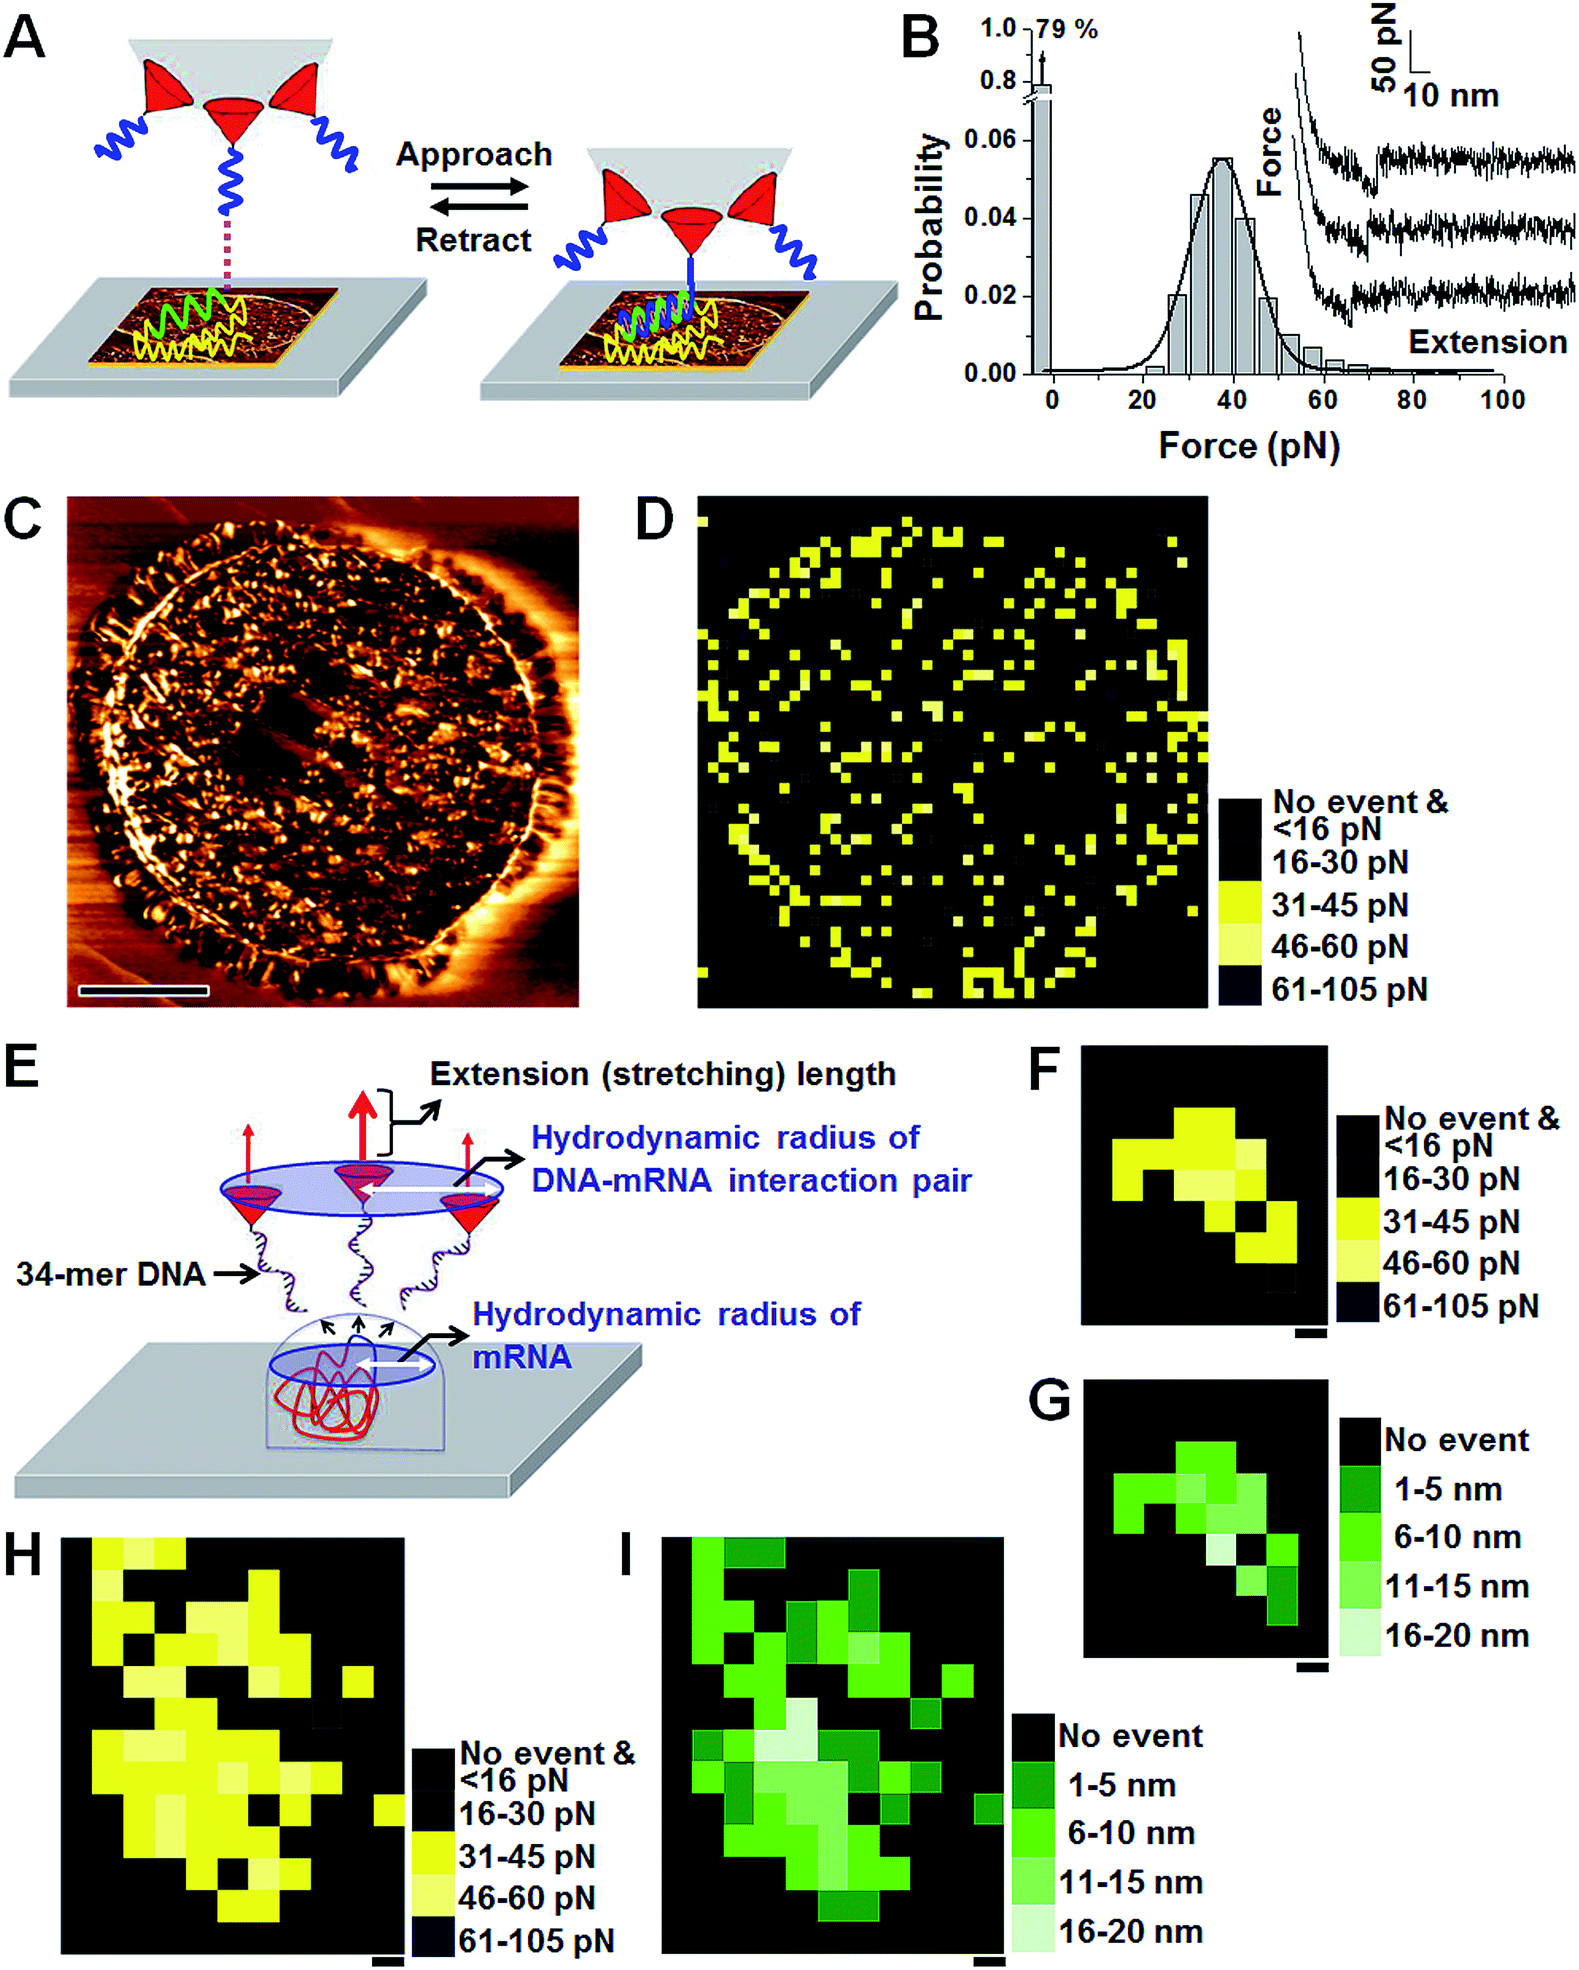 | ||
| Fig. 3 Distribution and hydrodynamic behavior of AtAMT1;4 mRNA. (A–D) Distribution of AtAMT1;4 mRNA in sections of Arabidopsis pollen. Schematic diagram of the experimental setup (A). The unbinding-force histogram and typical force–distance curves (B). AFM topographic image of a sectioned pollen cell scanned by an AFM tip tethering probe DNA (C). Scale bar, 5.0 μm. The force map in the scanned area presented in C (D). (E–I) Hydrodynamic behavior of 1515-nucleotide mRNA on the sectioned pollen cell surface. Scale bars, 5.0 nm. Schematic diagram showing the hydrodynamic radius in the map (E). Force map showing a 25 nm × 30 nm sized cluster (F). The corresponding stretching-distance map (G). Force map showing a bigger-sized cluster in which two clusters are close to each other (H). The corresponding stretching-distance map (I). | ||
To set an appropriate range of the specific force value, a histogram of the force value collected from 2500 pixels (12500 measurements) was obtained (Fig. 3B). A total of 878 specific curves were recorded (most probable force value = 38 pN, standard deviation of the distribution = 7.7), and Gaussian fitting of the mean value from 373 pixels gave the most probable value of 38 pN and σ value of 7 (n = 373). The unbinding-force value of AtAMT1;4 mRNA on the sectioned cell was a few pN smaller than those of the model systems. This reduction had been observed in previous studies, and the difference was believed to be associated with plasticity of the sample surface.35 For mapping purposes, pixels were categorized into five groups. A pixel showing no event was grouped into ‘no event’, and was colored black. A pixel showing one or two nonspecific events was also classified as ‘no event’. A total of 2112 out of 2500 pixels belonged to the ‘no event’ group. A total of 15 pixels showed a linear unbinding profile three to five times and were categorized into the ‘nonspecific’ group and colored black. The remaining 373 pixels (showing at least one specific event and no more than two nonspecific events) were classified into the ‘specific’ group. Pixels in the ‘specific’ group with mean force values between 31 and 45 pN (259 pixels, ±1σ) were colored yellow, pixels with mean force values between 46 and 60 pN (55 pixels) were colored light yellow, and pixels with mean force values between 16 and 30 pN (55 pixels) were colored dark grey. Other pixels with mean force values greater than 60 pN were colored dark navy (4 pixels). The most probable probability of obtaining the specific curves in the yellow pixels was 30% and the most probable stretching distance was 13 ± 2 nm. Although there was a high probability to miss RNAs exposed to the sectioned surface, as the force was measured at 400 nm interval (the lateral displacement of the sample with respect to the AFM tip), the map revealed the approximate distribution of mRNA on a sectioned pollen cell. For example, the areas where black pixels are abundant, notably some areas in the center, must represent domains in which the mRNA is very scarce (Fig. 3D). A few specific pixels were found outside of the sectioned cell, which may be due to contamination during sample preparation or experimental uncertainty. Whereas the background level was not subtracted from each force image, the background level may be useful as a baseline for comparison for other maps obtained in this study.
To understand the hydrodynamic behavior of mRNA exposed on the surface, the curves were obtained at 5.0 nm interval (Fig. 3E–I).36 Given the complexity of mRNA itself and the variations in physical status (i.e., orientation, freedom to move in the medium, and distortion during the sectioning process), a rather broad range of hydrodynamic radii is expected. The high-resolution map showed clusters with diameters ranging from 25 to 40 nm. The size of an isolated cluster was 2530 nm (Fig. 3F and G); the most probable force value and probability of obtaining the specific curves within 16 pixels was 43 ± 1 pN and 49%, respectively. Sometimes, a larger cluster was found (Fig. 3H and I), and it is believed that two clusters were close to each other to make the larger cluster, and the probability was more or less similar to the one described above. Therefore, recording the map at 20 nm intervals should result in a low probability of missing RNA that was accessible to the probe if the curves were recorded five times at each pixel. To detect every mRNA exposed on the surface, it may be necessary to measure the force with an interval of smaller than the hydrodynamic radius, such as 10 nm. Generally, a resolution of 20 or 60 nm was employed in this study due to practical constraints, such as the size of the pollen cell, the subcellular structure, and the limited time window to avoid degradation of mRNA, and lateral drift of AFM. Nevertheless, maps of such resolution are expected to show the RNA distribution pattern in most studies.
Force mapping of specific domains
For accurate high-resolution mapping of mRNA on pollen sections with subcellular components, it is very important that the endogenous structures of all subcellular components were preserved during the cutting and fixation process. Therefore, pollen cell sections were prepared by high-pressure freezing methods (for details, see Methods). As shown in Fig. 4A, the sperm cell nucleus and cytoplasm maintain their structures in an AFM topographic image, which is further verified by TEM analysis. These cell sections were employed for high-resolution mapping of subcellular components. An interval of 60 nm was employed to examine the whole sperm cell (Fig. 4B, right two images), and the 20 nm interval (Fig. 4C, right two images) provided greater detail for visualizing the nuclear membrane. Both maps showed that the mRNA was highly expressed inside the sperm nucleus, and was less abundant in the cytoplasm. There were 208 yellow pixels within the sperm nucleus (71 per 1.0 μm2), whereas there were 41 yellow pixels in the cytoplasm of the sperm cell (16 per 1.0 μm2). Thus, the relative surface concentration of the mRNA in the nucleus is approximately four times higher than in the cytoplasm in the sperm cell.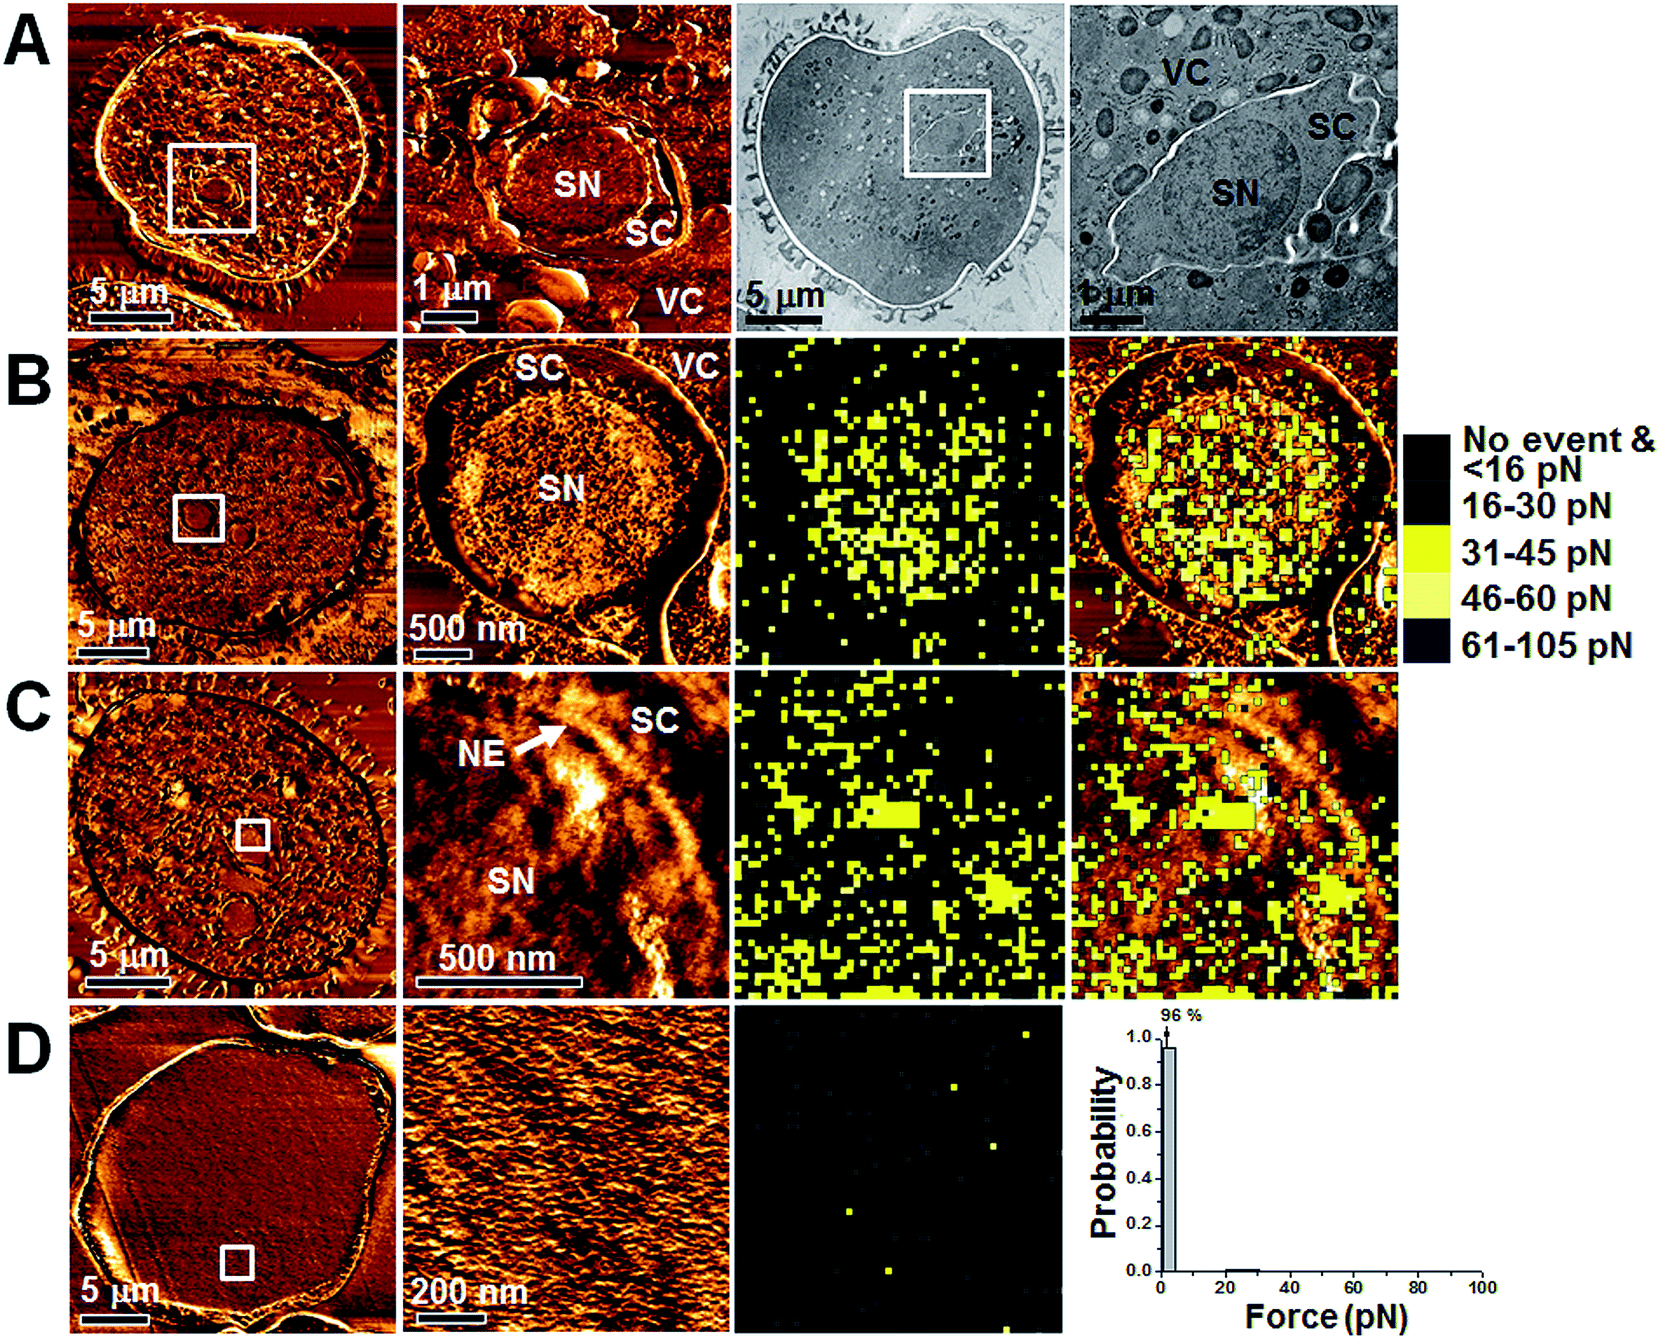 | ||
| Fig. 4 AFM topographic images and force maps of AtAMT1;4 mRNA at higher resolutions in Arabidopsis pollen sections. (A) AFM topographic images in LR White-embedding medium (left two panels) and TEM images in EMbed-812 embedding medium (right two panels) of sections of Arabidopsis pollen prepared with high-pressure freezing. Higher magnifications of sperm cells indicated by white boxes are shown on the right side of the respective images. (B–D) Images in the first column are low-resolution topographic images of pollen sections (B and C) and a petal cell section (D). White boxes represent the scanned area for force mapping and enhanced topographic images. Force maps in the third column use the same grouping and colouring as in Fig. 3. Figures in the fourth column of B and C are generated by overlapping the AFM topographic image and the force map. AFM topographic images and force maps in 3.0 μm × 3.0 μm sections of an entire sperm cell (60 nm interval) (B). AFM topographic images and force maps in a 1.0 μm × 1.0 μm area (20 nm interval) (C). AFM topographic images, force maps, and force distributions in a petal cell section from the control experiment (20 nm interval) (D). Abbreviations: SN, sperm cell nucleus; SC, sperm cell cytoplasm; VC, vegetative cell cytoplasm; NE, nuclear envelope. | ||
Control experiments were performed and confirmed the validity of these results. The probability of observing a specific interaction was dramatically reduced when the surface was blocked with antisense mRNA before AFM imaging and when the surface was treated with RNase (Fig. S4†). The antisense blocking and RNase treatment reduced the pixel number of specific event from 27% to 4% and 8%, respectively, of the sample measured for a same area. The most probable force value (24 pN for blocking with the antisense RNA and 25 pN for treating with RNase) was lower than the standard force value (38 pN). Additionally, the probability of a specific interaction was very low in petal cell sections (Fig. 4D). As shown in the force map in the figure, the probability of the unbinding event was insignificant even without the treatment of RNase or the antisense RNA.
Conclusions
Compared to the conventional mapping technologies such as confocal microscopy, the method we presented shows superior lateral resolution due to the inherent characteristics of AFM. Furthermore, this AFM method does not require any specific labeling procedure. Due to the high sensitivity of AFM force mapping, this method allows localization of single mRNAs, not requiring any amplification step. Detecting local distribution of RNA is becoming one of the key issues in understanding cellular function of RNA. Although we demonstrated the utility of this method in plant pollen cells, we argue that this method should be facilely applicable to most cells, provided that a high quality section can be achieved. We believe that direct mechanical measurement of individual mRNAs would provide much reliable and sensitive detection of mRNA than the hybridization based detection, as the former confirms the identity of an analyte through valuable observables (force value, stretching distance, and cluster radius) and the latter lacks such virtues and is inherently prone to background noise. Nevertheless, influence of the secondary structure of chosen RNA sequence should be studied further, because the structure is one of the key factors determining the kinetic and thermodynamic behaviors of the interaction between the sequence and the probe DNA on the AFM probe. Because ribosomes associated with the RNA may deter the above interaction, impact of such proteins should be unveiled. While we demonstrated application of this method for an mRNA, we believe that this method can be applied for imaging other non-coding cellular RNAs. This method thus should provide a new leap in RNA biology with facile and efficient RNA imaging capability at the intracellular level and open a new window to understand the function and behavior of RNA molecules for organizing cellular architecture and function.Acknowledgements
J.W.P. acknowledges financial support from the Brain Korea 21 Program. H.G.N. acknowledges financial support from the National Research Foundation of Korea through the National Honor Scientist Support Program (no. 2010-0020417), and from the Research Center Program (CA1208) of Institute for Basic Science (IBS) (IBS-R013-D1-2015-a00), Republic of Korea. The authors thank K. H. Suh, Y. S. Park, and B. H. Kim for preparing plants.References
- R. P. Jansen, Nat. Rev. Mol. Cell Biol., 2001, 2, 247–256 CrossRef CAS PubMed.
- I. M. Palacios and D. S. T. Johnston, Annu. Rev. Cell Dev. Biol., 2001, 17, 569–614 CrossRef CAS PubMed.
- M. Kloc, N. R. Zearfoss and L. D. Etkin, Cell, 2002, 108, 533–544 CrossRef CAS PubMed.
- E. Lécuyer, H. Yoshida, N. Parthasarathy, C. Alm, T. Babak, T. Cerovina, T. R. Hughes, P. Tomancak and H. M. Krause, Cell, 2007, 131, 174–187 CrossRef PubMed.
- T. W. Okita and S. B. Choi, Curr. Opin. Plant Biol., 2002, 5, 553–559 CrossRef CAS PubMed.
- K. C. Martin and A. Ephrussi, Cell, 2009, 136, 719–730 CrossRef CAS PubMed.
- A. J. Rodriguez, J. Condeelis, R. H. Singer and J. B. Dictenberg, Semin. Cell Dev. Biol., 2007, 18, 202–208 CrossRef CAS PubMed.
- A. Raj, P. van den Bogaard, S. A. Rifkin, A. van Oudenaarden and S. Tyagi, Nat. Methods, 2008, 5, 877–879 CrossRef CAS PubMed.
- S. Tyagi, Nat. Methods, 2009, 6, 331–338 CrossRef CAS PubMed.
- P. J. Santangelo, A. W. Lifland, P. Curt, Y. Sasaki, G. J. Bassell, M. E. Lindquist and J. E. Crowe, Nat. Methods, 2009, 6, 347–349 CrossRef CAS PubMed.
- T. Lionnet, K. Czaplinski, X. Darzacq, Y. Shav-Tal, A. L. Wells, J. A. Chao, H. Y. Park, V. de Turris, M. Lopez-Jones and R. H. Singer, Nat. Methods, 2011, 8, 165–170 CrossRef CAS PubMed.
- S. Kitazawa and R. Kitazawa, J. Struct. Biol., 2006, 153, 64–72 CrossRef CAS PubMed.
- B. Pyhtila, T. Zheng, P. J. Lager, J. D. Keene, M. C. Reedy and C. V. Nicchitta, RNA, 2008, 14, 445–453 CrossRef CAS PubMed.
- B. Herpers, D. Xanthakis and C. Rabouille, Nat. Protoc., 2010, 5, 678–687 CrossRef CAS PubMed.
- V. Dupres, F. D. Menozzi, C. Locht, B. H. Clare, N. L. Abbott, S. Cuenot, C. Bompard, D. Raze and Y. F. Dufrêne, Nat. Methods, 2005, 2, 515–520 CrossRef CAS PubMed.
- P. Hinterdorfer and Y. F. Dufrêne, Nat. Methods, 2006, 3, 347–355 CrossRef CAS PubMed.
- G. Francius, S. Lebeer, D. Alsteens, L. Wildling, H. J. Gruber, P. Hols, S. De Keersmaecker, J. Vanderleyden and Y. F. Dufrêne, ACS Nano, 2008, 2, 1921–1929 CrossRef CAS PubMed.
- V. Dupres, D. Alsteens, S. Wilk, B. Hansen, J. J. Heinisch and Y. F. Dufrêne, Nat. Chem. Biol., 2009, 5, 857–862 CrossRef CAS PubMed.
- N. de Souza, Nat. Methods, 2012, 9, 873–877 CrossRef CAS PubMed.
- S. Husale, H. H. J. Persson and O. Sahin, Nature, 2009, 462, 1075–1078 CrossRef CAS PubMed.
- K. C. Neuman and A. Nagy, Nat. Methods, 2008, 5, 491–505 CrossRef CAS PubMed.
- Y. J. Jung, B. J. Hong, W. Zhang, S. J. Tendler, P. M. Williams, S. Allen and J. W. Park, J. Am. Chem. Soc., 2007, 129, 9349–9355 CrossRef CAS PubMed.
- Y. J. Jung, Y. S. Park, K. J. Yoon, Y. Y. Kong, J. W. Park and H. G. Nam, Nucleic Acids Res., 2009, 37, e10 CrossRef PubMed.
- J. S. Kim, Y. J. Jung, J. W. Park, A. D. Shaller, W. Wan and A. D. Q. Li, Adv. Mater., 2009, 21, 786–789 CrossRef CAS.
- D. Roy, S. H. Kwon, J. W. Kwak and J. W. Park, Anal. Chem., 2010, 82, 5189–5194 CrossRef CAS PubMed.
- I. H. Kim, M. N. Lee, S. H. Ryu and J. W. Park, Anal. Chem., 2011, 83, 1500–1503 CrossRef CAS PubMed.
- Y. J. Jung, J. A. Albrecht, J. W. Kwak and J. W. Park, Nucleic Acids Res., 2012, 40, 11728–11736 CrossRef CAS PubMed.
- L. Yuan, L. Graff, D. Loqué, S. Kojima, Y. N. Tsuchiya, H. Takahashi and N. von Wirén, Plant Cell Physiol., 2009, 50, 13–25 CrossRef CAS PubMed.
- N. von Wirén and M. Merrick, Top. Curr. Genet., 2004, 9, 95–120 Search PubMed.
- S. Khademi, J. O'Connell, J. Remis, Y. Robles-Colmenares, L. J. W. Miercke and R. M. Stroud, Science, 2004, 305, 1587–1594 CrossRef CAS PubMed.
- M. Mayer and U. Ludewig, Plant Biol., 2006, 8, 522–528 CrossRef CAS PubMed.
- L. Yuan, D. Loqué, S. Kojima, S. Rauch, K. Ishiyama, E. Inoue, H. Takahashi and N. von Wirén, Plant Cell, 2007, 19, 2636–2652 CrossRef CAS PubMed.
- R. K. Cheedarala, V. Sunkara and J. W. Park, Synth. Commun., 2009, 39, 1966–1980 CrossRef CAS.
- Y. Yamamoto, M. Nishimura, I. Hara-Nishimura and T. Noguchi, Plant Cell Physiol., 2003, 44, 1192–1201 CrossRef CAS PubMed.
- Y. Gilbert, M. Deghorain, L. Wang, B. Xu, P. D. Pollheimer, H. J. Gruber, J. Errington, B. Hallet, X. Haulot, C. Verbelen, P. Hols and Y. F. Dufrêne, Nano Lett., 2007, 7, 796–801 CrossRef CAS PubMed.
- Y. Lee, S. H. Kwon, Y. Kim, J.-B. Lee and J. W. Park, Anal. Chem., 2013, 85, 4045–4050 CrossRef CAS PubMed.
Footnotes |
| † Electronic supplementary information (ESI) available. See DOI: 10.1039/c5ra00199d |
| ‡ These authors contributed equally to this work. |
| § Present address: Samsung Electronics, Hwasung, Gyeonggi 445–701, Republic of Korea. |
| This journal is © The Royal Society of Chemistry 2015 |