DOI:
10.1039/C5RA00139K
(Paper)
RSC Adv., 2015,
5, 14584-14591
Electromagnetic wave absorption and dielectric-modulation of metallic perovskite lanthanum nickel oxide†
Received
5th January 2015
, Accepted 22nd January 2015
First published on 22nd January 2015
Abstract
Electromagnetic (EM) wave absorption properties of metallic perovskite lanthanum nickel oxide (LNO) powder and dielectric-modulated LNO–FeCo/C composites were investigated. Reflection loss (RL) of the LNO–paraffin composites depends on the mass ratio of LNO powder dispersion in the paraffin matrix, in which the optimal RL of −24.7 dB at 17.6 GHz with the absorbent layer thickness of 1.6 mm is obtained at the 10 wt% LNO–paraffin composite, just below the percolation threshold (PC) of the LNO dispersion in the paraffin matrix. Three absorption peaks in the frequency dependence of RL of the 10 wt% LNO–paraffin composite are ascribed to the dielectric relaxations which occurred at frequencies of about 3.3, 9.2 and 15.1 GHz. Dielectric-modulation by metal-conductive LNO powder significantly increases the relative complex permittivity of the (x)LNO–(y)FeCo/C–paraffin composites and a good impedance match coming from the dielectric-modulation by the LNO powder would be obtained just below the PC of the LNO powder dispersion in the paraffin matrix. The (8 wt%)LNO–(32 wt%)FeCo/C–paraffin composite exhibited an enhanced EM wave absorption performance, in which RL values less than −20 dB can be obtained in the 2–18 GHz range by choosing an appropriate thickness from 1.3 mm to 8 mm and the minimum RL is −50.6 dB at 9 GHz with the absorbent layer thickness of 2.4 mm.
Introduction
In recent years, significant efforts have been focused on the study of various electromagnetic (EM) wave absorbent's applications in Ultra High Frequency (UHF) and Super High Frequency (SHF) bands to avoid EM interference and information leakage due to the rapid development of wireless communications and high frequency circuit devices in the gigahertz range. An excellent microwave absorption material is required to cover a wide frequency range, have low density and be thin. The most commonly used method to broaden the absorption frequency range and enhance the EM wave absorption ability is to fabricate composite magnetic/dielectric materials.1 The magnetic-core/dielectric-shell structured nanocomposites are especially promising.2,3 Among the magnetic components, metallic soft-magnetic nanoparticles/nanocapsules have been particularly focused on, because they have a high saturation magnetization and their Snoek's limit is at a gigahertz frequency level.2 Since its size is smaller than the skin depth, the eddy current effect is capable to be reduced, holding a high relative complex permeability of the magnet at high frequencies. In the dielectric counterparts, ferrite, carbon-related materials, ZnO, Al2O3, SiO2 and ABO3-type dielectric perovskite oxides, such as BaTiO3 (BTO), PbTiO3 (PTO) and BiFeO3 (BFO), have been paid attention to for their high relative permittivity in the GHz frequency range.3–8 Good EM impedance match and efficient complementarity between the relative permittivity and permeability can be realized owing to the synergistic effect of the magnetic and the dielectric compositions.2,3,9–11
As we all know, good conductors of electricity reflect microwave due to free electrons on the metallic surface resulting in microwave reflection instead of being absorbed. However, in an electromagnetic field, the Maxwell–Wagner polarization (or “space charge polarization”) is often induced by an electrical potential resulting from internal charge build-ups at the interface in a heterogeneous material consisting of conductive particles separated by insulating barriers, which contributes to dielectric loss.12 Some literatures have involved the metal–microwave interaction to convert microwave energy to heat.13,14 Small arcs created between isolated metal particles and/or two irregular points of metal are similar to an electrostatic discharge, which may be considered as hot spots or plasmas at a microscopic level. The urchin like nickel chains exhibit an excellent EM wave absorption property, which has been attributed to dielectric loss, magnetic loss, geometrical effect, point discharge effect and multiple absorption.15 However, it is very difficult to clarify to what extent the point discharge effect dissipate EM microwave due to much mixing effects.15 On the other hand, for the metal-based composites, the mass ratio of fillers may significantly influence the electrical conduction mechanisms in composite systems comprising an intricate network of conducting particles and insulating matrix by percolation in a continuous conducting network and/or tunnelling between isolated conducting particles.16 It is of particular interest to investigate the question if electrically-conductive powder with weak relative complex permeability would be used to obtain excellent EM absorption properties. By comparison with metal nanoparticles, which are hardly usable by themselves since a tendency of oxidation to form oxide shells on their surfaces,11 metallic conducting oxides are chemically stable against environmental degradation. Perovskite-type LaNiO3 attracted considerable interest for its unique physical properties for the metallic ground state.17 Various applications of LaNiO3 have been studied, for example, the catalysts for exhaust gas clean18 and carbon nanotubes,19 electrodes for fuel cells at high temperatures20 and improving the fatigue property of ferroelectric perovskite films.21,22 Thin LaNiO3 electrode layer was also capable to transform EM wave irradiation to thermal energy.23 In the present work, excellent EM wave absorption of LNO powder strongly depends on the mass ratio of LNO powder in paraffin matrix, which can be attributed to arc discharge effect just below the percolation threshold (PC) of the LNO in paraffin matrix. Metal-conductive LNO powder significantly increases the relative complex permittivity of the (x)LNO–(y)FeCo/C–paraffin composites and good impedance match coming from the dielectric-modulation by LNO powder can be obtained just below the PC value.
Experimental
Lanthanum nickel oxide (LNO) powder was fabricated by the sol–gel method with La(NO3)3·6H2O and Ni(CH3COOH)2·4H2O as the starting materials, while 2-methoxyethanaol (C3H8O2) and monoethanolamine (MEA, C2H7NO) were used as the solvents (mixed with a volume ratio of 9![[thin space (1/6-em)]](https://www.rsc.org/images/entities/char_2009.gif) :1).24 Nickel acetate and lanthanum nitrate were respectively dissolved in 20 ml mixed solvent at room temperature. The two solutions were mixed together with constant magnetic stirring. As a result, a transparent blue LNO precursor solution of 0.15 M concentration was obtained and used for powder preparation after aging for 24 h. LNO sol was dried at 120 °C under air atmosphere to obtain dried gel. The grounded LNO gel powder was heated at 700 °C for 2 hours for crystallization. FeCo/C nanocapsules were prepared by an arc-discharge method as described elsewhere.2 Morphology and microstructure of the perovskite LNO powder were characterized by a high-resolution transmission electron microscopy (TEM) and selected area electron diffraction (SAED), scanning electron microscopy (SEM) with energy dispersive X-ray analyzer spectrum (EDX) and X-ray diffraction (XRD). LNO pellets were obtained by compacting the as-prepared LNO powder in a diameter of 10 mm by using a 1.2 GPa axial pressure with a steel die and sintered at 700 °C in air for 2 hours. Temperature-dependent resistivity measurement was performed on bars cut from a sintered LNO pellet by the four-probe method using a physical property measurement system (PPMS) with silver paint as the contact. AC conductivity of the LNO–paraffin composites as a function of mass ratio of LNO filler was measured at room temperature in the PPMS. The samples for the measurements of EM parameters were prepared by uniformly mixing the LNO powders with paraffin and then shaping them into toroids with an outer diameter of 7.00 mm, an inner diameter of 3.04 mm, and a thickness of 2 mm. The paraffin with melting point of 60–62 °C was selected as the matrix of EM absorber because it is helpful for easily preparing a uniformly mixed specimen and is transparent for EM waves. The microwave absorption properties dependent on the mass ratio of LNO powder were investigated and the mass ratios of LNO powder in the LNO–paraffin composites were 5 wt%, 8 wt%, 10 wt%, 15 wt%, 20 wt%, 30 wt%, 40 wt% and 50 wt%, respectively. To study the dielectric-modulation effect of conductive LNO powder on the microwave absorption properties of magnetic FeCo/C nanocapsules, both the FeCo/C–paraffin composite and the (x)LNO–(y)FeCo/C–paraffin composites were prepared. Fig. S1a (ESI†) shows a typical SEM image of a LNO–FeCo/C composite powder. Composition elements in the LNO–FeCo/C composite powder were examined by the EDX spectrum as shown in Fig. S1b (ESI†). The specimens of (x)LNO–(y)FeCo/C–paraffin composites were prepared by a uniform distribution of (x)LNO–(y)FeCo/C fillers in the melted paraffin under stirring and the mass fraction ratio of x:y was set to be 8 wt%:32 wt%, 20 wt%:20 wt% and 32 wt%:8 wt%, respectively. For comparison, the mass ratio of FeCo/C nanocapsules in the FeCo/C–paraffin composite was set to be 32 wt%.
:1).24 Nickel acetate and lanthanum nitrate were respectively dissolved in 20 ml mixed solvent at room temperature. The two solutions were mixed together with constant magnetic stirring. As a result, a transparent blue LNO precursor solution of 0.15 M concentration was obtained and used for powder preparation after aging for 24 h. LNO sol was dried at 120 °C under air atmosphere to obtain dried gel. The grounded LNO gel powder was heated at 700 °C for 2 hours for crystallization. FeCo/C nanocapsules were prepared by an arc-discharge method as described elsewhere.2 Morphology and microstructure of the perovskite LNO powder were characterized by a high-resolution transmission electron microscopy (TEM) and selected area electron diffraction (SAED), scanning electron microscopy (SEM) with energy dispersive X-ray analyzer spectrum (EDX) and X-ray diffraction (XRD). LNO pellets were obtained by compacting the as-prepared LNO powder in a diameter of 10 mm by using a 1.2 GPa axial pressure with a steel die and sintered at 700 °C in air for 2 hours. Temperature-dependent resistivity measurement was performed on bars cut from a sintered LNO pellet by the four-probe method using a physical property measurement system (PPMS) with silver paint as the contact. AC conductivity of the LNO–paraffin composites as a function of mass ratio of LNO filler was measured at room temperature in the PPMS. The samples for the measurements of EM parameters were prepared by uniformly mixing the LNO powders with paraffin and then shaping them into toroids with an outer diameter of 7.00 mm, an inner diameter of 3.04 mm, and a thickness of 2 mm. The paraffin with melting point of 60–62 °C was selected as the matrix of EM absorber because it is helpful for easily preparing a uniformly mixed specimen and is transparent for EM waves. The microwave absorption properties dependent on the mass ratio of LNO powder were investigated and the mass ratios of LNO powder in the LNO–paraffin composites were 5 wt%, 8 wt%, 10 wt%, 15 wt%, 20 wt%, 30 wt%, 40 wt% and 50 wt%, respectively. To study the dielectric-modulation effect of conductive LNO powder on the microwave absorption properties of magnetic FeCo/C nanocapsules, both the FeCo/C–paraffin composite and the (x)LNO–(y)FeCo/C–paraffin composites were prepared. Fig. S1a (ESI†) shows a typical SEM image of a LNO–FeCo/C composite powder. Composition elements in the LNO–FeCo/C composite powder were examined by the EDX spectrum as shown in Fig. S1b (ESI†). The specimens of (x)LNO–(y)FeCo/C–paraffin composites were prepared by a uniform distribution of (x)LNO–(y)FeCo/C fillers in the melted paraffin under stirring and the mass fraction ratio of x:y was set to be 8 wt%:32 wt%, 20 wt%:20 wt% and 32 wt%:8 wt%, respectively. For comparison, the mass ratio of FeCo/C nanocapsules in the FeCo/C–paraffin composite was set to be 32 wt%.
Coaxial method was used to determine the EM parameters of the toroidal composites in the frequency range of 1–18 GHz using an Agilent 8722ES vector network analyzer (VNA) with a transverse EM mode. The complex permittivity and complex permeability were extracted from the two-port S parameters tested by the calibrated VNA, using a simulation program for the reflection/transmission Mu and epsilon (Nicholson–Ross–Weir model).9,10 According to the transmission line model, the RLs of the composites were calculated from the εr and the μr as following:9,10,25
| |
 | (1) |
where
f is the EM wave frequency,
d the thickness of the sample,
c the velocity of light,
Z0 the impedance of free space and
Zin the input impedance. The calculation was carried out by the Matlab version 7.6.0 R2008a.
Results and discussion
Fig. 1a shows a typical SEM image with porous characteristics of the LNO powder. Composition elements in the LNO powder and relative atomic ratios of La and Ni were examined by the EDX spectrum as shown in Fig. S2 (ESI†). The EDX analysis is taken on the LNO powder, as shown in Fig. 1a. Excluding the peaks of Si substrate for the sample support and Au for the electrons transport, the La/Ni average molar ratio is 0.97/1 is in good agreement with the composition for the nominal LaNiO3 to the detection limit of the instrument. TEM image in Fig. 1b exhibits agglomerate spherical LNO nanoparticles due to high surface energy of fine particles during the heating process. The high-resolution TEM image shown in the inset of Fig. 1b indicates good crystallization of a LNO nanoparticle with an interplanar distance of 2.8 Å corresponding to the (110) lattice plane. The corresponding SAED pattern was shown in Fig. S3 (ESI†). The XRD pattern in Fig. 1c reveals that the LNO powder is crystallized in a perovskite-structure (PDF#34-1028) without impurities. The temperature dependence of resistivity (ρ) of our sintered LNO pellet in Fig. 2 shows a positive resistivity–temperature coefficient between 16 and 300 K, indicating a typical metallic conductivity above 16 K. The value of ρ(T) at 300 K is 1.9 mΩ cm, comparable with the previously reported for the corresponding bulk material of about 1.8 mΩ cm at 290 K. At higher temperatures (T > 220 K), the ρ(T) follows a linear relation, which is characterized by electron-phonon scattering. Over the temperature range from 220 K to 75 K, the ρ(T) shows an obvious T1.5-dependence as shown in the inset of Fig. 2a. With further decreasing measuring temperature, the ρ(T) exhibits a clear transition at around 16 K (corresponding to the minimum resistivity), demonstrating a change of transport mechanism from metallic to semi-conductive conductivity. Similar metallic conductivity has been reported in the study of LNO specimen,24 where the metallic to semi-conductive transition occurred at about 20 K and the oxygen vacancy was determined to be 0.14. Since the metallic to semi-conductive transition points in the LNO specimens are strongly dependent on the oxygen stoichiometry,17,26,27 the content of the oxygen vacancy in our LNO powder may be estimated to be 0.14 around by comparing the similar transition points of our sintered LNO pellet and the reported LNO specimen.24 The metallic-semi-conductive transition has been ascribed to the weak localization effect with the existence of Ni2+ ions.24,26–28 The Ni2+ ions were created in the LNO material due to the unstable thermodynamic state of the Ni3+ ions, resulting in oxygen vacancy disorder in LNO.17
 |
| | Fig. 1 (a) SEM, (b) TEM images. The inset in (b) is the HRTEM of a LNO nanocrystal. (c) XRD pattern of LNO powder. | |
 |
| | Fig. 2 Temperature dependence of resistivity ρ(T) of a LNO pellet sintered at 700 °C in air for 2 hours. The two insets show (a) a T1.5 dependence of ρ(T) in the temperature range of 75–220 K and (b) a metal-semiconductor transition at around 16 K. | |
LaNiO3 with a stoichiometric ratio is a well Pauli-paramagnetic metallic oxide.29 However, the oxygen vacancy disorder and interaction effects between Ni3+ and Ni2+ ions may influence the magnetic properties of LNO, where a ferromagnetic–paramagnetic transition at 230 K (ref. 29) or weak spin localization/magnetic order frustration below 220 K (ref. 30) have been observed. For the present LNO powder, magnetization curve measured at room temperature shows a magnetization of 0.056 emu g−1 at an applied magnetic field of 5 T, indicating the weak magnetic property of our LNO powder. The relative complex permeability spectra of the LNO–paraffin composites show that the real parts of the μr of the LNO–paraffin composites are around 1 and the imaginary parts are about zero.
The relative complex permittivity spectra of the LNO–paraffin composites, as a function of frequency and mass ratio of LNO powder, were shown in Fig. 3. The values of the real part (ε′) of the complex permittivity in Fig. 3a and the imaginary part (ε′′) of the complex permittivity in Fig. 3b shows small changes below 10 wt%, but a significant increase when the mass ratio of LNO is larger than 15 wt%, which should be ascribed to the percolation effect31–33 due to the change of the conductive behavior of the series of LNO–paraffin composites with the increase of the LNO filler. The drastic change in conductive behavior is clearly shown in Fig. 3c. A considerable finite conductivity was observed in the dielectric regime with the mass ratio ≤10 wt%, where a metal continuum was absent. This conductivity was ascribed to interparticle tunneling.34 With increasing the mass ratio from 10 wt% to 15 wt%, there is a sharp increase of AC conductivity from 10−5 S m−1 to 100 S m−1. The change of 5 orders of magnitude in AC conductivity shows that the PC of the LNO–paraffin composite is just above 10 wt%. It can be seen that ε′ and ε′′ for the 8 wt% and 10 wt% LNO–paraffin composites exhibit significant fluctuations over the 1–18 GHz range. The dielectric resonance behaviors originate from space charge polarization, dipole polarization, ionic polarization and electronic polarization, in which the ionic polarization and electronic polarization take effect at THz and PHz frequency range.35,36 For the metal-based composites, the space charge polarization and the dipole polarization mechanisms could be used to explain the absorption of EM energy by dielectrics, which influence the shape of the permittivity as a function of frequency.37 The lattice defects act a kind of “pinning center”-like behavior and bound charges are induced around the defect positions, resulting in the dipoles.38,39 The fluctuations for ε′ and ε′′ spectra may be ascribed to the displacement current lag40 and to the AC loss.41 It can also be seen in the frequency dependence of dielectric loss factor (tanδe = ε′′/ε′) for the 8 wt% and 10 wt% LNO–paraffin composites in Fig. 3d, where three evident fluctuations at about 3.3, 9.2 and 15.1 GHz are shown, but negligible for the 5 wt% and 15 wt% LNO–paraffin composites. The imaginary part of the relative complex permittivity of a dielectric material can be evaluated by using the equation:42
where
σ is the electric conductivity (S m
−1),
ε0 the free space permittivity (8.854 × 10
−12 F m
−1),
f the frequency (Hz). In general, the electric conductivity for a composite system (comprised of conducting particles and insulating phase) is mainly determined by two factors: a large number of inter-nanostructure Ohmic connections and a nanocapacitance network, where a single capacitor is constituted of two faced nanoparticles. The former effect is related to the concentration of the conducting particles, and becomes dominant above the
PC.
43 The latter is attributed to the very large nanoparticles specific surface area (
A), in which the effective capacitance (
C) lowers the composite characteristic impedance (
Zc) due to
C is proportional to
A.
44 The 8 wt% and 10 wt% LNO–paraffin composites are good agreement with the latter case, where a metal continuum was absent.
 |
| | Fig. 3 Frequency dependence of (a) ε′, (b) ε′′, (c) AC conductivity and (d) tanδe with different mass ratios of LNO in the LNO–paraffin composites. | |
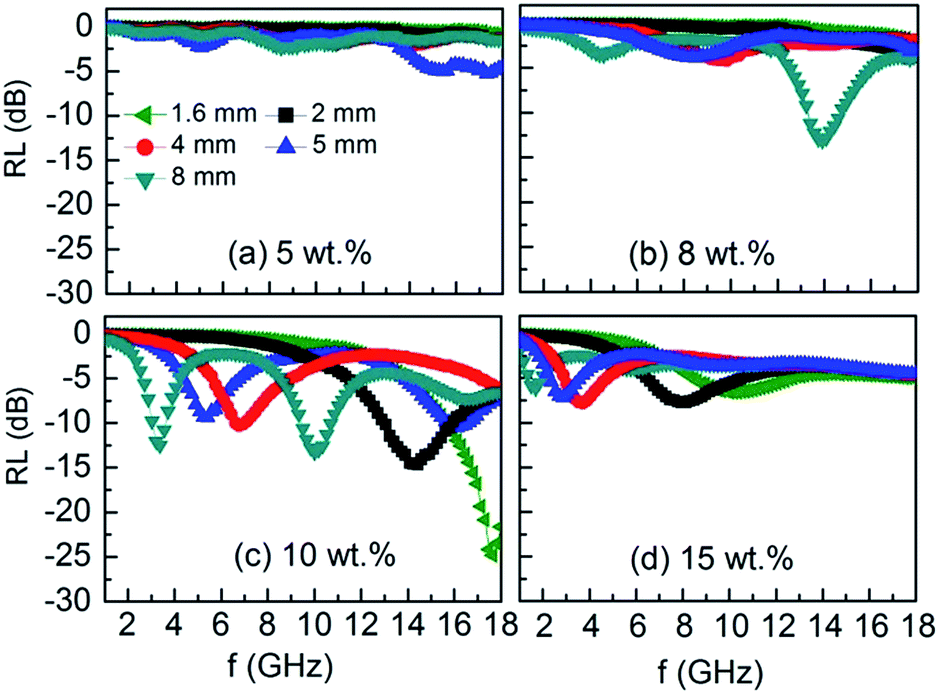
Fig. 4 shows the relation between the RL and the EM wave frequency in the 1–18 GHz range for the LNO–paraffin composites with the LNO mass ratio near to the PC. Our previous work demonstrated that an optimal EM wave absorption performance can be obtained when the mass ratio of the FeCo/CNTs fillers approaches its PC.32 Different from the previous magnetic/dielectric nanocomposite,32 this phenomenon also happens in the present metal-conductive LNO powder–paraffin system. Fig. 4a shows that the 5 wt% LNO–paraffin composite has very poor absorption with RL >−5.5 dB in the 1–18 GHz frequency range due to small LNO loaded in the paraffin matrix. For the 8 wt% LNO–paraffin composite (Fig. 4b), EM wave absorption with RL value of −13 dB can be obtained at a frequency of 14 GHz with an absorbent layer thickness of 8 mm. With increasing the mass ratio just below the PC, from Fig. 4c, one can see that optimal microwave absorption is obtained in the 10 wt% LNO–paraffin composite, where RL reaches −24.7 dB at 17.6 GHz with an absorbent layer thickness of 1.6 mm. It is interesting that multiple absorption bands are observed in the 10 wt% LNO–paraffin composite. For example, triple absorption peaks with RL values of −12.6 dB (at 3.35 GHz), −13.3 dB (at 10.0 GHz) and −7.3 dB (at 16.6 GHz) occur at an absorption layer thickness of 8 mm. Multiple absorption bands may be attributed to the inherent dielectric characteristics of the LNO powder–paraffin composites as discussed above on the dielectric loss. When the mass ratio of LNO filler in the composites is larger than the PC, the amplitude of RL values has a significant decrease and relocation of the peak positions in the RL curves are observed. Fig. 4d shows the weakened EM wave absorption property of the 15 wt% LNO–paraffin composite in the 1–18 GHz frequency range at various absorbent layer thicknesses. It should be noted that the RL peaks shift to low frequency range with increasing the complex permittivity of these LNO–paraffin composites.
 |
| | Fig. 4 Calculated RLs for the LNO powder dispersion in paraffin matrix with the mass ratio of (a) 5 wt%, (b) 8 wt%, (c) 10 wt% and (d) 15 wt%, respectively. | |
Microwave dissipation by conductive materials in microwave irradiation is usually understood from the viewpoint of Ohmic heating induced by an alternating magnetic field,45 in which a material with higher electric conductivity causes higher eddy current.46 The microwave absorption of the LNO–paraffin composites with the mass ratio of LNO fillers larger than the PC should be ascribed to the Ohmic loss mechanism in the materials, similar to the previous study in conductive LaNiO3 films with the film thickness (or particle size) far lower than their skin depth.23 However, the microwave dissipation mechanism for the LNO–paraffin composites with the mass ratio of LNO fillers smaller than the PC is distinct from the Ohmic heating by eddy current effect. In the case without the metal continuum, it is reasonable to assume that the dielectric polarization is partly originated from space charge polarization in a heterogeneous material consisting of conductive LNO powder and insulating paraffin when it is subjected to microwave radiation.12 Fig. 5a shows a schematic representation of the space charge polarization between two isolated conductive particles. The positive charges are displaced toward the microwave electric field and negative charges are shifted in the opposite direction under the influence of dielectric polarization. Field distortions and dielectric loss induced by space charge polarization result in microwave energy being dissipated as heat. Small arcs between isolated metal particles and/or two irregular points of metal are possibly created shown as Fig. 5b, where a sudden flow of electricity between two electrically charged objects would be caused by dielectric breakdown. They may be considered as hot spots or plasmas at a microscopic level to dissipate microwave energy to heat.14
 |
| | Fig. 5 Schematic representation of (a) the space charge polarization and (b) small arcs between two isolated metal particles. | |
EM wave absorption of the dielectric-modulated (x)LNO–(y)FeCo/C–paraffin composites were also investigated. Fig. 6 shows the frequency dependencies of the εr and the μr of the FeCo/C–paraffin and the (x)LNO–(y)FeCo/C–paraffin composites. The real part μ′ values a little decrease with increasing the mass fraction of LNO in the (x)LNO–(y)FeCo/C–paraffin composites due to the weak magnetic properties of LNO powder. The μ′′ of the composites exhibit a slight change around a value between 0.02 and 0.24 in the 1–18 GHz frequency range. It can be seen that the values of μr for the four composites are nearly the same because of small magnetic contribution of LNO powder to them. However, the εr of the (8 wt%)LNO–(32 wt%)FeCo/C–paraffin composite are double of those values for the FeCo/C–paraffin composite due to the dielectric-modulation effect resulting from the LNO component in the composite. With continuously increasing the mass fraction of LNO component in the dielectric-modulated composites, the complex permittivity of the (20 wt%)LNO–(20 wt%)FeCo/C–paraffin and the (32 wt%)LNO–(8 wt%)FeCo/C–paraffin composites show a significant increase due to the percolation of LNO powder in the composites, which accords with high permittivity in many materials due to the contribution of conduction carriers.47,48
 |
| | Fig. 6 Frequency dependence of the relative complex permittivity and the relative complex permeability for the (a) FeCo/C–paraffin, (b) (8 wt%)LNO–(32 wt%)FeCo/C, (c) (20 wt%)LNO–(20 wt%)FeCo/C and (d) (32 wt%)LNO–(8 wt%)FeCo/C–paraffin composites, respectively. | |
Fig. 7 show the frequency dependence of the RLs for the FeCo/C–paraffin and (8 wt%)LNO–(32 wt%)FeCo/C–paraffin composites, respectively. Fig. 7a shows that the RL of the FeCo/C nanocapsules–paraffin composite are smaller than the values in the previous works due to the reduction of the content of FeCo/C nanocapsules in the composite from 50 wt% (ref. 2) or 40 wt% (ref. 4) to the present 32 wt%. Compared with the FeCo/C–paraffin composite, the dielectric-modulated (8 wt%)LNO–(32 wt%)FeCo/C–paraffin composite (Fig. 7b) exhibited the enhanced EM wave absorption performance, in which RL values less than −10 dB can be obtained in a frequency range between 1 and 18 GHz by choosing an appropriate thickness. As exhibited by the three-dimensional representation (Fig. 7c) and two-dimensional contour map (Fig. 7d) of RL for the (8 wt%)LNO–(32 wt%)FeCo/C–paraffin composite, RL values less than −20 dB can be obtained in the 2–18 GHz by choosing an appropriate thickness from 1.3 mm to 8 mm and the best absorption bandwidth of the (8 wt%)LNO–(32 wt%)FeCo/C–paraffin composite with RL values exceeding −10 dB is about 5.2 GHz covering the 12.8–18 GHz frequency range at the absorbent layer thickness of 1.5 mm. The absorption thicknesses (RL < −10 dB) of (8 wt%)LNO–(32 wt%)FeCo/C–paraffin composite are very outstanding, and the minimum RL (RLmin) of −50.6 dB at 9 GHz with the absorbent layer thickness of 2.4 mm is also higher than those reported in the iron–cobalt-based composites or perovskite compounds to date, as listed in Table 1. A RL value of −10 dB corresponds to 90% attenuation of the EM wave, which can be considered as effective absorption in practical applications. The present (8 wt%)LNO–(32 wt%)FeCo/C system possess the minimum RL values among the materials shown in Table 1, which shows great prospects for application in microwave absorption for its broad bandwidth and thin thickness.
 |
| | Fig. 7 Two-dimensional RLs of (a) FeCo/C–paraffin and (b) (8 wt%)LNO–(32 wt%)FeCo/C–paraffin composites. (c) Three-dimensional RLs and (d) contour map for the (8 wt%)LNO–(32 wt%)FeCo/C–paraffin composite. | |
Table 1 EM wave absorption properties of some reported absorbents related to FeCo nanoparticles and perovskite oxides
| Fillers |
Mass ratio wt% |
EM wave absorption properties |
| RLmin dB |
f GHz |
d mm |
Bandwidth GHz, RL <−10 dB |
Ref. |
| BTO/Ni |
70 |
−14.9 |
13.7 |
1.2 |
12.6–15.0 |
49 |
| PbTiO3 |
30 |
−28.6 |
10.8 |
— |
8.0–12.5 |
6 |
| FeCo/Al2O3 |
40 |
−48.7 |
2.8 |
3.8 |
5.0–6.4 |
50 |
| FeCo/C |
30 |
−30.6 |
7.4 |
2 |
6.7–8.2 |
51 |
| FeCo/C |
50 |
−29 |
4.2 |
5 |
3.4–5.5 |
2 |
| FeCo/C/BTO |
40 |
−41.7 |
11.3 |
2 |
9.1–14.5 |
3 |
| LNO |
10 |
−24.7 |
17.6 |
1.6 |
15.8–18 |
This work |
| LNO–FeCo/C |
40 |
−50.6 |
9.0 |
2.4 |
7.6–10.7 |
This work |
Fig. 8 show the frequency dependence of the RLs for the (20 wt%)LNO–(20 wt%)FeCo/C–paraffin and the (32 wt%)LNO–(8 wt%)FeCo/C–paraffin composites. The optimal RL values of (20 wt%)LNO–(20 wt%)FeCo/C–paraffin and (32 wt%)LNO–(8 wt%)FeCo/C–paraffin composites are −13.4 dB at 3.7 GHz with an absorbent layer thickness of 4 mm and −12.8 dB at 4.9 GHz with an absorbent layer thickness of 3 mm, respectively. Compared with the (8 wt%)LNO–(32 wt%)FeCo/C–paraffin composite, the (20 wt%)LNO–(20 wt%)FeCo/C–paraffin and the (32 wt%)LNO–(8 wt%)FeCo/C–paraffin composites possess more LNO filler in them, which contents are much higher than the PC of LNO powder in paraffin matrix. The weakened EM wave absorption performance for the (20 wt%)LNO–(20 wt%)FeCo/C–paraffin and the (32 wt%)LNO–(8 wt%)FeCo/C–paraffin composites should be ascribed to the impedance mismatching. The mass ratios of LNO in (8 wt%)LNO–(32 wt%)FeCo/C–paraffin, (20 wt%)LNO–(20 wt%)FeCo/C–paraffin and (32 wt%)LNO–(8 wt%)FeCo/C–paraffin composites are 8 wt%, 20 wt% and 32 wt%, respectively. It suggests that the improvement of EM wave absorption ability by a dielectric-modulation way is effective in reasonable concentration of metal-conductive particles and the percolation threshold may be the toplimit to balance the impedance matching condition.
 |
| | Fig. 8 Two-dimensional RLs of (a) (20 wt%)LNO–(20 wt%)FeCo/C and (b) (32 wt%)LNO–(8 wt%)FeCo/C–paraffin composites. | |
Conclusions
EM wave absorption properties of the LNO–paraffin composite with various LNO loadings have been investigated, in which an optimal RL value of LNO–paraffin composite with a mass ratio of 10 wt% (just below the PC) is −24.7 dB at 17.6 GHz with the absorbent layer thickness of 1.6 mm. The 10 wt%LNO–paraffin composite shows three absorption peaks due to three dielectric relaxations occurred at the frequency of about 3.3, 9.2 and 15.1 GHz. Dielectric-modulation by LNO powder significantly increases the complex permittivity of the (x)LNO–(y)FeCo/C–paraffin composites. Compared with the (20 wt%)LNO–(20 wt%)FeCo/C–paraffin and (32 wt%)LNO–(8 wt%)FeCo/C–paraffin composites, the (8 wt%)LNO–(32 wt%)FeCo/C–paraffin composite shows an optimal RL of −50.6 dB at 9 GHz with the absorbent layer thickness of 2.4 mm and RL values less than −10 dB can be obtained in 1–18 GHz by choosing an appropriate absorption thickness. The excellent EM wave absorption performance of the (8 wt%)LNO–(32 wt%)FeCo/C–paraffin composite can be ascribed to good impedance match coming from the dielectric-modulation by a reasonable concentration of the metal-conductive component and the percolation threshold of the metal-conductive filler may be the toplimit to obtain good impedance match.
Acknowledgements
The work is supported by the National Natural Science Foundation of China under Grant no. 51171185, no. 51102244, no. 51371055 and by the National Basic Research Program (no. 2012CB933103) of China, Ministry of Science and Technology China.
Notes and references
- L. G. Yan, J. B. Wang, X. H. Han, Y. Ren, Q. F. Liu and F. S. Li, Nanotechnology, 2010, 21, 095708 CrossRef PubMed.
- Z. Han, D. Li, H. Wang, X. G. Liu, J. Li, D. Y. Geng and Z. D. Zhang, Appl. Phys. Lett., 2009, 95, 023114 CrossRef PubMed.
- J. J. Jiang, D. Li, D. Y. Geng, J. An, J. He, W. Liu and Z. D. Zhang, Nanoscale, 2014, 6, 3967–3971 RSC.
- S. M. Abbas, M. Chandra, A. Verma, R. Chatterjee and T. C. Goel, Composites, Part A, 2006, 37, 2148–2154 CrossRef PubMed.
- G. Q. Wang, X. D. Chen, Y. P. Duan and S. H. Liu, J. Alloys Compd., 2008, 454, 340–346 CrossRef CAS PubMed.
- A. Parveen and A. S. Roy, J. Mater. Res., 2013, 28, 840–847 CrossRef CAS.
- Y. Q. Kang, M. S. Cao, J. Yuan and X. L. Shi, Mater. Lett., 2009, 63, 1344–1346 CrossRef CAS PubMed.
- J. Yuan, Z. L. Hou, H. J. Yang, Y. Li, Y. Q. Kang, W. L. Song, H. B. Jin, X. Y. Fang and M. S. Cao, Ceram. Int., 2013, 39, 7241–7246 CrossRef CAS PubMed.
- J. R. Liu, M. Itoh and K. Machida, Appl. Phys. Lett., 2003, 83, 4017–4019 CrossRef CAS PubMed.
- J. R. Liu, M. Itoh and K. Machida, Chem. Lett., 2003, 32, 394–395 CrossRef CAS.
- D. Li, C. J. Choi, Z. Han, X. G. Liu, W. J. Hu, J. Li and Z. D. Zhang, J. Magn. Magn. Mater., 2009, 321, 4081–4085 CrossRef CAS PubMed.
- Z. Yu and C. Ang, J. Appl. Phys., 2002, 91, 794–797 CrossRef CAS PubMed.
- Z. Hussain, K. M. Khan and K. Hussain, J. Anal. Appl. Pyrolysis, 2010, 89, 39–43 CrossRef CAS PubMed.
- J. A. Menéndez, E. J. Juárez-Pérez, E. Ruisánchez, J. M. Bermúdez and A. Arenillas, Carbon, 2011, 49, 346–349 CrossRef PubMed.
- D. Li, W. F. Li, S. Ma and Z. D. Zhang, Phys. Rev. B: Condens. Matter Mater. Phys., 2006, 73, 193402 CrossRef.
- C. Wang, X. J. Han, P. Xu, J. Y. Wang, Y. C. Du, X. H. Wang, W. Qin and T. Zhang, J. Phys. Chem. C, 2010, 114, 3196–3203 CAS.
- L. Qiao and X. F. Bi, EPL, 2011, 93, 57002 CrossRef.
- H. Falcon, R. E. Carbonio and J. L. G. Fierro, J. Catal., 2001, 203, 264–272 CrossRef CAS.
- Q. Jiang, L. J. Song, Y. Zhao, X. Y. Lu, X. T. Zhu, L. Qian, X. M. Ren and Y. D. Cai, Mater. Lett., 2007, 61, 2749–2752 CrossRef CAS PubMed.
- A. Wold, R. J. Arnott and J. B. Goodenough, J. Appl. Phys., 1958, 29, 387–389 CrossRef CAS PubMed.
- G. F. Huang and S. Berger, J. Appl. Phys., 2003, 93, 2855–2860 CrossRef CAS PubMed.
- K. Fukamachi, N. Sakamoto, T. Ohno, D. S. Fu, N. Wakiya, T. Matsuda and H. Suzuki, Jpn. J. Appl. Phys., 2011, 50, 09NA03 CrossRef.
- Y. N. Chen and Z. J. Wang, J. Am. Ceram. Soc., 2013, 96, 90–95 CrossRef CAS PubMed.
- N. Gayathri, A. K. Raychaudhuri, X. Q. Xu, J. L. Peng and R. L. Greene, J. Phys.: Condens. Matter, 1998, 10, 1323–1338 CrossRef CAS.
- E. Michielssen, J. M. Sajer, S. Ranjithan and R. Mittra, IEEE Trans. Microwave Theory Tech., 1993, 41, 1024–1031 CrossRef CAS.
- G. Vovk, X. H. Chen and C. A. Mims, J. Phys. Chem. B, 2005, 109, 2445–2454 CrossRef CAS PubMed.
- S. Mickevicius, S. Grebinskij, V. Bondarenka, B. Vengalis, K. Sliuziene, B. A. Orlowski, V. Osinniy and W. Drube, J. Alloys Compd., 2006, 423, 107–111 CrossRef CAS PubMed.
- L. Qiao and X. F. Bi, Thin Solid Films, 2010, 519, 943–946 CrossRef CAS PubMed.
- T. Moriga, O. Usaka, I. Nakabayashi, T. Kinouchi, S. Kikkawa and F. Kanamaru, Solid State Ionics, 1995, 79, 252–255 CrossRef CAS.
- R. D. Sánchez, M. T. Causa, A. Caneiro, A. Butera, M. Vallet-Regí, M. J. Sayagués, J. González-Calbet, F. García-Sanz and J. Rivas, Phys. Rev. B: Condens. Matter Mater. Phys., 1996, 54, 16574–16578 CrossRef.
- Z. Han, D. Li, X. W. Wang and Z. D. Zhang, J. Appl. Phys., 2011, 109, 07A301 Search PubMed.
- N. Dishovsky and M. Grigorova, Mater. Res. Bull., 2000, 35, 403–409 CrossRef CAS.
- G. Li, T. S. Xie, S. L. Yang, J. H. Jin and J. M. Jiang, J. Phys. Chem. C, 2012, 116, 9196–9201 CAS.
- P. Sheng, B. Abeles and Y. Arie, Phys. Rev. Lett., 1973, 31, 44–47 CrossRef CAS.
- T. Lacrevaz, B. Flechet, A. Farcy, J. Torres, M. Gros-Jean, C. Bermond, T. T. Vo, O. Cueto, B. Blampey, G. Angenieux, J. Piquet and F. de Crecy, Microelectron. Eng., 2006, 83, 2184–2188 CrossRef CAS PubMed.
- R. Ravindran, K. Gangopadhyay, S. Gangopadhyay, N. Mehta and N. Biswas, Appl. Phys. Lett., 2006, 89, 263511 CrossRef PubMed.
- A. Tiwari and K. P. Rajeev, J. Phys.: Condens. Matter, 1999, 11, 3291–3298 CrossRef CAS.
- J. J. Jiang, H. Wang, H. H. Guo, T. Yang, W. S. Tang, D. Li, S. Ma, D. Y. Geng, W. Liu and Z. D. Zhang, Nanoscale Res. Lett., 2012, 7, 238 CrossRef PubMed.
- P. C. P. Watts, W. K. Hsu, A. Barnes and B. Chambers, Adv. Mater., 2003, 15, 600–603 CrossRef CAS.
- P. C. P. Watts, D. R. Ponnampalam, W. K. Hsu, A. Barnes and B. Chambers, Chem. Phys. Lett., 2003, 378, 609–614 CrossRef CAS PubMed.
- Y. J. Li, C. Z. Zhu and C. M. Wang, J. Phys. D: Appl. Phys., 2008, 41, 125303 CrossRef.
- S. Ramo, J. R. Whinnery and T. V. Duzer, Fields and Waves in Communication Electronics, Wiley, New York, 2nd edn, 1984, p. 181 Search PubMed.
- D. Li, D. Y. Geng, Y. T. Xing, W. F. Li, G. W. Qiao, Y. Z. Wang and Z. D. Zhang, J. Mater. Sci., 2005, 40, 1087–1091 CrossRef CAS.
- J. Bisquert, J. Phys. Chem. B, 2002, 106, 325–333 CrossRef CAS.
- J. Lou, C. Hunyar, L. Feher, G. Link, M. Thumm and P. Pozzo, Appl. Phys. Lett., 2004, 84, 5076–5078 CrossRef PubMed.
- Z. P. Cao, Z. J. Wang, N. Yoshikawa and S. Taniguchi, J. Phys. D: Appl. Phys., 2008, 41, 092003 CrossRef.
- A. Chen, Y. Zhi and L. E. Cross, Phys. Rev. B: Condens. Matter Mater. Phys., 2000, 62, 228–236 CrossRef CAS.
- Z. M. Dang, C. W. Nan, D. Xie, Y. H. Zhang and S. C. Tiong, Appl. Phys. Lett., 2004, 85, 97–99 CrossRef CAS PubMed.
- G. Q. Wang, L. X. Ma, Y. F. Chang and C. Liu, Appl. Surf. Sci., 2012, 258, 3962–3966 CrossRef CAS PubMed.
- R. X. Shang, Y. Zhang, L. G. Yan, H. Y. Xia, Q. F. Liu and J. B. Wang, J. Phys. D: Appl. Phys., 2014, 47, 065001 CrossRef.
- C. Wang, R. T. Lv, Z. H. Huang, F. Y. Kang and J. L. Gu, J. Alloys Compd., 2011, 509, 494–498 CrossRef CAS PubMed.
Footnote |
| † Electronic supplementary information (ESI) available. See DOI: 10.1039/c5ra00139k |
|
| This journal is © The Royal Society of Chemistry 2015 |
Click here to see how this site uses Cookies. View our privacy policy here.