Properties modification by eutectic formation in mixtures of ionic liquids

Olga Stolarskaab, Ana Sotoc, Héctor Rodríguezc and Marcin Smiglak*a
aPoznan Science and Technology Park, Adam Mickiewicz University Foundation, ul. Rubiez 46, 61-612 Poznan, Poland. E-mail: marcin.smiglak@gmail.com
bFaculty of Chemistry, Adam Mickiewicz University, ul. Umultowska 89b, Poznan, Poland
cDepartment of Chemical Engineering, University of Santiago de Compostela, Santiago de Compostela, E-15782, Spain

Received 30th December 2014 , Accepted 16th February 2015

First published on 16th February 2015


Abstract

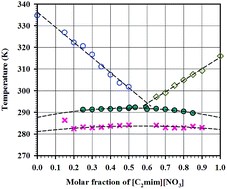
The composition and temperature of three eutectic mixtures were determined at atmospheric pressure in systems resulting from the combination of pairs of ionic liquids where each ionic liquid was constituted by only one type of cation and only one type of anion. In addition, the three pairs investigated had a common ion (either the cation or the anion), thus totalising just three different ions in the resulting mixture. All three eutectic mixtures had a temperature near the ambient one, meaning a decrease of up to ca. 50 K with regard to the melting temperature of the parent ionic liquids. A characterisation of physical properties (density, viscosity, and surface tension) of the eutectic mixtures was carried out, and compared as appropriate with those of the parent compounds.


Introduction

The last decade and a half has witnessed an ever-increasing interest from industry and academia in ionic liquids. Given the very large number of substances that can be classified as ionic liquids, it is hard to generalise any common properties to the entire family of ionic liquids, others than the fact that they conduct electricity (as a result of their ionic nature), or that they are liquid at some temperature below the 373 K established in the definition above.1 Moreover, the judicious combination of cation and anion, and the tailoring of their chemical structures (for example via the number and/or length of alkyl substituents) allows the properties of ionic liquids to be tuned to a considerable extent; thus enabling the design of specific ionic liquids for a particular application.2

Research on ionic liquids to date has mostly focused on what can be called ‘single ionic liquids’; i.e. ionic liquids constituted of one type of cation and one type of anion. However, nothing prevents an ionic liquid medium from being constituted of more than just two types of ions (which could be interpreted as a mixture of single ionic liquids), while integrally keeping its ionic liquid character. In fact, this is one extra degree of tunability to be considered in the ‘design’ of the optimum ionic liquid formulation for a given application, since new sets of properties can be brought beyond those obtainable with single ionic liquids.3–5 The study of mixtures of ionic liquids has gradually increased over the last few years, and so has the number of applications for which they are proposed. In most cases, they are used as improved solvents in different chemical syntheses;4,6,7 but they have also been proposed as gas absorbers, electrolytes for batteries, or stationary phases in gas chromatography, among others.8–11

An important parameter that can be favourably adjusted by the combination of single ionic liquids is their liquid range. If the mixed ionic liquids form a eutectic, then the melting temperature of the resulting mixture will be lower than that of the parent compounds, enabling its use in liquid state over a broader temperature range including lower operation temperatures.5,12 Despite this appealing effect, few articles in the literature have been devoted, to date, to the thermodynamic exploration of eutectic mixtures of ionic liquids;12–15 with a couple of articles investigating the application of binary mixtures of ionic liquids as catalysts or reaction media,16,17 and of melts based on eutectic mixtures of ionic liquids as electrolytes in dye-sensitised solar cells.18,19 The examples reported focus almost exclusively in mixtures of imidazolium-based ionic liquids. A typical strategy in these studies has been to maintain one common ion (either the cation or the anion) in the two components used to form the eutectic.

With the limited number of precedents in the literature, the possibilities of eutectic mixtures of ionic liquids and their characterisation remain largely unveiled. Aiming at getting a deeper knowledge in this regard, herein we report three novel ionic liquid eutectic mixtures, generated from parent ionic liquids with well-defined melting temperatures. In particular, three different mixtures have been chosen in which the parent ionic liquids have one ion in common, hence decreasing the level of complexity of the resulting systems. Namely, the mixtures investigated were: (a) 1-ethyl-3-methylimidazolium hexafluorophosphate ([C2mim][PF6]) + 1-ethyl-3-methylimidazolium nitrate ([C2mim][NO3]); (b) [C2mim][PF6] + 1-ethyl-3-methylimidazolium chloride ([C2mim]Cl); and (c) 1-butyl-3-methylimidazolium chloride ([C4mim]Cl) + [C2mim]Cl. In the first two mixtures, the anions of the parent compounds are different, while they share the same cation ([C2mim]+). In the third mixture, conversely, the two parent ionic liquids are chloride salts with different cations. Following experiments for the determination of the eutectic temperatures and compositions for each system, a characterisation of their thermal stability and of relevant physical properties (namely density, viscosity, and surface tension) has been carried out as a function of temperature, along with the corresponding straight comparison with the properties of the parent ionic liquids when possible (i.e. when liquid at the same temperature).

Results and discussion

Four organic salts with melting points below 373 K at atmospheric pressure were selected, namely: [C2mim][NO3], [C2mim][PF6], [C2mim]Cl, and [C4mim]Cl. Their chemical structures are presented in Table 1. These ionic liquids were combined in binary mixtures in such way that each pair had a common ion. Thus, the mixtures analysed for a potential eutectic behaviour included: (i) [C2mim][PF6] + [C2mim][NO3], (ii) [C2mim][PF6] + [C2mim]Cl, and (iii) [C4mim]Cl + [C2mim]Cl. A fourth mixture, combining the two hydrophilic salts [C2mim][NO3] and [C2mim]Cl, was originally conceived; but unfortunately it was not possible to obtain reliable results for it due to its very hygroscopic character.
Table 1 Chemical structures of the ionic liquids used in this work, their experimentally determined melting temperatures at atmospheric pressure, and comparison with literature dataa
Ionic liquid Chemical structure Melting temperaturea (K)
Exp. Lit.15,20–22
a The experimental data were determined as the maxima of the peak of the melting transition obtained during the second heating cycle in the DSC experiments at the heating rate of 2.5 K min−1. The discrepancies between the experimental and literature values are likely due to the different heating rates used, or to a different strategy of melting point determination (onset vs. peak), and to a different water content of the samples.
[C2mim][PF6] image file: c4ra17268j-u1.tif 335 333
[C2mim][NO3] image file: c4ra17268j-u2.tif 316 312
[C2mim]Cl image file: c4ra17268j-u3.tif 361 370
[C4mim]Cl image file: c4ra17268j-u4.tif 338 343


Determination of eutectics

For each single ionic liquid, first the melting point was determined. The results are reported in Table 1, where an acceptable agreement can be observed with data previously reported by others in the literature. For the different mixtures studied, all observed transitions, as measured by differential scanning calorimetry (DSC), were recorded at various mole fraction compositions, and are presented in the corresponding temperature-composition phase diagrams in Fig. 1 to 3. (The numerical temperature data for these thermal transitions are listed in Tables S1 to S3 in the ESI).
image file: c4ra17268j-f1.tif
Fig. 1 Temperature-composition phase diagram for the system [C2mim][PF6] + [C2mim][NO3]. Legend: -image file: c4ra17268j-u5.tif- melting point of the excess component [C2mim][PF6] in the mixture; -image file: c4ra17268j-u6.tif- melting point of the excess component [C2mim][NO3] in the mixture; -image file: c4ra17268j-u7.tif- eutectic mixture thermal transition; -image file: c4ra17268j-u8.tif- secondary thermal transition observed below the eutectic point transition.

For the system composed of [C2mim][PF6] and [C2mim][NO3] (Fig. 1), with both parent salts having in common the cation [C2mim]+, the sample with the lowest concentration (15 mol%) of [C2mim][NO3] already presented a first sign of eutectic peak at 286 K. Further heating of the sample resulted in observing a crystallisation peak of the excess [C2mim][PF6] and almost immediate melting of [C2mim][PF6] at 327 K (Fig. S1). Something similar was observed for the sample with 20 mol% [C2mim][NO3], with the difference that the eutectic peak melting temperature was recorded at 282 K. For most of the rest of the samples analysed, two phase transitions in the temperature range of or below the eutectic point were recorded (Fig. S1) (with exception of the mixtures of concentrations 50, 55, 60, 85, and 95 mol% [C2mim][NO3], where no additional thermal transition was observed below the eutectic point temperature). For all samples, with observable two phase transitions in the proximity of the eutectic point, the thermograms for the second and third heating cycles looked very similar and included a complex crystallisation from the melt on heating between 233–243 K (with multiple distinguishable peaks), a thermal transition at ca. 283 K, another melting transition at 290–292 K corresponding to the eutectic, and a melting transition for the excess component in the eutectic mixture at a higher temperature. Interestingly, for the samples with compositions between 50–60 mol% [C2mim][NO3], no peak was observed for the first melting transition (ca. 283 K) nor for the excess component. For these samples only the eutectic point transition was recorded (Fig. S1). Even after scaling up of the samples to 1 g, it was not possible to observe any other transitions but the eutectic point. In the samples richer in [C2mim][NO3], the transition observed at the highest temperature corresponded to the melting of the excess component [C2mim][NO3]. By extrapolation of the melting point depression for the excess components, it was calculated that the eutectic point should correspond to a composition of 60.0 mol% [C2mim][NO3] and 40.0 mol% [C2mim][PF6] and the corresponding temperature should be ca. 294 K. Performing the DSC analysis on a new sample composed of 60.0 mol% [C2mim][NO3] and 40.0 mol% [C2mim][PF6], a single melting point transition at a temperature of 292 K was observed, which corresponds to the expected eutectic point (Table 2). It must be mentioned that, for the described system [C2mim][PF6] + [C2mim][NO3], small signals resembling a glass transition also appeared at the low-temperature ends of the heating ramps of the thermograms. However, these signals were very close to the low temperature isotherms of the DSC runs (at the lowest temperature achievable by the apparatus −190 K), and it could not be discriminated whether they corresponded to an actual thermal event of the sample or just to an artefact. Consequently, it was preferred to systematically disregard them.

Table 2 Eutectic temperature and eutectic composition, in a mole basis (x2: mole fraction of IL2) and in a mass basis (w2: mass fraction of IL2), for the binary mixtures of single ionic liquids (IL1 + IL2)
Mixture of ionic liquids Eutectic temperature (K) Eutectic composition
IL1 IL2 x2 w2
[C2mim][PF6] [C2mim][NO3] 292 0.600 0.503
[C2mim][PF6] [C2mim]Cl 312 0.376 0.256
[C4mim]Cl [C2mim]Cl 319 0.513 0.469


Another example of mixture of ionic liquids with common cation and different anions that was explored included [C2mim][PF6] and [C2mim]Cl (Fig. 2). Even though the individual parent salts melt at relatively high temperatures and are less hygroscopic than the [C2mim][NO3] used in the previous example, mixing of those salts in ratios between 25 mol% and 75 mol% [C2mim]Cl resulted in DSC thermograms with only transitions, between 200 K and 220 K, and no thermal transition associated with the melting of any excess component (Fig. S2). Only the thermograms for the samples with [C2mim]Cl content of 0, 10, 15, 20, 25, 75, 90, 95, and 100 mol% gave, besides the glass transitions, observable melting points for the excess component in the mixture. For all these cases the crystallisation of the excess component was observed only during the heating of the sample (Fig. S2). However the evidence of the eutectic peak presence was recorder in the samples with the [C2mim]Cl content of 25 mol% and 55 mol%. The recorded eutectic temperatures in these two cases were 292 K and 298 K respectively. Extrapolating the melting point depression of the parent salts, the eutectic point was estimated at a composition of ca. 37.6 mol% [C2mim]Cl and ca. 62.4 mol% [C2mim][PF6], with the eutectic melting point at ca. 311 K. In order to confirm this estimation, the DSC run of a freshly prepared mixture of the parent compounds with this composition at a scale of 0.5 g was performed. Only in one of three performed experiments it was possible to record the eutectic transition (in the other two runs, thermograms with no visible thermal transitions were obtained, other than glass transitions at ca. 205 K). The difficulty in recording the thermal transitions for this salt mixture is related to the high hygroscopicity of the chloride salt. The results indicated the presence of the eutectic point (Fig. S2) at the temperature 312 K (Table 2). It is also possible, as we were not able to rule it out, that the true eutectic composition of this mixture lie in another specific composition within the broader concentration range 25–55 mol% of ([C2mim]Cl), since this is the range in which melting points for the excess component were not found at all.


image file: c4ra17268j-f2.tif
Fig. 2 Temperature-composition phase diagram for the system [C2mim][PF6] + [C2mim]Cl. Legend: -image file: c4ra17268j-u9.tif- melting point of the excess component [C2mim][PF6] in the mixture; -image file: c4ra17268j-u10.tif- melting point of the excess component [C2mim]Cl in the mixture; -image file: c4ra17268j-u11.tif- eutectic mixture thermal transition; -image file: c4ra17268j-u12.tif- glass transition observed below the eutectic point transition.

For the mixtures of [C4mim]Cl and [C2mim]Cl (Fig. 3) it was very difficult to obtain distinctive melting points in the DSC thermograms. In the samples rich in [C4mim]Cl, this was likely a result of the known tendency of this ionic liquid to particularly form supercooled phases. Instead, all mixtures presented glass transitions in the range 225–233 K (with the exception of pure [C4mim]Cl, which showed a glass transition at 210 K), and only in a few cases single melting transitions were observed that allowed to determine the eutectic point composition. For the samples with concentrations of [C2mim]Cl of 15, 20, 33, 40, 50 and 85 mol%, a eutectic peak was observed between ca. 305 K and 318 K (Fig. S3). In all other samples of mixtures the eutectic peak was not observed. It is speculated that its suppression is associated with one of the following three reasons: (i) supercooling behaviour of the salt mixture; (ii) broad melting of the excess peak for [C2mim]Cl (Fig. S3); or (iii) coincidence of the temperature of the eutectic mixture melting with the temperature range at which the peak of cold crystallisation of excess [C2mim]Cl is observed (Fig. S3). From the obtained results, it was extrapolated that the eutectic point for the mixture [C4mim]Cl + [C2mim]Cl should be present at a composition of 48.7 mol% [C4mim]Cl and 51.3 mol% [C2mim]Cl, with a melting temperature of 319 K. In order to confirm this approximation, an additional DSC experiment was performed where the parent salts were mixed at exactly the proposed eutectic point mole ratio. Unfortunately, after as many as five attempts, it was not possible to collect any valuable datum, and the closest molar composition that was analysed with success is the one corresponding to the 1[thin space (1/6-em)]:[thin space (1/6-em)]1 mole ratio (Fig. S3). As it can be seen on the DSC thermogram, the sample presents two melting transitions at temperatures in the vicinity of 320 K, where the lower temperature transition was assigned to the eutectic point and the higher melting point transition was assigned to the small amount of the excess component [C4mim]Cl. A literature value15 of 315 K, at a composition of 51% of [C2mim]Cl, for this eutectic mixture is in good agreement with the data obtained in the experiments herein. The small temperature difference of only 4 K is likely to be related to the difference in the method of determining the melting point transition (peak maximum vs. peak onset). Finally, it can also be noted that the melting point depression for the eutectic of this system (with a common anion and a mixture of cations) is lower than that achieved in the two previous systems (with a common cation and a mixture of anions). This is likely due to the fact that the structural similarity between the two cations in the system [C4mim]Cl + [C2mim]Cl is stronger than the similarity between the anions in the system [C2mim][PF6] + [C2mim][NO3] or in the system [C2mim][PF6] + [C2mim]Cl. The relative shape and size of the ions involved will have an influence on the different organisation that the ionic lattice may have in the mixtures of ionic liquids at a mesoscale level (as previously shown in the literature for different binary mixtures of ionic liquids),16,23,24 and consequently on the characteristics of the eutectic behaviour observed.


image file: c4ra17268j-f3.tif
Fig. 3 Temperature-composition phase diagram for the system [C4mim]Cl + [C2mim]Cl. Legend: -image file: c4ra17268j-u13.tif- melting point of the excess component [C4mim]Cl in the mixture; -image file: c4ra17268j-u14.tif- melting point of the excess component [C2mim]Cl in the mixture; -image file: c4ra17268j-u15.tif- eutectic mixture thermal transition; -image file: c4ra17268j-u16.tif- glass transition observed below the eutectic point transition.

As evidenced from the descriptions in the paragraphs above, determination of the eutectic point for the studied mixtures, and its subsequent physical observation, is not a straightforward task. The eutectic temperatures anticipated by intersection of the extrapolated fits of the depression of the melting temperatures of the excess components in the different samples could only be corroborated by a DSC run on a specifically prepared sample with the proposed eutectic composition for the case of the mixtures [C2mim][PF6] + [C2mim][NO3], and [C2mim][PF6] + [C2mim]Cl. Regardless of whether calculated or directly observed, the temperature depression of the melting points of the eutectic compositions, as compared to the melting points of the parent ionic liquids in each mixture, can be as large as ca. 50 K (e.g. [C2mim]Cl in the [C2mim][PF6] + [C2mim]Cl mixture).

It is interesting to note that, in a mass basis, the estimated composition values for the eutectic points match quite closely the ratio 1[thin space (1/6-em)]:[thin space (1/6-em)]1 for the systems [C2mim][PF6] + [C2mim][NO3] and [C4mim]Cl + [C2mim]Cl, and the ratio 3[thin space (1/6-em)]:[thin space (1/6-em)]1 for the system [C2mim][PF6] + [C2mim]Cl (Table 2). At this stage, however, it is difficult to elucidate whether or not these ‘integer’ mass ratios have any further significance.

Thermal stability

The thermal stabilities of the pure ionic liquids and of the eutectic mixtures were determined by thermogravimetric analysis (TGA). The regular onset decomposition temperatures (Td,onset) and the more conservative onset decomposition temperatures for a 5% decomposition (Td,5% onset), obtained by pertinent analysis of the TGA thermograms, are summarised in Table 3. As observed, the thermal stability temperatures for the eutectic mixtures do not differ significantly from the thermal stabilities of the parent compounds.
Table 3 Onset decomposition temperature (Td,onset) and 5% onset decomposition temperature (Td,5% onset) for the pure ionic liquids and their eutectic mixtures (see eutectic compositions in Table 2)
Ionic liquid or eutectic mixture Td,onset (K) Td,5% onset (K)
a A value of 529 K was reported by Niedermeyer et al.4b A value of 527 K was reported by Chatel et al.5c Sample with more than one distinguishable decomposition slope. The Td,onset values for each decomposition step are given (with indication, in parentheses, of the corresponding weight percent).
[C2mim][PF6] 592 561
[C2mim][NO3] 559 533
[C2mim]Cl 529a 496
[C4mim]Cl 515b 486
[C2mim][PF6] + [C2mim][NO3] 531, 564 (at 69.8%), 522
677 (at 47.7%)c
[C2mim][PF6] + [C2mim]Cl 528, 594 (at 62.0%)c 514
[C4mim]Cl + [C2mim]Cl 546 505


In Fig. 4 to 6, the TGA curves of the parent compounds are plotted along with those of the corresponding eutectic mixture, for a direct visual comparison. All of the analysed parent salts presented a single decomposition step. Regarding the eutectic mixtures, two of them (namely those for the systems [C2mim][PF6] + [C2mim][NO3] and [C2mim][PF6] + [C2mim]Cl) exhibited a complex decomposition profile. The eutectic mixture of [C2mim][PF6] and [C2mim][NO3] showed a three-step thermal decomposition with a first decomposition at a T5% onset lower than that of both parent compounds; although its decomposition is not completed below 700 K (Fig. 4). At this temperature still ca. 40% of the sample mass remains. In the case of the eutectic mixture of [C2mim][PF6] and [C2mim]Cl (Fig. 5), a two-step decomposition was observed, with a first T5% onset occurring at a temperature between the T5% onset values of the parent salts. However, at high temperatures (>650 K) its weight loss in the dynamic TGA experiments is lower than that of any of the parent compounds. Finally, for the eutectic mixture of [C4mim]Cl and [C2mim]Cl (Fig. 6), a simple one-step decomposition was observed. It is interesting that, for this particular eutectic mixture, not only the mixture has a T5% onset higher than any of the parent compounds but also its decomposition occurs in one step, contrary to the two other examples described.


image file: c4ra17268j-f4.tif
Fig. 4 TGA curves for [C2mim][PF6] and [C2mim][NO3], and for their eutectic mixture. Legend: (image file: c4ra17268j-u17.tif) [C2mim][PF6]; (image file: c4ra17268j-u18.tif) [C2mim][NO3]; (image file: c4ra17268j-u19.tif) eutectic mixture 40.0% [C2mim][PF6] and 60.0% [C2mim][NO3].

image file: c4ra17268j-f5.tif
Fig. 5 TGA curves for [C2mim][PF6] and [C2mim]Cl, and for their eutectic mixture. Legend: (image file: c4ra17268j-u20.tif) [C2mim][PF6]; (image file: c4ra17268j-u21.tif) [C2mim]Cl; (image file: c4ra17268j-u22.tif) eutectic mixture 62.4% [C2mim][PF6] and 37.6% [C2mim]Cl.

image file: c4ra17268j-f6.tif
Fig. 6 TGA curves for [C4mim]Cl and [C2mim]Cl, and for their eutectic mixture. Legend: (image file: c4ra17268j-u23.tif) [C4mim]Cl; (image file: c4ra17268j-u24.tif) [C2mim]Cl; (image file: c4ra17268j-u25.tif) eutectic mixture 48.7% [C4mim]Cl and 51.3% [C2mim]Cl.

Physical properties

The density, viscosity, and surface tension of the pure ionic liquids and of the eutectic mixtures were determined in their liquid state at atmospheric pressure and as a function of temperature, from 298 K or from above their measured melting temperature (see Tables 1 and 2) up to 348 K. The results are reported in Tables 4 and 5. For some of the data of pure ionic liquids, comparisons are possible with values previously published in the literature. Fig. S4 to S6 in the ESI show a graphical comparison of the values reported herein and those reported in the literature by other authors at the same or similar temperatures. In general, it can be said that there is an acceptable level of agreement between our results and the previous literature values, taking into account the uncertainties in the experimental measurements, the differences in the synthetic procedures, and the different water contents (which, even at low differences of concentrations, can lead to a substantial variation of the physical properties of ionic liquids).25
Table 4 Density (ρ), dynamic viscosity (η), and surface tension (σ) of the pure ionic liquids, in liquid state of aggregation, at atmospheric pressure and as a function of the absolute temperature (T)a
Ionic liquid T (K) ρ (g cm−3) η (mPa s) σ (mN m−1)
a The melting temperature of [C2mim]Cl is 361 K; hence no properties could be measured for it in its liquid range with the equipment available.
[C2mim][PF6] 338.15 1.42515 28.06 48.0
348.15 1.41656 20.97 48.3
[C2mim][NO3] 318.15 1.21012 25.39 49.6
328.15 1.20365 18.85 49.0
338.15 1.19726 14.32 50.4
348.15 1.19094 11.27 50.0
[C4mim]Cl 338.15 1.06020 280.6 42.8
348.15 1.05468 155.3 44.5


Table 5 Density (ρ), dynamic viscosity (η), and surface tension (σ) of the eutectic mixtures of ionic liquids, in liquid state of aggregation, at atmospheric pressure and as a function of the absolute temperature (T)
T (K) ρ (g cm−3) η (mPa s) σ (mN m−1)
[C2mim][PF6] + [C2mim][NO3] eutectic mixture
298.15 1.33222 83.15 51.7
308.15 1.32462 52.69 53.0
318.15 1.31707 35.79 52.2
328.15 1.30958 25.37 52.9
338.15 1.30215 18.88 52.3
348.15 1.29479 14.52 51.9
[thin space (1/6-em)]
[C2mim][PF6] + [C2mim]Cl eutectic mixture
318.15 1.35188 121.1 54.4
328.15 1.34425 73.24 53.6
338.15 1.33655 47.44 52.8
348.15 1.32878 32.52 51.8
[thin space (1/6-em)]
[C4mim]Cl + [C2mim]Cl eutectic mixture
328.15 1.09437 351.1 52.6
338.15 1.08876 173.6 52.2
348.15 1.08339 101.2 51.6


Both the density and the viscosity of all the studied samples (neat ionic liquids and eutectic mixtures) decrease with increasing temperature, although their evolution is starkly different (Fig. 7 and 8). Whereas a practically linear diminution of density with temperature is observed, the decrease of viscosity follows a typical exponential pattern. However, no general trend can be identified for the influence of temperature on the surface tension of the samples (Fig. 9), taking into account the level of uncertainty of the reported experimental measurements.


image file: c4ra17268j-f7.tif
Fig. 7 Density (ρ) of ionic liquids and their eutectic mixtures in liquid state at atmospheric pressure as a function of temperature (T): image file: c4ra17268j-u26.tif, [C2mim][NO3]; image file: c4ra17268j-u27.tif, [C2mim][PF6]; image file: c4ra17268j-u28.tif, [C4mim]Cl; image file: c4ra17268j-u29.tif, [C2mim][PF6] + [C2mim][NO3] eutectic mixture; image file: c4ra17268j-u30.tif, [C2mim][PF6] + [C2mim]Cl eutectic mixture; image file: c4ra17268j-u31.tif, [C4mim]Cl + [C2mim]Cl eutectic mixture.

image file: c4ra17268j-f8.tif
Fig. 8 Viscosity (η) of ionic liquids and their eutectic mixtures in liquid state at atmospheric pressure as a function of temperature (T): image file: c4ra17268j-u32.tif, [C2mim][NO3]; image file: c4ra17268j-u33.tif, [C2mim][PF6]; image file: c4ra17268j-u34.tif, [C4mim]Cl; image file: c4ra17268j-u35.tif, [C2mim][PF6] + [C2mim][NO3] eutectic mixture; image file: c4ra17268j-u36.tif, [C2mim][PF6] + [C2mim]Cl eutectic mixture; image file: c4ra17268j-u37.tif, [C4mim]Cl + [C2mim]Cl eutectic mixture.

image file: c4ra17268j-f9.tif
Fig. 9 Surface tension (σ) of ionic liquids and their eutectic mixtures in liquid state at atmospheric pressure as a function of temperature (T): image file: c4ra17268j-u38.tif, [C2mim][NO3]; image file: c4ra17268j-u39.tif, [C2mim][PF6]; image file: c4ra17268j-u40.tif, [C4mim]Cl; image file: c4ra17268j-u41.tif, [C2mim][PF6] + [C2mim][NO3] eutectic mixture; image file: c4ra17268j-u42.tif, [C2mim][PF6] + [C2mim]Cl eutectic mixture; image file: c4ra17268j-u43.tif, [C4mim]Cl + [C2mim]Cl eutectic mixture.

For the properties of the eutectic mixture [C2mim][PF6] + [C2mim][NO3], a comparison with the properties of both parent ionic liquids is possible. Thus, in Fig. 7 it is observed that the density of the eutectic mixture is approximately equivalent to the mass composition pondered average of the densities of the parent ionic liquids (the eutectic mixture has a [C2mim][NO3] mass fraction of 0.503 and a [C2mim][PF6] mass fraction of 0.497; i.e. nearly a 50[thin space (1/6-em)]:[thin space (1/6-em)]50 wt/wt composition):

 
ρw1ρ1 + w2ρ2 (1)
with w standing for mass fraction, and subscripts 1 and 2 referring to each of the parent compounds forming the eutectic. Calculated densities of 1.31040 g cm−3 at 338.15 K and of 1.30295 g cm−3 at 348.15 K are obtained by this procedure, representing an error of 0.6% with respect to the experimentally determined values. Thus, eqn (1) could be, from a merely practical point of view, a quick way to estimate the density of the eutectic mixture on the basis of its composition and the densities of the pure parent compounds.

The viscosity of the eutectic mixture [C2mim][PF6] + [C2mim][NO3] also lies between those of pure liquid [C2mim][PF6] and pure liquid [C2mim][NO3] at both temperatures 338.15 K and 348.15 K (Fig. 8). A simple mixing law for viscosity of binary liquid mixtures is the so-called Arrhenius relation:

 
ln[thin space (1/6-em)]η = x1[thin space (1/6-em)]ln[thin space (1/6-em)]η1 + x2[thin space (1/6-em)]ln[thin space (1/6-em)]η2 (2)
where x stands for mole fraction, and subscripts 1 and 2 refer to each of the parent compounds in the mixture. By applying eqn (2) to the data of [C2mim][PF6] and [C2mim][NO3] at the two highest temperatures tested, calculated viscosities of 18.88 mPa s and 14.52 mPa s are obtained for 338.15 K and 348.15 K respectively. These values match very well the experimental results, with an error lower than 1% in both cases.

With the surface tension, something peculiar is observed for the eutectic mixture of [C2mim][PF6] and [C2mim][NO3]: at the highest experimental temperatures tested, it can be observed that its surface tension is higher than both the surface tensions of the liquid parent compounds (Fig. 9). In contrast to the case of mixing two molecular compounds, it must be noted that in mixtures of two ionic liquids there are three or four different chemical moieties (i.e. three or four ions) instead of only two (i.e. two molecules). This offers an extra degree of flexibility for preferential enrichment of some of the moieties at the surface of the liquid as compared to the bulk concentrations. Also, the different orientations that asymmetric ions such as [C2mim]+ can adopt at the liquid surface may play a relevant role in the resulting surface tension.

For the other two eutectic mixtures, a comparison of the eutectic properties with those of both parent ionic liquids in liquid state is unfortunately not possible, due to the high melting temperature of [C2mim]Cl. Nevertheless, comparison with one of the parent ionic liquids is still possible. Thus, the density of the eutectic mixture [C2mim][PF6] + [C2mim]Cl is lower than that of liquid pure [C2mim][PF6], suggesting a hypothetical lower density of ‘liquid’ [C2mim]Cl at the studied temperatures. This is consistent with the fact of hexafluorophosphate ionic liquids being denser than chloride ionic liquids with the same cation.26 In the same vein, the density of the eutectic mixture [C4mim]Cl + [C2mim]Cl is higher than that of pure [C4mim]Cl, suggesting a higher density for ‘liquid’ [C2mim]Cl. This is also consistent with the increase in density observed for imidazolium ionic liquids when reducing the length of their alkyl chain (for chains with no more than ca. 8 carbon atoms).26 The reverse application of eqn (1) to both systems can be used in principle to estimate such hypothetical ‘liquid density’ of [C2mim]Cl. Interestingly, the results thus obtained from each system for [C2mim]Cl agree reasonably well: 1.07 g cm−3 or 1.08 g cm−3 (depending on the temperature) obtained from the [C2mim][PF6] + [C2mim]Cl mixture data, and 1.12 g cm−3 from the [C2mim]Cl + [C4mim]Cl mixture data. An analogous analysis can be done for the viscosities. The viscosity of the eutectic mixture [C2mim][PF6] + [C2mim]Cl is higher than that of pure [C2mim][PF6], and the viscosity of the eutectic mixture [C2mim]Cl + [C4mim]Cl is lower than that of pure [C4mim]Cl; in agreement with what would be expected from replacing an hexafluorophosphate anion with a chloride anion, or from replacing a butyl substituent with an ethyl substituent in 1-alkyl-3-methylimidazolium cations.26 The reverse application of eqn (2) to both systems does produce, again, quite coincident values of the hypothetical ‘liquid viscosity’ of [C2mim]Cl: 113.4 mPa s or 110.0 mPa s at 338.15 K, and 67.4 mPa s at 348.15 K. With regard to surface tension, the values for the eutectic mixtures are higher than those for the corresponding parent ionic liquids that are liquid at the same temperatures. However, the lack of availability of the surface tension of the second parent ionic liquid precludes a deeper analysis.

Experimental

Materials

Preparation of ionic liquids. 1-Ethyl-3-methylimidazolium chloride was purchased from Iolitec GmbH, with a nominal purity of 99%. All other chemicals were purchased from Sigma-Aldrich and used as received. The other ionic liquids were prepared using standard synthetic protocols and are described below. All compounds were purified and dried under high vacuum in order to eliminate the influence of water on the melting point analysis. The water content of the samples was determined by Karl-Fischer titration using a Metrohm 915 KF Ti-Touch instrument with volumetric titration.

Synthetic procedures

1-Butyl-3-methylimidazolium chloride. 1-Methylimidazole (0.10 mol, 8.20 g) was mixed with 25 mL acetonitrile and heated to 338 K. To this solution 0.11 mol of 1-chlorobutane (10.18 g) was added dropwise and the mixture was stirred for 24 h at 338 K. After elimination of the solvent and the excess reagent by rotary evaporation, ethyl acetate was added at ca. 313 K. The mixture was allowed to further cool down to ambient temperature, and a seed crystal was added to initiate crystallisation. The crystallised product was filtered and washed with a new portion of ethyl acetate, dried in the rotary evaporator and later under high vacuum. The absence of remaining starting materials or other impurities in the final product, a white crystalline powder, was checked by 1H and 13C NMR spectroscopy. The water content was found to be 0.0010 in mass fraction.
1-Ethyl-3-methylimidazolium nitrate. In order to prepare 1-ethyl-3-methylimidazolium nitrate, first 1-ethyl-3-methylimidazolium methylcarbonate ([C2mim][CH3CO3]) was prepared. For that, 0.10 mol of 1-ethylimidazole (9.60 g) and 0.20 mol of dimethylcarbonate (18.00 g) were mixed together, transferred to a glass pressure tube and placed in an oven at 403 K. After one week the pressure tube was removed from the oven, the excess alkylating agent was removed in the rotary evaporator, and then methanol was added to stabilise the [CH3CO3] anion (preventing it from decomposition to yield [HCO3]). To the solution of [C2mim][CH3CO3] in methanol, 1.02 mol equivalent of concentrated nitric acid was added dropwise with intense stirring. The mixture was stirred for 12 h at 323 K, with evolution of CO2 being a clear indication of the progress of the reaction. After that, all solvents were removed by rotary evaporation followed by high vacuum. The solid [C2mim][NO3] thus obtained was dried to decrease the water content below 0.0015 in mass fraction. The structure of the product was confirmed by 1H and 13C NMR spectroscopy.
1-Ethyl-3-methylimidazolium hexafluorophosphate. In order to prepare 1-ethyl-3-methylimidazolium hexafluorophosphate, first its bromide precursor was prepared. 1-Methylimidazole (0.10 mol, 8.20 g) was mixed with 25 mL acetonitrile and heated to 338 K. To this solution, 0.11 mol of bromoethane (11.88 g) was slowly added dropwise, giving highly exothermic reaction. After stirring for 1 h, the excess reagent and solvent were eliminated by rotary evaporation, and ethyl acetate was added at a temperature of ca. 313 K. The mixture was allowed to cool down to ambient temperature, and a seed crystal was added to initiate crystallisation. The crystallised product was filtered and washed with a new portion of ethyl acetate, dried in the rotary evaporator and later under high vacuum. The product, white crystalline [C2mim]Br, was then dissolved in dry dichloromethane and 1.2 mol equivalents of potassium hexafluorophosphate was added to this solution. The suspension was stirred for two days at room temperature to allow the metathesis reaction to proceed. The solid residue was separated from the solution, and the remaining dichloromethane solution was washed twice with water containing each time 0.1 mol equivalents of potassium hexafluorophosphate. In the last step, the dichloromethane phase was washed twice with just distilled water in order to remove possible inorganic salts. Limiting the time that the [PF6] salt is in contact with water (only the final step of ion exchange and the washing of the product) has a positive impact on the purity of the obtained ionic liquid, especially in terms of possible hydrolysis reaction and decomposition of the [PF6] anion. Immediately after separation of the dichloromethane phase, the solvent was removed by rotary evaporation, allowing for the [C2mim][PF6] to crystallise. The product was dried under high vacuum for five days in order to remove any remaining water. The water content was monitored by Karl-Fischer titration and kept below a mass fraction of 0.0003. The structure of the compound was confirmed by 1H and 13C NMR spectroscopy.

Methods

Preparation of ionic liquid mixtures for DSC analysis. In order to prepare the mixtures of ionic liquids for the determination of the eutectic point of the investigated systems, the following procedure was used: (1) initially 10 mmol of each parent ionic liquid was separately placed in a 50 mL volumetric flask and dissolved with methanol. (2) For each system, mole ratios with a 5 mol% step composition were used to prepare the mixtures. From each stock solution, appropriate volumes were taken in order to make a sample with a final total volume of ca. 425 μL (approximately 13–18 mg, which is a good sample size for the DSC analysis). The volumes of the solutions of the two ionic liquids of interest in each case were mixed in 1 mL vials, and the solvent was evaporated in a vacuum oven. (3) After solvent evaporation, 40 μL of methanol was added back to the vials in order to better handle uniform, concentrated mixtures. (4) These solutions were transferred, using a micropipette, to aluminium DSC pans (previously tared), and placed back in the vacuum oven. (5) After solvent evaporation, the vacuum was reduced to 10 mbar and the temperature set to 323 K, and the samples were stored in those conditions for five days to ensure complete removal of water from the samples. (6) The DSC pans were weighed in order to determine the mass of the ionic liquid mixtures, and sealed with lids with a pin hole to allow evacuation of any possible remaining volatile impurity during the first heating cycle of the DSC experiment. (7) Finally, the so-prepared samples were submitted for DSC analysis.

In order to more precisely determine the eutectic point compositions, additional analyses were performed on samples with compositions close to the preliminary determined eutectic composition. For these additional analyses, samples of ca. 50 mg were prepared by mixing the two ionic liquids at the corresponding composition ratio (without prior formation of stock solutions, or any solvents involved) and such mixtures were placed directly in the DSC pans (previously tared), and placed back in the vacuum oven (10 mbar and temperature of 323 K). The samples were stored in those conditions for five days to ensure complete removal of water from the samples, and next the DSC pans were weighed in order to determine the mass of the ionic liquid mixtures, and sealed with lids with a pin hole to allow evacuation of any possible remaining volatile impurity during the first heating cycle of the DSC experiment. Finally, the so-prepared samples were submitted for DSC analysis.

DSC protocol. Melting point/glass transition analyses were determined by running DSC experiments in a Mettler-Toledo DSC 1 STARe System differential scanning calorimeter, cooled with a Huber TC100 immersion cooler. The calorimeter was calibrated for temperature and cell constants using high purity indium (melting temperature: 429.76 K; specific enthalpy of melting: 28.71 J g−1). Data were collected at atmospheric pressure. The samples were initially heated from room temperature, at a rate of 2.5 K min−1, to 398 K. At this temperature, they were held for a 25 min isotherm, prior to two cycles of cooling and heating at rates of 2.5 K min−1 spaced by 10 min isothermal holding at the lower (193 K) and upper (398 K) endpoint temperatures. Samples in the range 13–18 mg were used in aluminium sample pans, sealed with lids with a pin hole. An empty sample pan served as the reference. The temperatures reported for the glass transition and melting were established as the peak temperatures for the endothermic changes in heat flow. See further details in the ESI.

In few cases, especially with samples of the mixture [C4mim]Cl + [C2mim]Cl, and due to the difficulty in observing the thermal transitions, additional experiments at larger scale (ca. 50 mg) were performed, with the ionic liquids being mixed directly in the DSC pan.

Eutectic point determination based on the peak position. The evaluation of the results and determination of eutectic compositions and temperatures was done via construction of the corresponding isobaric phase diagrams. For that, the end of melting of the eutectic and of the excess component were plotted against the composition.
Thermogravimetric analyses. TGA runs were performed in a TA Instruments Q50 thermogravimetric analyser. The experiments were conducted under nitrogen atmosphere and measured in the dynamic heating regime. Samples in the range 5–15 mg were heated from 298 K to 348 K at a heating rate of 10 K min−1, and from 348 K to 773 K at a heating rate of 5 K min−1, with a 30 min isotherm at 348 K. This isotherm step was intended to help in removing any remaining water and possible volatile impurities present in the samples. Temperatures reported for the decomposition profiles for all materials were established as the onset temperature for decomposition of the first 5% of the sample (T5% onset), and as the regular onset temperature for decomposition (Tonset), either for the whole sample or for each of the consecutive steps in stepwise decomposition (see Table 3).
Physical properties. Density, viscosity, and surface tension were determined for the pure ionic liquids and for the eutectic mixtures in liquid state within the temperature range 298–348 K, at atmospheric pressure.

Densities were measured in an Anton Paar DMA 5000 vibrating U-tube density meter, with internal control of the temperature with a precision of 1 mK by means of built-in Pt-100 platinum thermometers. An automatic correction of the influence of viscosity in the density measurements was carried out. Although the nominal repeatability of the apparatus is 1 × 10⁻⁶ g cm−3, the uncertainty of the measurements was estimated to be 3 × 10⁻⁵ g cm−3.

Viscosities were determined using micro-Ubbelohde capillary glass viscometers manufactured, calibrated, and certified by Schott. Capillary viscometers of different diameters were used depending on the viscosity of the sample, ensuring that the efflux times were neither too short (to avoid influence of the kinematic energy) nor too long (to keep an acceptable repeatability of the efflux times measured). Efflux times of the samples through the capillaries were determined, with a resolution of 0.01 s, by means of photoelectric cells integrated in a Processor Viscosity System PVS1 by Lauda. A minimum of three measurements were made for each sample, and the average efflux times t were calculated after disregarding outlying values, if any. The dynamic viscosity η was calculated with the following expression: η = ρKt, where ρ is the density of the sample and K is the certified calibration constant of the capillary viscometer. The temperature was kept constant during the measurements by means of a Lauda D20 KP clear view thermostatic water bath coupled with a Lauda DLK 10 through-flow cooling device. The values of η thus obtained were estimated to have an uncertainty of 0.5%.

Surface tensions were measured in a Krüss K11 tensiometer by means of the Wilhelmy plate method. A platinum ‘plate’ was used, with dimensions 20 mm × 10 mm × 0.1 mm, and bended in a cylindrical shape to facilitate the measurement with smaller amounts of sample (Krüss accessory reference PL22). The temperature of the samples during the measurement was kept constant to within 0.1 K by means of an oil bath with its temperature controlled by circulating water from a Frigiterm-10 Selecta cryogenic thermostat. After partial immersion of the plate in the liquid, a total of twelve consecutive measurements were performed by the apparatus for each sample, disregarding the first two values and averaging the last ten values. The standard deviations found were typically within the range of the uncertainty of the apparatus, estimated to be within a few tenths of a milliNewton per meter. However, due to the strong hygroscopic character of the samples, a higher overall uncertainty of 1 mN m−1 is estimated for the surface tension values reported herein.

Conclusions

Three eutectic mixtures have been identified in systems composed of two ‘single’ (one cation, one anion) ionic liquids with a common ion; namely in the systems [C2mim][PF6] + [C2mim][NO3], [C2mim][PF6] + [C2mim]Cl, and [C4mim]Cl + [C2mim]Cl. The eutectic temperatures and compositions were experimentally determined by DSC analysis. Melting point depressions, measured from the higher melting component in the mixture, were found in the range 40–50 K. For the system [C4mim]Cl + [C2mim]Cl (in which the only structural difference between the two mixed ionic liquids is the length of the alkyl substituent chain in the cation), a eutectic composition at approximately the 1[thin space (1/6-em)]:[thin space (1/6-em)]1 mole ratio was found. This was not the case for the other two systems investigated. The same different behaviour among systems was observed in TGA runs of the eutectic mixtures: whereas the eutectic mixture of [C4mim]Cl and [C2mim]Cl decomposed thermally in a single step, for the other two eutectics a more complex thermal decomposition pattern was observed. In terms of thermal stability, no major differences were observed between the parent compounds and their corresponding eutectic mixtures.

For the eutectic mixture of [C2mim][PF6] and [C2mim][NO3] it was possible to compare its physical properties with those of both parent ionic liquids in liquid state, at some specific temperatures within the experimental temperature range available. The density and viscosity of the eutectic mixture were found to lie within those of the parent compounds at the corresponding temperatures, and to be approximately predicted by simple relations of the properties of the pure ionic liquids. Conversely, it was found that the surface tension of the eutectic mixture was somewhat higher than that of the parent compounds.

The eutectics prepared and investigated herein are examples of how some specific limitations of ‘single’ ionic liquids (for a given application) can be overcome by judicious combination with another ionic liquid to form a eutectic. In this way, the melting temperature will be lowered and hence the temperature range of application will be expanded, and at the same time an extra degree of tunability of the corresponding physical properties will be introduced, while integrally preserving the ionic liquid character of the fluid.

Acknowledgements

The authors acknowledge financial support from the National Science Centre (Poland), project SONATA (no. 2011/03/D/ST5/06200) entitled “Eutectic mixtures of ionic liquids – Determination of eutectic point and analysis of relationship between structure of ions and properties of obtained eutectic mixtures”. H.R. is grateful to the Spanish Ministry of Economy and Competitiveness for support (Ramón y Cajal program). H.R. also thanks the COST action CM1206 for support via a STSM Grant.

Notes and references

  1. D. R. MacFarlane and K. R. Seddon, Aust. J. Chem., 2007, 60, 3–5 CrossRef CAS.
  2. A. Stark and K. R. Seddon, in Kirk-Othmer Encyclopedia of Chemical Technology, ed. A. Seidel, Wiley, Hoboken, NJ, USA, 2007, vol. 26 Search PubMed.
  3. J. N. Canongia Lopes, T. C. Cordeiro, J. M. S. S. Esperança, H. J. R. Guedes, S. Huq, L. P. N. Rebelo and K. R. Seddon, J. Phys. Chem. B, 2005, 109, 3519–3525 CrossRef PubMed.
  4. H. Niedermeyer, J. P. Hallet, I. J. Villar-Garcia, P. A. Hunt and T. Welton, Chem. Soc. Rev., 2012, 41, 7780–7802 RSC.
  5. G. Chatel, J. F. B. Pereira, V. Debbeti, H. Wang and R. D. Rogers, Green Chem., 2014, 16, 2051–2083 RSC.
  6. S. H. Lee, S. H. Ha, N. M. Hiep, W. J. Chang and Y. M. Koo, J. Biotechnol., 2008, 133, 486–489 CrossRef CAS PubMed.
  7. J. Long, B. Guo, X. Li, Y. Jiang, F. Wang, S. C. Tsang, L. Wang and K. M. K. Yu, Green Chem., 2011, 13, 2334–2338 RSC.
  8. Q. Q. Baltazar, S. K. Leininger and J. L. Anderson, J. Chromatogr. A, 2008, 1182, 119–127 CrossRef CAS PubMed.
  9. T. Sugimoto, Y. Atsumi, M. Kikuta, E. Ishiko, M. Kono and M. Ishikawa, J. Power Sources, 2009, 189, 802–805 CrossRef CAS.
  10. A. M. Pinto, H. Rodríguez, Y. J. Colón, A. Arce Jr, A. Arce and A. Soto, Ind. Eng. Chem. Res., 2013, 52, 5975–5984 CrossRef CAS.
  11. M. Smiglak, J. M. Pringle, X. Lu, L. Han, S. Zhang, H. Gao, D. R. MacFarlane and R. D. Rogers, Chem. Commun., 2014, 50, 9228–9250 RSC.
  12. M. Smiglak, N. J. Bridges, M. Dilip and R. D. Rogers, Chem.–Eur. J., 2008, 14, 11314–11319 CrossRef CAS PubMed.
  13. T. Dunstan, J. Don and J. Caja, ECS Trans., 2007, 3, 21–32 CAS.
  14. P. M. Bayley, A. S. Best, D. R. MacFarlane and M. Forsyth, ChemPhysChem, 2011, 12, 823–827 CrossRef CAS PubMed.
  15. M. Kick, P. Keil and A. König, Fluid Phase Equilib., 2013, 338, 172–178 CrossRef CAS.
  16. F. D'Anna, S. Marullo, P. Vitale and R. Noto, ChemPhysChem, 2012, 13, 1877–1884 CrossRef PubMed.
  17. F. D'Anna, S. Marullo, P. Vitale, C. Rizzo, P. L. Meo and R. Noto, Appl. Catal., A, 2014, 482, 287–293 CrossRef.
  18. Y. Bai, Y. Cao, J. Zhang, M. Wang, R. Li, P. Wang, S. M. Zakeeruddin and M. Grätzel, Nat. Mater., 2008, 7, 626–630 CrossRef CAS PubMed.
  19. Y. Cao, J. Zhang, Y. Bai, R. Li, S. M. Zakeeruddin, M. Grätzel and P. Wang, J. Phys. Chem. C, 2008, 112, 13775–13781 CAS.
  20. N. Emel'yanenko, S. P. Verevkin, A. Heintz and C. Schick, Green Chem., 2008, 112, 8095–8098 Search PubMed.
  21. U. Domańska and A. Marciniak, J. Chem. Eng. Data, 2003, 48, 451–456 CrossRef.
  22. P. Keil and A. Konig, Thermochim. Acta, 2011, 524, 202–204 CrossRef CAS.
  23. D. Xiao, J. R. Rajian, S. Li, R. A. Bartsch and E. L. Quitevis, J. Phys. Chem. B, 2006, 110, 16174–16178 CrossRef CAS PubMed.
  24. F. Castiglione, G. Raos, G. B. Appetecchi, M. Montanino, S. Passerini, M. Moreno, A. Famulari and A. Mele, Phys. Chem. Chem. Phys., 2010, 12, 1784–1792 RSC.
  25. K. R. Seddon, A. Stark and M.-J. Torres, Pure Appl. Chem., 2000, 72, 2275–2287 CrossRef CAS.
  26. K. R. Seddon, A. Stark and M.-J. Torres, in Clean Solvents – Alternative Media for Chemical Reactions and Processing, ed. M. A. Abraham and L. Moens, ACS Symposium Series 819, American Chemical Society, Washington, DC, USA, 2002, pp. 34–49 Search PubMed.

Footnote

Electronic supplementary information (ESI) available. See DOI: 10.1039/c4ra17268j

This journal is © The Royal Society of Chemistry 2015
Click here to see how this site uses Cookies. View our privacy policy here.