DOI:
10.1039/C4RA17151A
(Paper)
RSC Adv., 2015,
5, 17802-17808
Facile preparation of C-modified TiO2 supported on MCF for high visible-light-driven photocatalysis
Received
28th December 2014
, Accepted 26th January 2015
First published on 26th January 2015
Abstract
A green and facile approach is employed to prepare an efficient visible-light-driven photocatalyst by using mesocellular foams (MCF) as a matrix, glucose as a carbon-modified source and TiO2 as the catalytic active site, which is denoted as C-modified TiO2/MCF. Characterization results reveal that nano-sized TiO2 nanoparticles are loaded in the pore channels of MCF rather than being aggregated on the surface of the MCF. Furthermore, glucose selectively covers the surface of the TiO2/MCF composites during the stirring process due to the excellent adsorption capacity of MCF, and glucose then can be transformed into coke carbon through a hydrothermal process. In addition, a facile thermal treatment is adopted to enhance the visible light photocatalytic activity of the TiO2/MCF composites. It is believed that the post-thermal treatment plays a significant role in controlling the carbon diffusion from the surface to the bulk of TiO2. Compared to traditional C-TiO2 photocatalysts, the prepared C-doped catalyst exhibits stable carbon doping of TiO2, superior adsorption capacity and higher visible light photocatalytic activity owing to the special structure of the supported mesoporous catalyst. This study implies that the novel photocatalyst has good application prospects in photocatalytic water splitting, dye-sensitized solar cells and other fields.
1. Introduction
Titanium dioxide (TiO2) has been widely studied as a well-known photocatalyst due to its advantages of non-toxicity, excellent stability, and low cost of materials.1–8 As TiO2 only absorbs ultraviolet light energy, which only accounts for ca. 4% of the solar spectrum,9–11 many efforts have been focused on improving the visible light photocatalytic performance of TiO2 such as element doping,12,13 oxygen deficiency14–16 and compositing.17–19 Especially, carbon doping can significantly enhance visible-light absorption and energy conversion, and stabilize anatase TiO2.20,21 Additionally, carbon doping can also improve the conductivity of TiO2, as it can facilitate the charge transfer from the bulk of TiO2 to the surface region.22 Khan et al.23 reported the high photoactivity of C-doped TiO2 in the photoelectrochemical water splitting reaction to produce H2 and O2, and obtained photo-conversion efficiencies as high as 8.35%. Similarly, Kisch et al.24 verified that C-doped TiO2 could efficiently mineralize 4-chlorophenol and the azo dye remazol red under indoor light, whereas unmodified TiO2 was almost inactive.
However, there are still some immediate disadvantages that decrease the visible light activity of C-doped TiO2. The major problems are as follows: (1) most of the carbon is loaded on the surface of TiO2 rather than in the bulk, and the carbon existing on the surface can easily detach during the photocatalytic reaction, leading to the deactivation of the catalyst; (2) the doping of carbon into the lattice of TiO2 usually results in the formation of oxygen vacancies in the bulk, and these defects can induce charge trapping and recombination sites for photo-excited charge carriers.22,25–27 Recently, mesoporous materials have been widely used as a matrix to support metal or nonmetal oxides and as an ideal adsorbent for organic pollutants28–31 owing to their controllable pore size and large specific surface area. Mesoporous materials can offer a separated space for crystalline TiO2 and adsorb more carbon species on the surface of TiO2 in the hydrothermal process, i.e., the coke carbon covering the surface of TiO2 does not easily fall into the reaction system during the photocatalytic reaction process due to the protection of the mesoporous structure.
Herein, we employed a green and novel approach for the fabrication of a catalyst integrated with C-modified TiO2 by using MCF as the matrix through hydrothermal and post-thermal processes. The MCF matrices can provide abundant sites and spaces for the loading of TiO2 nanoparticles and the location of glucose. In this case, the TiO2 nanoparticles nucleated, grew, and crystallized in the pore channels of the MCF, and C6H12O6 was adsorbed, transformed and doped into the lattice of TiO2, which is precisely separated and controlled via the hydrothermal and post-thermal processes. The prepared C-modified TiO2/MCF composites not only possessed highly dispersed TiO2 nanoparticles (∼10 nm) and a high surface area of ∼389.79 m2 g−1, but also exhibited excellent visible light photocatalytic activity in degradation of methyl orange.
2. Experimental-materials and methods
2.1 Materials
All chemicals, including pluronic P123 triblock copolymer (EO20PO70EO20, Mav = 5800, Aldrich), 1,3,5-trimethylbenzene (TMB, AR), ammonium fluoride (AR), tetraethyl orthosilicate (TEOS, AR), hydrochloric acid (HCl, 36–38%), titanium sulfate (CP), and glucose (AR), were used as received without any further purification.
2.2 Preparation of MCF
The pure siliceous MCF sample was prepared as described previously.32 In detail, 4.0 g P123 was dissolved in a solution of 20 mL HCl and 130 mL distilled water at a temperature of 37 °C and 46.7 mg NH4F and 2.0 g TMB were added to the above solution under vigorous stirring for 1 hour. Then, the temperature of the system rose to 37 °C and 18.3 mL TEOS was slowly added dropwise to the above solution. The mixture was maintained at 37 °C with stirring for 20 hours. The obtained slurry was transferred to an autoclave and aged at 100 °C for another 24 hours. The solid products were washed with distilled water and dried overnight at 60 °C under vacuum. The occluded surfactant was removed by calcination in a muffle furnace at 550 °C for 6 h in air. The final products were obtained and denoted as MCF.
2.3 Preparation of C-modified TiO2/MCF
3 g Ti(SO4)2 and a certain amount of glucose were dissolved in 63 mL distilled water with stirring for 30 minutes. 2 g MCF was added to the solution and stirred for 30 minutes. The solution was transferred to an autoclave and maintained at 120 °C for 7 hours. The obtained products were washed and dried at 60 °C for 12 hours under vacuum to obtain the catalyst of MCF loaded with C-modified TiO2. The obtained composites were denoted as “nC-TiO2/MCF” (“n” indicates the amount of glucose, n = 0.1, 0.20, 0.40, 0.80, 1.20, or 1.60 g). To investigate the effects of post-thermal treatment on C-TiO2/MCF, the as-prepared C-TiO2/MCF was treated in air at 200 °C, 300 °C, and 400 °C for 2 h in a muffle furnace. The corresponding samples were labelled as nC-TiO2/MCF-200, nC-TiO2/MCF-300, and nC-TiO2/MCF-400. The as prepared sample without addition of glucose was denoted as TiO2/MCF.
2.4 Characterization
X-ray diffraction (XRD) patterns of all samples were collected in the range of 10–80° (2θ) using a Rigaku D/MAX 2550 diffractometer (Cu K radiation, λ = 1.5406 Å), operated at 40 kV and 100 mA. The morphologies were characterized by transmission electron microscopy (TEM, JEM-2000EX). The ground samples for TEM measurements were suspended in ethanol with the assistance of ultrasound and supported on a carbon-coated copper grid. The instrument employed for X-ray photoelectron spectroscopy (XPS) studies was a Perkin-Elmer PHI 5000C ESCA system with Al Kα radiation operated at 250 W. The shift of the binding energy due to the relative surface charging was corrected using the C1s level at 284.4 eV as an internal standard. The UV-vis absorption spectra of the samples were observed with a Varian Cary 500 spectrophotometer equipped with an integrating sphere. N2 adsorption–desorption isotherms were measured on an ASAP2020 instrument at 77 K. Before the measurements, all samples were degassed at 180 °C for 8 h. Raman spectra were collected using a Raman microscope (Renishaw, UK) under a 514 nm excitation.
2.5 Photoelectrochemical tests
Photocurrent measurements were carried out with an analyzer (Zahner, Zennium) in dark conditions using a standard three electrode cell with a working electrode, a Pt wire as the counter electrode, and a saturated calomel electrode as the reference electrode. A 0.5 M solution of Na2SO4 was used as the electrolyte.
2.6 Photocatalytic activity tests
The photocatalytic reaction details are as follows. All experiments were conducted at normal temperatures and pressures. The photocatalytic activity of the prepared samples was evaluated by the photocatalytic degradation of methyl orange (MO) under visible light irradiation. Briefly, 70 mg of catalyst and 70 mL of MO solution (10 mg L−1) were added together to a reaction tube equipped with a magnetic stirrer, exposed to a 500 W tungsten halogen lamp equipped with a UV cut-off filter (λ > 420 nm). The distance between the light and the reaction tube was fixed at 24 cm. Before the irradiation, the suspension was maintained in the dark for 2 h in order to reach the adsorption–desorption equilibrium. When the first photocatalytic reaction was complete, the solid catalyst was recovered by centrifugation, re-dispersed in water and irradiated for 30 min to degrade the residual MO adsorbed on the surface of the TiO2. Then, the catalyst was recovered by centrifugation, washed three times with deionized water, dried under vacuum at 40 °C, and subjected to the next photocatalytic reaction in recycle tests. For every cycle, we used a new MO solution (10 mg L−1); thus, we were able to eliminate the impact of residual MO on the cycle tests.
3. Results and discussion
The C-modified TiO2/MCF was prepared via hydrothermal and post-thermal methods (Fig. 1). During the hydrothermal process, the carbon source (C6H12O6) could be quickly adsorbed into the pore channels of MCF and covered the surface of TiO2, and was then turned into coke carbon. The next post-thermal processes could facilitate the movement of some of the coke carbon from the surface to the bulk of the TiO2 (Fig. 1). The obtained composites were denoted as “nC-TiO2/MCF-T” (“n” indicates the addition amount of glucose, n = 0.1, 0.20, 0.40, 0.80, 1.20, or 1.60 g; “T” indicates the thermal treatment temperature, T = 100, 200, or 300 °C). The composites without thermal treatment were denoted as “nC-TiO2/MCF”. The pure Ti(SO4)2 and MCF without the addition of C6H12O6 through the hydrothermal process were denoted as TiO2/MCF.
 |
| | Fig. 1 Fabrication process for C-TiO2/MCF composites. | |
3.1 Nanoparticle crystal structure and specific surface area
The morphology and structure of C-TiO2/MCF composites were first examined by X-ray diffraction (XRD) (Fig. 2a). All the samples were of pure anatase phase, with uniform crystals of 10 nm in size as calculated by the Scherrer equation. This means that the pore size of MCF must be much larger than 10 nm to ensure the loading of the TiO2 nanoparticles into the pore channels of MCF. Indeed, this is supported by the pore channel diameter of the MCF (20–50 nm) (Fig. 2b, inset). In addition, with the increasing addition of C6H12O6 and the variation of thermal treatment temperature, the size of the crystal remained almost unchanged. That is, the addition of C6H12O6 and the process of the thermal treatment do not affect the size of crystal. The nitrogen physisorption measurements indicate that the pore size of the MCF is around the range of 20–50 nm (Fig. 2b), which implies that it is entirely possible for the TiO2 nanoparticles to be introduced into the pore channels of the MCF. The adsorption data reveal a remarkably high specific surface area of 548.97 m2 g−1 for the MCF. With the occupation of the TiO2 nanoparticles inside the mesoporous channels, a significant decrease of the surface area from 548.97 to 416.19 m2 g−1 and a decrease of the range of pore sizes from 20–50 nm to 10–40 nm were observed for the TiO2/MCF catalyst (Fig. 2c), which can be ascribed to the fact that TiO2 nanoparticles are introduced into the pore channels rather than covering the surface of the MCF. Compared with TiO2/MCF, although the surface area of 1.2C-MCF/TiO2 decreased slightly to 389.79 m2 g−1 (Fig. 2d), the range of pore sizes and the shape of the N2 sorption isotherms were almost unchanged, which implies the successful introduction of C6H12O6 into the pore channels of the MCF rather than the outside of the MCF.
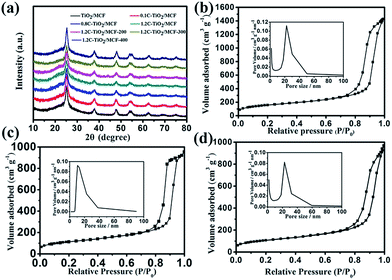 |
| | Fig. 2 XRD patterns for C-TiO2/MCF composites (a) and N2 sorption isotherms of (b) MCF, (c) TiO2/MCF, (d) 1.2C-TiO2/MCF (inset: pore size distribution). | |
3.2 Investigation of the carbon existential form
To investigate the carbon existential form in the series of C-TiO2/MCF composites, we conducted X-ray photoelectron spectroscopy (XPS), Raman spectroscopy and UV-vis absorption spectroscopy on the samples. The C-1s XPS spectra of 1.2C-TiO2/MCF, 1.2C-TiO2/MCF-200 and 1.2C-TiO2/MCF-400 are shown in Fig. 3a. A broad energy range from 280.0 to 294.0 eV can be observed. The peak at 284.6 eV among the three samples is assigned to the adventitious carbon species from the XPS measurement. The peak at 289.0 eV for both 1.2C-TiO2/MCF and 1.2C-TiO2/MCF-200 belongs to the C(O)OH bond. This means that larger amounts of C(O)OH species exist on the catalyst surface. From the Raman spectra (Fig. 3b), the two peaks at 1400 cm−1 and 1600 cm−1 of 1.2C-TiO2/MCF and 1.2C-TiO2/MCF-200 are from the coke carbon species.33,34 Therefore, the surface C(O)OH species deduced from XPS spectra analysis are coke carbon species covering the surface. Some research reports also showed that surface-bonded coke carbon is very easy to generate when glucose is used as the carbon source.35 Comparing the intensity of the two peaks of 1.2C-TiO2/MCF and 1.2C-TiO2/MCF-200 (Fig. 3b), we find that some of the coke carbon species are doped into the bulk of TiO2, which leads to a reduction of intensity and a slight color change for 1.2C-TiO2/MCF-200 (Fig. 3d). Furthermore, the peak at 282.0 eV for 1.2C-TiO2/MCF-200 is caused by the O–Ti–C bond,36 which is a convenient indicator of successful carbon doping into the lattice of TiO2. Interestingly, these peaks for the surface coke carbon and the bulk carbon in XPS and Raman spectra disappear when the thermal treatment temperature is raised to 400 °C. Obviously, the higher temperature will result in a total loss of both the surface coke carbon and the bulk carbon. Fig. 3c clearly shows the UV-vis absorption spectra for the undoped TiO2/MCF, 1.2C-TiO2/MCF and the thermally treated composites. The undoped TiO2/MCF only has absorption in the UV region, but the thermally treated composites of 1.2C-TiO2/MCF-200 extend their absorption from the UV region to the visible light region. Nevertheless, the thermally treated samples at 400 °C only absorb UV light, which is the same as the undoped TiO2/MCF. These results indicate the existence of the carbon from the surface to the bulk for the 1.2C-TiO2/MCF-200 samples. Both the 1.2C-TiO2/MCF and 1.2C-TiO2/MCF-200 samples display apparent color changes to light yellow from white TiO2/MCF (Fig. 3d), which is caused by the surface coke carbon. This result suggests that a treatment temperature close to 200 °C will not lead to a significant loss of surface carbon. The sample treated at 400 °C is pure white. These results are in good agreement with the XPS results.
 |
| | Fig. 3 XPS spectra of pristine and thermally-treated C-TiO2/MCF (a); Raman spectra of pristine and thermally-treated C-TiO2/MCF (b); C-TiO2/MCF UV-vis absorption spectra for different samples (c); images of as prepared samples (d). | |
3.3 Nanoparticle morphology
The transmission electron microscopy (TEM) images of MCF, TiO2/MCF, 1.2C-TiO2/MCF, and 1.2C-TiO2/MCF-200 are shown in Fig. 4. The mesoporous channels of MCF could be observed with sizes ranging from 20 to 50 nm (Fig. 4a), agreeing well with the BET result. After the hydrothermal process, the TiO2 nanoparticles were introduced into the pore channels of MCF, which is consistent with the observation that there is an absence of aggregated TiO2 nanoparticles covering the surface of the MCF (Fig. 4b). Our previous work on TiO2/MCF has also demonstrated that the TiO2 nanoparticles are indeed loaded into the pore channels rather than covering the surface of the MCF.6 Meanwhile, the mesoporous structure is clearly observed after hydrothermal reaction with the addition of C6H12O6 (Fig. 4c). These results suggest that C6H12O6 can be selectively adsorbed into the mesoporous channels without any free coverage outside the pore channels. After thermal treatment of the 1.2C-TiO2/MCF sample in air at 200 °C, the mesoporous structures are not destroyed and the pore size is almost identical (Fig. 4d). In addition, the high-resolution transmission electron microscopy (HRTEM) image (Fig. 4e) of 1.2C-TiO2/MCF clearly shows the mesoporous structure with an average pore diameter centered at 20–40 nm, which is in good agreement with the BET results. In addition, the HRTEM image (Fig. 4f) demonstrates that highly crystalline TiO2 nanoparticles are selectively loaded in the pore channels of MCF. A well-defined crystalline lattice can be identified with a d spacing of 0.35 nm, corresponding to the (101) plane of anatase TiO2.
 |
| | Fig. 4 TEM images for different samples. (a) MCF, (b) TiO2/MCF, (c) 1.2C-TiO2/MCF, (d) 1.2C-TiO2/MCF-200. HRTEM images (e and f) for 1.2C-TiO2/MCF-200. | |
3.4 Effect of the addition amount of C6H12O6 and thermal treatment on the photocatalytic activity
The photocatalytic activity of the as-prepared samples was evaluated by the degradation of methyl orange (MO 10 mg L−1) under visible light irradiation (λ > 420 nm). First, we investigated the effects of the C6H12O6 addition amount on the photocatalytic activity of the C-TiO2/MCF composites. Fig. 5a shows the adsorption capacity of MO in the dark for C-TiO2/MCF treated with different addition amounts of C6H12O6. It can be seen that all the C-TiO2/MCF composites exhibit an excellent adsorption capacity of MO in the dark for 2 h, due to the existence of the mesoporous structure (MCF). However, with increasing addition of C6H12O6, the photodegradation rate of MO over C-TiO2/MCF composites under visible light irradiation increases first and then decreases obviously (Fig. 5b). When the C6H12O6 addition amount was 1.2 g, the corresponding catalyst demonstrated the optimal photocatalytic activity. An analogous activity trend for the photocatalytic reaction is also observed for C-TiO2 nanocomposites in some other previous reports.37 The value of the degradation rate of MO for 1.2C-TiO2/MCF was around 60% after visible light irradiation for 5 h, which is related to the amount of the surface coke carbon on TiO2. This further confirms that the high photocatalytic activity of 1.2C-TiO2/MCF is ascribed to the photosensitization mechanism of surface coke carbon. When the amount of surface coke carbon is above the optimum addition, excess surface carbon will wrap the TiO2 surface and the electrons generated from photosensitization will have great difficulty reaching the conductive band (CB) of TiO2, which leads to relatively lower photoactivity of 1.6C-TiO2/MCF compared to that of 1.2C-TiO2/MCF. In order to eliminate the effects of dye self-sensitization, the photocatalytic reaction in the absence of catalyst has been investigated (Fig. 5b). It can be seen that the effect of dye self-sensitization is very weak, which further confirms that the high photocatalytic activity for 1.2C-TiO2/MCF can be attributed to the photosensitization mechanism of surface coke carbon. For the 1.2C-TiO2/MCF catalyst treated at 100–300 °C, the adsorption capacity of MO in the dark is no different among the three samples (Fig. 5c). Under the optimized thermal treatment conditions, 1.2C-TiO2/MCF-200 exhibited the highest photocatalytic activity. After visible light illumination for 5 h, the MO was degraded up to 80% by 1.2C-TiO2/MCF-200, higher than the 1.2C-TiO2/MCF catalyst (Fig. 5d). However, both 1.2C-TiO2/MCF-300 and 1.2C-TiO2/MCF-400 showed lower photocatalytic activity than the pristine 1.2C-TiO2/MCF, which is ascribed to the absence of carbon in the bulk or on the surface after high temperature calcination treatment. This result is consistent with the previous report.20
 |
| | Fig. 5 Adsorption capacities of MO (10 mg L−1) for different samples (a and c); visible light photocatalytic activities of different samples (b and d). | |
3.5 The stability of the photocatalytic performance of the catalyst after cycle experiments
To examine the photocatalytic stability of C-TiO2/MCF-200, we performed visible-light-driven degradation of MO (10 mg L−1) cycle experiments. As shown in Fig. 6a, the catalyst maintains a high photodegradation rate of MO (80%), without an apparent decrease after five cycles. Additionally, the XPS spectrum of C-TiO2/MCF-200 after five cycles shows that the Ti–O–C bond and the surface C(O)OH species still exist in the catalyst (Fig. 6b). More direct observations by HRTEM of the morphology and structure of C-TiO2/MCF-200 after five cycles are shown in Fig. 6c. The mesoporous structure is still retained, and the pore diameter keeps its initial size. This result also indicates that the prepared C-TiO2/MCF-200 has a very stable structure.
 |
| | Fig. 6 Cycling photodegradation of MO for C-TiO2/MCF-200 (a); XPS spectrum of C-TiO2/MCF-200 after 5 cycles (b); HRTEM image of C-TiO2/MCF-200 after 5 cycles (c). | |
3.6 Effect of thermal treatment on photoelectrochemical properties
In order to further investigate the photoelectrochemical properties, we used transient photocurrent response measurements to characterize the lifetime and transfer rate of the photogenerated electron–hole pairs. The photocurrents of these samples were recorded in the dark or under visible light illumination from a xenon lamp assembled at 420 nm optical filter, as shown in Fig. 7a. The transient photocurrent response measurements show that the photocurrent of 1.2C-TiO2/MCF-200 is much higher than that of other samples, verifying the lowest recombination efficiency of photogenerated electron–hole pairs. The improvement in photocurrent density is caused by the thermal treatment, which can promote carbon from the surface to the bulk and decrease the surface defects. By contrast, under visible light illumination, the 1.2C-TiO2/MCF-300 and 1.2C-TiO2/MCF-400 electrodes, all had a significant decrease of photocurrent density compared to 1.2C-TiO2/MCF. That is, once the thermal treatment temperature is higher than the optimum value, it will cause the catalyst to lose surface carbon and the doping carbon species. When the temperature reaches up to 400 °C, all the carbon, whether covering the surface or doped in the bulk of TiO2, will be burned off. The result of transient photocurrent responses is in good accordance with the photocatalytic activity result. Hence, we can conclude that the synergistic effect between carbon doping and surface carbon coverage is the key to increase the solar absorption and photocatalytic activity of 1.2C-TiO2/MCF-200 composites. The presence of the Ti–C bond indicates that the oxygen atoms in TiO2 are substituted by C atoms, and a narrow substitute band is formed above the valence band (VB) (Fig. 7b). The photogenerated electrons easily transfer from the carbon dopant over to the conduction band (CB). Simultaneously, under visible light illumination, the photogenerated electrons transfer from coke carbon to the CB of TiO2 as shown in Fig. 7b. The electrons and holes further react with O2 or H2O to generate the active groups, such as the superoxide radical and hydroxyl radicals, which are responsible for the observed high photocatalytic activity of 1.2C-TiO2/MCF-200.
 |
| | Fig. 7 Transient photocurrent responses for different samples (a); schematic representation of the photocatalytic reaction on C-TiO2/MCF-200 (b). | |
4. Conclusions
In summary, we have employed hydrothermal and thermal treatment methods to prepare an efficient visible-light-driven C-modified TiO2/MCF photocatalyst. This method can bring about dramatic changes in the structural, optical, electronic and chemical properties of the catalyst. These C-modified TiO2/MCF composites have displayed much higher photocatalytic activities than TiO2/MCF composites due to the synergistic effects between the reduction of the band gap caused by the doped carbon and the photosensitization caused by the surface carbon. We believe that this novel photocatalyst has good application prospects in photocatalytic water splitting, dye-sensitized solar cells, air purification and other fields.
Acknowledgements
This work has been supported by the National Natural Science Foundation of China (21203062, 21173077, 21377038, 21237003), the National Basic Research Program of China (973 Program, 2013CB632403), the Research Fund for the Doctoral Program of Higher Education (20120074130001) and the Fundamental Research Funds for the Central Universities.
Notes and references
- Y. Park, W. Kim, H. Park, T. Tachikawa, T. Majima and W. Choi, Appl. Catal., B, 2009, 91, 355–361 CrossRef CAS PubMed.
- M. Xing, J. Zhang, F. Chen and B. Tian, Chem. Commun., 2011, 47, 4947–4949 RSC.
- T. Kamegawa, S. Matsuura, H. Seto and H. Yamashita, Angew. Chem., Int. Ed., 2013, 52, 916–919 CrossRef CAS PubMed.
- N. Sakaguchi, S. Matsuo, T. Kurisaki, T. Matsuo and H. Wakita, Res. Chem. Intermed., 2006, 32, 95–101 CrossRef CAS PubMed.
- C. Yang, Z. Wang, T. Lin, H. Yin, X. Lü, D. Wan, T. Xu, C. Zheng, J. Lin, F. Huang, X. Xie and M. Jiang, J. Am. Chem. Soc., 2013, 135, 17831–17838 CrossRef CAS PubMed.
- M. Xing, J. Zhang, B. Qiu, B. Tian, M. Anpo and M. Che, Small, 2014 DOI:10.1002/smll.201403056.
- J. Yu, J. Low, W. Xiao, P. Zhou and M. Jaroniec, J. Am. Chem. Soc., 2014, 136, 8839–8842 CrossRef CAS PubMed.
- J. Schneider, M. Matsuoka, M. Takeuchi, J. Zhang, Y. Horiuchi, M. Anpo and D. W. Bahnemann, Chem. Rev., 2014, 114, 9919–9986 CrossRef CAS PubMed.
- X. Chen, S. Shen, L. Guo and S. S. Mao, Chem. Rev., 2010, 110, 6503–6570 CrossRef CAS PubMed.
- R. Bauer and H. Fallmann, Res. Chem. Intermed., 1997, 23, 341–354 CrossRef CAS PubMed.
- H. Zhang, X. Lv, Y. Li, Y. Wang and J. Li, ACS Nano, 2009, 4, 380–386 CrossRef PubMed.
- R. Asahi, T. Morikawa, T. Ohwaki, K. Aoki and Y. Taga, Science, 2001, 293, 269–271 CrossRef CAS PubMed.
- M. Takeuchi, M. Matsuoka and M. Anpo, Res. Chem. Intermed., 2012, 38, 1261–1277 CrossRef CAS.
- Z. Lin, A. Orlov, R. M. Lambert and M. C. Payne, J. Phys. Chem. B, 2005, 109, 20948–20952 CrossRef CAS PubMed.
- G. Liu, H. G. Yang, X. Wang, L. Cheng, H. Lu, L. Wang, G. Q. Lu and H.-M. Cheng, J. Phys. Chem. C, 2009, 113, 21784–21788 CAS.
- I. Nakamura, S. Sugihara and K. Takeuchi, Chem. Lett., 2000, 29, 1276–1277 CrossRef.
- B. Qiu, M. Xing and J. Zhang, J. Am. Chem. Soc., 2014, 136, 5852–5855 CrossRef CAS PubMed.
- M. Xing, X. Li and J. Zhang, Sci. Rep., 2014, 4, 5493–5499 Search PubMed.
- T. H. Kim, C. Gómez-Solís, E. Moctezuma and S. W. Lee, Res. Chem. Intermed., 2014, 40, 1595–1605 CrossRef CAS PubMed.
- I.-C. Kang, Q. Zhang, S. Yin, T. Sato and F. Saito, Appl. Catal., B, 2008, 80, 81–87 CrossRef CAS PubMed.
- D. Qi, M. Xing and J. Zhang, J. Phys. Chem. C, 2014, 118, 7329–7336 CAS.
- F. Dong, S. Guo, H. Wang, X. Li and Z. Wu, J. Phys. Chem. C, 2011, 115, 13285–13292 CAS.
- S. U. M. Khan, M. Al-Shahry and W. B. Ingler, Science, 2002, 297, 2243–2245 CrossRef CAS PubMed.
- S. Sakthivel and H. Kisch, Angew. Chem., Int. Ed., 2003, 42, 4908–4911 CrossRef CAS PubMed.
- Y. Cong, J. Zhang, F. Chen, M. Anpo and D. He, J. Phys. Chem. C, 2007, 111, 10618–10623 CAS.
- J. Zhang, Y. Wu, M. Xing, S. A. K. Leghari and S. Sajjad, Energy Environ. Sci., 2010, 3, 715–726 CAS.
- J. Zhong, F. Chen and J. Zhang, J. Phys. Chem. C, 2009, 114, 933–939 Search PubMed.
- J. Fan, X. Jiang, H. Min, D. Li, X. Ran, L. Zou, Y. Sun, W. Li, J. Yang, W. Teng, G. Li and D. Zhao, J. Mater. Chem. A, 2014, 2, 10654–10661 CAS.
- Y. Kuwahara, K. Maki, Y. Matsumura, T. Kamegawa, K. Mori and H. Yamashita, J. Phys. Chem. C, 2009, 113, 1552–1559 CAS.
- K. Fuku, R. Hayashi, S. Takakura, T. Kamegawa, K. Mori and H. Yamashita, Angew. Chem., Int. Ed, 2013, 52, 7446–7450 CrossRef CAS PubMed.
- H.-C. Yang, H.-Y. Lin, Y.-S. Chien, J. C.-S. Wu and H.-H. Wu, Catal. Lett., 2009, 131, 381–387 CrossRef CAS.
- M. Xing, D. Qi, J. Zhang, F. Chen, B. Tian, S. Bagwas and M. Anpo, J. Catal., 2012, 294, 37–46 CrossRef CAS PubMed.
- C. Li and P. C. Stair, Catal. Today, 1997, 33, 353–360 CrossRef CAS.
- Y. Wu, M. Xing and J. Zhang, J. Hazard. Mater., 2011, 192, 368–373 CAS.
- C. Lettmann, K. Hildenbrand, H. Kisch, W. Macyk and W. F. Maier, Appl. Catal., B, 2001, 32, 215–227 CrossRef CAS.
- D.-e. Gu, Y. Lu, B.-c. Yang and Y.-d. Hu, Chem. Commun., 2008, 21, 2453–2455 RSC.
- S. K. Parayil, H. S. Kibombo, C.-M. Wu, R. Peng, J. Baltrusaitis and R. T. Koodali, Int. J. Hydrogen Energy, 2012, 37, 8257–8267 CrossRef CAS PubMed.
|
| This journal is © The Royal Society of Chemistry 2015 |
Click here to see how this site uses Cookies. View our privacy policy here. 


