Synthesis of magnetic graphene oxide-containing nanocomposite hydrogels for adsorption of crystal violet from aqueous solution

Ali Pourjavadi*, Mojtaba Nazari and Seyed Hassan Hosseini
Polymer Research Laboratory, Department of Chemistry, Sharif University of Technology, Tehran, Iran. E-mail: purjavad@sharif.edu; Fax: +98 2 166165311; Tel: +98 2 166165311

Received 26th December 2014 , Accepted 10th March 2015

First published on 16th March 2015


Abstract

Magnetic nanocomposite hydrogels containing different amounts of graphene oxide were synthesized and characterized by FTIR, XRD, TGA, SEM, TEM, VSM and UV-vis spectroscopy. The prepared hydrogels were used as adsorbents for removal of a cationic dye, crystal violet, from water. The kinetics and isotherm of adsorption and the effect of different experimental conditions such as graphene oxide content, pH of the solution, contact time, adsorbent dosage and initial dye concentration on adsorption capacity were then investigated. Parameters related to kinetics and isotherm models were calculated and discussed. It was found that adsorption is well-described by pseudo-second-order kinetics and Langmuir isotherm models, respectively. The synthesized adsorbents showed high efficiency in removal of crystal violet and a very high adsorption capacity was obtained (769.23 mg g−1). No significant loss of removal efficiency was observed even after five cycles of adsorption.

Introduction

Dyes are organic colorant compounds that are extensively used in many different industrial fields such as textiles, tanning, paper, food and cosmetics.1,2 Discharge of dyes into the environment can contaminate underground water and cause serious health and biological problems. Crystal violet (CV) is a common cationic dye which belongs to the triphenylmethane group. This dye is widely used as a colorant, biological stain and veterinary medicine. CV has been found to have harmful effects on humans and has been suspected to cause cancer.3 Therefore, it is very important to separate and remove dyes from wastewater. There are many different methods for removal of dyes from water such as adsorption,4 photodegradation,5 coagulation,6 ion exchange7 and membrane filtration.8 However, adsorption is the most attractive method because of its high efficiency, ease of operation and cost effectiveness. A wide range of different organic and inorganic adsorbents such as activated carbon,9 clays,10 carbon nanotubes,11 and polymeric materials12,13 have been prepared and used for dye adsorption. However, in many cases, the prepared adsorbents have low surface area, low adsorption capacity and weak mechanical strength in severe conditions. Therefore, it is still necessary to develop mechanically strong adsorbents with high efficiency.

Polymeric hydrogels are very attractive for dye adsorption since water can easily diffuse through the hydrophilic polymer network and dissolved dyes can interact strongly with numerous functional groups present in the structure of polymer chains. The adsorption of dyes strongly depends on the structure and composition of the hydrogels. Polymeric hydrogels with different compositions have been used for adsorption of cationic and anionic dyes.14–16 Hydrogels with negative charges in their structures are effective in removal of cationic dyes, while positively charged hydrogels are appropriate for removal of anionic dyes.14 Zwitterionic hydrogels can be used for both cationic and anionic dyes.12 However, weak mechanical strength of the hydrogels is one of their drawbacks that limits the application of hydrogels especially for repeated cycles of adsorption. In many cases hydrogels are filled with inorganic materials to improve their mechanical properties. Clays17 and carbonaceous materials such as carbon nanotube,18 and graphene19 have been used for this purpose. It was also found that the presence of inorganic materials increases adsorption capacity of dyes.20

Graphene oxide (GO) is a carbonaceous material that have attracted much attention in recent years.21,22 GO is produced by oxidation of graphite which leads to introducing different oxygen-containing functional groups such as hydroxyl, epoxy and carbonyl groups. These functional groups can interact with dye molecules through hydrogen bonds and electrostatic interactions. These properties make GO a good candidate for dye adsorption.

Incorporating of GO into hydrogels leads to the formation of nanocomposite adsorbents with high mechanical strength.23 The presence of GO not only improves physical properties of hydrogel but also increases its adsorption capacity. Although it has been shown that GO itself and also polymeric hydrogels can be used as dye adsorbents,24–26 synthesis of GO-based nanocomposites can combine properties of both GO and hydrogels. As a result, adsorbents with high mechanical strength and adsorption capacity could be obtained. Although GO and its polymeric nanocomposites have being studied extensively in recent years, there are few reports in the field of GO–hydrogel nanocomposites for dye adsorption.

Considering the advantages of GO and magnetic nanoparticles, in this paper we are going to prepare hydrogel nanocomposites containing these two inorganic materials. Since there are many polar functional groups on the surface of GO and because of its high specific surface area, it is expected that the presence of GO increases adsorption capacity of the hydrogel. It also can act as reinforcement filler which increases mechanical strength of hydrogels, as reported by Fan et al.23 The presence of magnetic nanoparticles in the structure of hydrogels facilitates separations of the hydrogels so that they can be separated easily after adsorption process by using a magnet.27,28

Herein, we report synthesis and characterization of a novel magnetic nanocomposite hydrogel containing GO. The nanocomposite has consisted of hydrogel in which GO sheets and magnetic iron oxide nanoparticles are entrapped. The polymeric network of hydrogel is composed of a natural polymer, starch, and a hydrophilic polymer, poly(2-acrylamido-2-methylpropane sulfonic acid) (PAMPS). The synthesized nanocomposite was used as a dye adsorbent and its ability for removal of CV was studied. The effect of different experimental conditions on dye adsorption was also investigated.

Materials and methods

Materials

Graphite powders were obtained from Aldrich. 2-Acrylamido-2-methylpropane sulfonic acid (AMPS), ammonium persulfate (APS), N,N′-methylenebisacrylamide (MBA), tetraethylorthosilicate (TEOS) and starch were purchased from Merck and used without further purification.

Fourier transform infrared (FTIR) spectra were collected on an ABB Bomem MB 100 spectrophotometer. Scanning electron microscopy (SEM) images were taken on Philips, XL30 instrument. Transmission electron microscopy (TEM) images were taken using a Philips CM30 electron microscope. X-ray diffraction (XRD) patterns were recorded on a Siemens D5000 (Germany) diffractometer with monochromatized Cu Kα radiation. Thermogravimetric analysis (TGA) was conducted using a Perkin Elmer Pyris1 instrument from 30 to 600 °C with heating rate of 10 °C min−1 under nitrogen atmosphere. Magnetization measurements were performed by a model 7400 vibrating sample magnetometer (VSM). UV-vis spectroscopy was performed using a Perkin Elmer lambda 25 spectrophotometer.

Synthesis of GO

GO was synthesized by oxidation of natural graphite powder according to an improved Hummers method.29 In a typical run, 1 g graphite was weighted in a round bottom flask and 120 mL H2SO4 and 13 mL H3PO4 were added to it. The flask was put in an oil bath and 6 g KMnO4 was gradually added at 50 °C. After 12 hours stirring, the flask was cooled to 0 °C and 200 mL water and 3 mL H2O2 were added to the flask. The resulting product was washed three times with HCl solution (5% wt) and five times with water and then dried at 50 °C.

Synthesis of silica coated magnetic nanoparticles (MNP@SiO2)

At first, Fe3O4 magnetic nanoparticles (MNPs) were synthesized by co-precipitation of FeCl2·4H2O and FeCl3·6H2O at pH = 10. The resulting black particles were then coated with silica. 2 g of the synthesized MNPs were dispersed in 250 mL ethanol–water (4[thin space (1/6-em)]:[thin space (1/6-em)]1) solution in a round bottom flask. 15 mL TEOS was added and the pH of the solution was adjusted to 10 by using ammonia solution. The mixture was refluxed at 70 °C for 12 h. After cooling to room temperature, the product was washed several times with water and dried at 50 °C.

Synthesis of GO–hydrogel nanocomposites

0.25 g MNP@SiO2 and a known amount of GO were dispersed in 10 mL water by sonication for 30 minutes. Then, 0.25 g starch, 2.5 g AMPS (neutralized with NaOH) and 0.05 g MBA were added and the flask was placed in an oil bath. APS (0.05 g) was added to the flask and polymerization was performed at 70 °C and a hydrogel was obtained after 1 h. After cooling to room temperature, the product was deswelled in acetone, dried at 50 °C and was ground and sieved through an 80-mesh sieve for further use.

Dye adsorption

Dye adsorption experiments were performed by a batch process at room temperature. Dye solutions (20 mg L−1) were prepared by dissolving CV in water. The pH values of the solutions were not adjusted except for investigating the effect of pH on dye adsorption. 10 mg of the powdered composites was added to 40 mL dye solution and the mixture was stirred at 500 rpm. A small amount of solution was taken in defined time intervals and the concentration of dye was determined by UV-vis spectroscopy using standard calibration curve. Measurements were conducted at λmax of CV (590 nm). All dye adsorption experiments were performed as mentioned here, unless otherwise noted. Adsorption capacity (qe) and removal efficiency (R) are obtained as the following equations:
 
image file: c4ra17103a-t1.tif(1)
 
image file: c4ra17103a-t2.tif(2)
where qe is adsorption capacity (mg g−1), C0 and Ce are initial and equilibrium concentration of dye (mg L−1), respectively, V is volume of the solution (L), and m is the mass of the adsorbent (g). C0 and Ce are initial and equilibrium dye concentrations (mg g−1), respectively.

Results and discussion

Synthesis of adsorbent

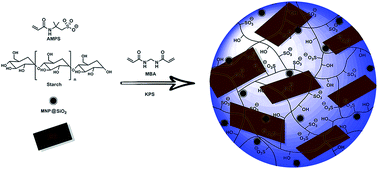
The hydrogel was prepared by graft copolymerization of AMPS onto the starch in the presence of MBA as crosslinker. MNPs were also used to induce magnetic properties in the hydrogels and to facilitate separation of adsorbent after adsorption process. MNPs were already coated with a layer of silica to enhance their stability in severe conditions and to prevent agglomeration of MNPs. As an anionic monomer, AMPS is able to interact with positively charged molecules through electrostatic interactions. Using starch introduces more hydroxyl groups in the structure of hydrogels and increases interaction with dyes. Moreover, the presence of starch as a natural polymer makes hydrogels more biodegradable and eco-friendly. In order to investigate the effect of GO on dye adsorption of the hydrogels, nanocomposites with different amounts of GO were prepared. The amounts of GO used for preparation of hydrogel/GO nanocomposites (HGO) are listed in Table 1.
Table 1 GO content of hydrogel/GO nanocomposites (HGO)
Sample name GO
g %
HGO0 0 0
HGO1 0.03 1
HGO3 0.09 3
HGO5 0.15 5
HGO7 0.21 7


Polymerization was performed in the presence of GO and a hydrogel was formed while GO sheets were entrapped into the polymer network, as illustrated in Fig. 1. Since there are many polar functional groups in the structure of GO and also because of its sheet-like structure, it is expected that GO promote dye adsorption.


image file: c4ra17103a-f1.tif
Fig. 1 Preparation of magnetic GO/hydrogel nanocomposite.

The prepared hydrogels contain about 8 wt% starch in their structure. As a natural polysaccharide possessing D-glucose units, the presence of starch makes the prepared hydrogels more biodegradable. There are many reports in the literature in which starch was used in combination with synthetic monomers to produce biodegradable hydrogels.30 Moreover, GO has also been recognized as a safe and non toxic material. Considering all these parameters the prepared hydrogels can be considered as an environmentally friendly adsorbent.

Characterization

XRD patterns of graphite, GO, MNPs and HGO1 are shown in Fig. 2. Graphite shows a very sharp diffraction peak at 2 theta value of 26° which is indexed to (002) plane with interlayer d-spacing of 3.4 Å. The XRD peak shifts downward to 2 theta value of 12°, after oxidation to GO (Fig. 2b) and interlayer d-spacing increases to 8 Å due to the entering different functional groups and intercalation of water molecules between GO layers. XRD pattern of MNPs (Fig. 2c) shows six peaks appeared at 2 theta values about 30, 36, 43, 53, 57 and 62° corresponding to (220), (311), (400), (422), (511) and (440) planes, respectively. The six characteristic peaks of Fe3O4 are also present in the XRD pattern of HGO1 (Fig. 2d). The broad peak appeared in 2 theta range of 20 to 30° is related to amorphous silica layer. The absence of characteristic peak of GO at 2 theta value of 12° implies that GO was completely intercalated by polymeric chains and its crystalline structure was destroyed.
image file: c4ra17103a-f2.tif
Fig. 2 XRD pattern of graphite (a), GO (b), MNPs (c) and HGO1 (d).

UV-vis spectrum of GO (Fig. S1a of ESI) shows a peak at 229 nm which is related to π → π* transitions of aromatic rings, and also a shoulder at 237 nm which is related to n → π* transitions of carbonyl groups. The results indicate that graphite was successfully oxidized to GO. Elemental composition of GO was determined by CHN analysis and it was obtained that C, H and O content of GO is about 42, 3 and 55%, respectively. SEM (Fig. S1b of ESI) and TEM (Fig. S1c of ESI) images of GO shows that GO is composed of thin, large and wrinkled sheets with folded structure.

TEM image of MNP@SiO2 is also shown in Fig. S1d of ESI. Nanoparticles with average size about 10 nm and a narrow size distribution are observed. The grey shells are related to the silica layer coated on MNPs.

FTIR spectra of GO, MNPs, MNP@SiO2 and GO–hydrogel nanocomposite are shown in Fig. 3. Peaks appeared at 3400, 1700, 1250 and 1050 cm−1 in the spectrum of GO (Fig. 3a) are related to O–H, C[double bond, length as m-dash]O, C–O–C and C–O stretching vibrations, respectively. FTIR spectrum of MNPs (Fig. 3b) shows a strong peak at 670 cm−1 which is related to Fe–O stretching vibration. After reaction with TEOS, a new intensive peak is appeared at 1100 cm−1, attributing to Si–O stretching, and indicates that silica was successfully coated on MNPs (Fig. 3c). The additional peaks appeared in the FTIR spectrum of magnetic GO–hydrogel nanocomposite (Fig. 3d) are related to various functional groups present in the structure of hydrogel.


image file: c4ra17103a-f3.tif
Fig. 3 FTIR spectra of GO (a), MNP (b), MNP@SiO2 (c) and HGO1 (d).

TGA spectra of hydrogels with and without GO are illustrated in Fig. 4. The weight loss at about 100 °C is attributed to the removal of adsorbed water molecules. Thermal degradation of both the samples occurs at two stages and about 70% weight loss was observed up to 600 °C. The onset of weight loss is at 280 °C for HGO0 and at 320 °C for HGO1 which indicates the presence of GO enhances thermal stability of hydrogels.


image file: c4ra17103a-f4.tif
Fig. 4 TGA spectra of HGO0 (a) and HGO1 (b).

SEM and TEM images of hydrogel are shown in Fig. 5 and in S2 of ESI. SEM image shows that the synthesized hydrogels are porous and there are many pores with different sizes in their structure. The porosity of polymer is very important in adsorption process, because it increases surface area and enhances adsorption capacity. Porosity also affects on the rate of water diffusion. Water, and as a consequence the dyes dissolved in it, can easily diffuse through the porous structure of hydrogels and interact with functional groups present in the polymeric network. TEM image of hydrogel nanocomposite (Fig. 5a) shows that magnetic nanoparticles with narrow size distribution are present in the structure of nanocomposite. These nanoparticles with sizes about 10 nm are well-dispersed in the polymeric matrix of hydrogel.


image file: c4ra17103a-f5.tif
Fig. 5 TEM (a) and SEM (b) image of hydrogel nanocomposites.

Magnetization curve of the prepared MNPs and nanocomposite hydrogels are shown in Fig. 6. Magnetic hysteresis loop of both samples exhibits superparamagnetic characteristic at room temperature. Saturation magnetization of MNP@SiO2 is about 65 emu g−1. Entrapment of MNP@SiO2 into the hydrogel reduces saturation magnetization to about 22 emu g−1. However it is still enough for magnetic separation of particles as can be seen from the inset of Fig. 6.


image file: c4ra17103a-f6.tif
Fig. 6 Magnetization curve of MNPs (a) and hydrogel nanocomposite (b) (the inset shows magnetic separation of adsorbents from dye solution).

Dye adsorption

The synthesized hydrogels were used as dye adsorbents and their ability for dye adsorption was studied. The dye used here is CV which its structure is shown in Fig. S3 of ESI. Adsorption of CV from aqueous solution using hydrogels with different GO content was investigated. As shown in Fig. 7, the hydrogel without GO (HGO0) adsorbed CV to a maximum value of qe = 67 mg g−1. The hydrogel synthesized here contains many polar functional groups such as sulfonate and hydroxyl groups which are able to absorb dyes through electrostatic interactions and hydrogen bonds.
image file: c4ra17103a-f7.tif
Fig. 7 The effect of GO content on adsorption capacity.

The results depicted in Fig. 7 shows that the presence of GO increases dye adsorption significantly. The adsorption capacity of dye is 77.07 mg g−1 for hydrogel containing 1% GO (HGO1). The dye used in this experiment is CV which is a cationic dye. GO contains many functional groups which are able to interact with dye molecules. Negatively charged carboxylate groups on the surface of GO can interact with the cationic dye molecules through electrostatic attraction forces. Other polar oxygen-containing functional groups on the surface of GO interact with dyes too. For example hydroxyl groups can form hydrogen bonds with dye molecules. There are also aromatic non-functionalized regions in the structure of GO that affect on dye adsorption through π–π interactions. Another important property of GO is its high specific surface area which strongly affects on adsorption. Incorporation of GO into the hydrogels provides more surface area and facilitate dye adsorption. Although increasing GO content from 1% to 3% and 5% increased adsorption capacity, the differences were not significant. However, further increasing of GO content to 7%, reduced adsorption capacity considerably. Based on the results obtained in this part, we chose HGO1 for further experiments.

Effect of pH

Adsorption measurements were performed in 50 mg L−1 dye solutions with different pH adjusted by addition of HCl or NaOH solutions (0.01 N). As is shown in Fig. 8a, adsorption capacity decreased with increasing pH. Electrostatic interaction is a very important parameter which can strongly affect on adsorption process. The adsorbent contains many sulfonate groups which, as a conjugated base of a strong acid, remain ionized at pH ranges of the experiment. In contrast, the molecules of CV contain tertiary amine groups and are cationic in acidic media, but are neutral and non-ionic in alkaline solutions. As a consequence, by increasing pH, the number of protonated cationic groups of dyes, and thus electrostatic interaction with adsorbent, decreases which reduces dye adsorption.
image file: c4ra17103a-f8.tif
Fig. 8 The effect of pH (a), initial dye concentration (b), adsorbent dosage (c) and contact time (d) on adsorption capacity.

Effect of initial dye concentration

The effect of initial concentration of dye on adsorption capacity was evaluated and the results are shown in Fig. 8b. Dye adsorption increased continuously from 77.07 to 712.09 mg g−1 as the initial dye concentration increases in the range of 20 to 250 mg L−1. It should be due to the fact that the driving force to overcome the mass transfer resistance of dye molecules from aqueous phase to solid phase is greater in higher dye concentrations.31 It should be noted that the rate of increase in adsorption capacity decreases and finally reaches to a constant value by further increasing of initial dye concentration.

Effect of adsorbent dosage

Removal of CV from solution was also investigated using different amounts of adsorbent. Experiments were performed in a 50 mg L−1 dye solution. As shown in Fig. 8c, an increase in adsorbent dosage leads to a significant decrease in adsorption capacity. By increasing adsorbent dosage from 10 to 90 mg, adsorption capacity continuously decreased from 180 to 20 mg g−1. This observation is attributed to the splitting effect of flux or concentration gradient between dye molecules and adsorbent.32

Effect of contact time

Fig. 8d shows the effect of contact time on adsorption of CV on the adsorbents. It can be seen that adsorption capacity increases rapidly at the initial stages of adsorption. Adsorption is very fast in the first 15 minutes of the experiment and then increases slowly and reaches to equilibrium after 2 h. This is because vacant surface sites of the adsorbents are blocked within the first stages of the adsorption and thus diffusion and adsorption of further dye molecules becomes more difficult.

Adsorption kinetic

Pseudo-first-order and pseudo-second-order models were employed to describe the kinetic of adsorption. Lagergren pseudo-first-order33 and Ho pseudo-second-order34 models are expressed as eqn (3) and (4), respectively:
 
image file: c4ra17103a-t3.tif(3)
 
image file: c4ra17103a-t4.tif(4)
where qe and qt are adsorption capacity (mg g−1) at equilibrium and at time t (min) respectively, and k1 and k2 are pseudo-first-order constant (min−1) and pseudo-second-order rate constant (g mg−1 min−1), respectively.

The kinetic parameters for the two models were determined and listed in Table 2. The results show that the correlation coefficient (R2) for the pseudo-first-order model is very low, and there is a large difference between calculated adsorption capacity (qcalc) and experimental value (qexp). The plots of pseudo-first-order and pseudo-second-order kinetic models are shown in Fig. S4 of ESI. As shown in this figure, experimental data are better fitted with pseudo-second-order kinetic model. Coefficient factor for this model is very high (R = 0.999) and calculated adsorption capacity is in good agreement with experimental value.

Table 2 Kinetic parameters for pseudo-first-order and pseudo-second-order models
Kinetic model Parameters qexp mg g−1
K1 min−1 K2 g mg−1 min−1 qe mg g−1 R2
Pseudo-first-order 0.0507   20.94 0.482 77.07
Pseudo-second-order   0.0094 76.92 0.999 77.07


Adsorption isotherm

The isotherm of CV adsorption on the nanocomposite hydrogels was studied by calculating adsorption capacity as a function of dye equilibrium concentration. The experimental data were analyzed by using Langmuir and Freundlich isotherm models. In Langmuir isotherm, the adsorbent surface is considered homogeneous with identical and energetically equivalent sorption sites. Langmuir model is expressed as follows:35
 
image file: c4ra17103a-t5.tif(5)
where Ce is dye equilibrium concentration (mg g−1), KL is Langmuir adsorption constant related to the energy of adsorption (L mg−1), qm is maximum adsorption capacity (mg g−1).

Freundlich isotherm model is based on adsorption on heterogeneous adsorption surface and is expressed as follows:36

 
image file: c4ra17103a-t6.tif(6)
where Ce is dye equilibrium concentration (mg L−1), KF is Freundlich constant (L g−1) and n is heterogeneity factor.

The related parameters for the two models were calculated and are represented in Table 3. Higher coefficient factor of Langmuir isotherm (R2 = 0.974), implies that this model provides a better fit of the experimental data and properly describes adsorption equilibrium of CV on the prepared adsorbents. The curve related to Langmuir and Freundlich isotherm equations are shown in Fig. S5 of ESI.

Table 3 Isotherm parameters for Langmuir and Freundlich models
Isotherm model Parameters n R2
KF mg g−1 (L mg−1)1/n KL L mg−1 qm mg g−1
Langmuir   0.325 769.23   0.974
Freundlich 7.6     3.45 0.818


A dimensionless constant called the equilibrium parameter (RL) is used to predict whether an adsorption system is favorable or unfavorable. This constant is defined as:37

 
image file: c4ra17103a-t7.tif(7)
where KL and C0 are Langmuir adsorption constant and initial dye concentration, respectively. The value of RL indicates the adsorption process to be either unfavorable (RL > 1), linear (RL = 1), favorable (0 < RL < 1), or irreversible (RL = 0). The values of RL at different initial CV concentrations are shown in Fig. S6 of ESI. It is clear that the RL values are between 0 and 1 indicating adsorption of CV on prepared adsorbents is favorable.

Recycling study

In order to study reusability of the adsorbents, the particles were separated after adsorption process by using a magnet. The dyes were desorbed by 2 h stirring in 20 mL acetone and the adsorbents were dried at 40 °C. The recycled adsorbents were used for next adsorption runs. The results of recycling experiment for 5 cycles are shown in Fig. 9. It is observed that about 96% of the dyes were removed after the first cycle. As is shown in Fig. 9, the removal efficiency did not change significantly even after five cycles of adsorption–desorption. The presence of magnetic nanoparticles facilitates separation and recycling of adsorbents, as shown in the inset of Fig. 6.
image file: c4ra17103a-f9.tif
Fig. 9 Reusability of the adsorbents.

Comparison with other adsorbents

For a better understanding of the adsorption ability of the prepared particles, we compared the results obtained here with some other adsorbents that have been used for CV removal. Langmuir maximum adsorption capacity and conditions used for adsorption experiment are listed in Table 4. It can be seen that the adsorbent used in this study shows much higher adsorption capacity than the other adsorbents. Considering other parameters such as contact time and pH of the solution reveals that the adsorbent prepared here can be considered as a suitable and highly efficient adsorbent for CV.
Table 4 Comparison with other adsorbents
Adsorbent Contact time min qm mg g−1 pH References
a Semi-IPN hydrogels constituted of poly(acrylic acid-acrylamide-methacrylate) and amylase.b Cellulose modified with glycidyl methacrylate and sulfosalicylic acid.
Semi-IPN poly(AA-AAm-MA)/amylosea 3000 35.09 7.4 38
Sulfated MCM-41 150 138.7 7 39
Palm kernel fiber 60 78.9 7.2 40
Kaoline 5 47.27 7 41
PAA bound magnetic nanoparticles 1 116 6 42
CGSb 150 182.15 9 43
Cu(II)-loaded montmorillonite 300 114.3 8.2 44
Magnetic GO/hydrogel nanocomposite 120 769.23 7 This study


For being used in large scale water purification, an adsorbent should have low cost, high adsorption capacity, high mechanical strength and reusability. Hydrogels can be considered as a good candidate for dye adsorption since they can be prepared from low cost materials such as natural polysaccharides. The presence of fillers which increase the mechanical strength of the hydrogels and facilitate their reusability can enhance the potential using of hydrogels practically.

Conclusions

In summary, we have synthesized GO-containing polymeric nanocomposites which are composed of crosslinked PAMPS and starch. The prepared hydrogels were used as adsorbents for removal of CV and a very high adsorption capacity (769.23 mg g−1) was obtained. The results also revealed that the presence of GO has a significant effect on adsorption capacity. The effect of other experimental conditions such as pH of the solution, contact time, adsorbent dosage and initial dye concentration on adsorption capacity were also investigated. Adsorption capacity increased with increasing contact time and initial dye concentration and decreasing pH and adsorbent dosage. Study of the kinetic and isotherm of adsorption indicated that dye adsorption is well-described by pseudo-second-order and Langmuir models, respectively. The adsorbents were regenerated and reused for several cycles of adsorption–desorption and no significant reduction in removal efficiency was observed even after 5 cycles.

References

  1. K. Singh and S. Arora, Crit. Rev. Environ. Sci. Technol., 2011, 41, 807–878 CrossRef CAS .
  2. A. Anastasi, V. Prigione and G. C. Varese, J. Hazard. Mater., 2010, 177, 260–267 CrossRef CAS PubMed .
  3. Q. Zhang, T. Zhang, T. He and L. Chen, Appl. Clay Sci., 2014, 90, 1–5 CrossRef CAS PubMed .
  4. M. Arulkumar, P. Sathishkumar and T. Palvannan, J. Hazard. Mater., 2011, 186, 827–834 CrossRef CAS PubMed .
  5. C. Tian, Q. Zhang, A. Wu, M. Jiang, Z. Liang, B. Jiang and H. Fu, Chem. Commun., 2012, 48, 2858–2860 RSC .
  6. A. K. Verma, R. R. Dash and P. Bhunia, J. Environ. Manage., 2012, 93, 154–168 CrossRef CAS PubMed .
  7. M. Greluk and Z. Hubicki, Chem. Eng. J., 2010, 162, 919–926 CrossRef CAS PubMed .
  8. S. Cheng, D. L. Oatley, P. M. Williams and C. J. Wright, Water Res., 2012, 46, 33–42 CrossRef CAS PubMed .
  9. G. Mezohegyi, F. P. van der Zee, J. Font, A. Fortuny and A. Fabregat, J. Environ. Manage., 2012, 102, 148–164 CrossRef CAS PubMed .
  10. A. S. Bhatt, P. L. Sakaria, M. Vasudevan, R. R. Pawar, N. Sudheesh, H. C. Bajaj and H. M. Mody, RSC Adv., 2012, 2, 8663–8671 RSC .
  11. A. K. Mishra, T. Arockiadoss and S. Ramaprabhu, Chem. Eng. J., 2010, 162, 1026–1034 CrossRef CAS PubMed .
  12. N. B. Shukla, S. Rattan and G. Madras, Ind. Eng. Chem. Res., 2012, 51, 14941–14948 CrossRef CAS .
  13. E. Yavuz, G. Bayramoğlu, M. Y. Arica and B. F. Senkal, J. Chem. Technol. Biotechnol., 2011, 86, 699–705 CrossRef CAS .
  14. V. V. Panic, Z. P. Madzarevic, T. Volkov-Husovic and S. J. Velickovic, Chem. Eng. J., 2013, 217, 192–204 CrossRef CAS PubMed .
  15. S. Li, H. Zhang, J. Feng, R. Xu and X. Liu, Desalination, 2011, 280, 95–102 CrossRef CAS PubMed .
  16. S. Li, X. Liu, W. Huang, W. Li, X. Xia, S. Yan and J. Yu, Polym. Adv. Technol., 2011, 22, 2439–2447 CrossRef CAS .
  17. C. W. Chang, A. Spreeuwel, C. Zhanga and S. Varghese, Soft Matter, 2010, 6, 5157–5164 RSC .
  18. S. Chatterjee, M. W. Lee and S. H. Woo, Bioresour. Technol., 2010, 101, 1800–1806 CrossRef CAS PubMed .
  19. L. Zhang, Z. Wang, C. Xu, Y. Li, J. Gao, W. Wangc and Y. Liu, J. Mater. Chem., 2011, 21, 10399–10406 RSC .
  20. A. Ü. Metin, H. Çiftçi and E. Alver, Ind. Eng. Chem. Res., 2013, 52, 10569–10581 CrossRef CAS .
  21. Y. Zhu, S. Murali, W. Cai, X. Li, J. W. Suk, J. R. Potts and R. S. Ruoff, Adv. Mater., 2010, 22, 3906–3924 CrossRef CAS PubMed .
  22. D. Chen, H. Feng and J. Li, Chem. Rev., 2012, 112, 6027–6053 CrossRef CAS PubMed .
  23. J. Fan, Z. Shi, M. Lian, H. Li and J. Yin, J. Mater. Chem. A, 2013, 1, 7433–7443 CAS .
  24. F. Liu, S. Chung, G. Oh and T. S. Seo, ACS Appl. Mater. Interfaces, 2012, 4, 922–927 CAS .
  25. Y. Zhou, S. Fu, H. Liu, S. Yang and H. Zhan, Polym. Eng. Sci., 2011, 51, 2417–2424 CAS .
  26. A. Pourjavadi, S. H. Hosseini, F. Seidi and R. Soleyman, Polym. Int., 2013, 62, 1038–1044 CrossRef CAS .
  27. O. V. Kharissova, H. V. R. Dias and B. I. Kharisov, RSC Adv., 2015, 5, 6695–6719 RSC .
  28. Y. F. Lin and C. V. Chang, RSC Adv., 2014, 4, 28628–28631 RSC .
  29. D. C. Marcano, D. V. Kosynkin, J. M. Berlin, A. Sinitskii, Z. Sun, A. Slesarev, L. B. Alemany, W. Lu and J. M. Tour, ACS Nano, 2010, 4, 4806–4814 CrossRef CAS PubMed .
  30. C. Elvira, J. F. Mano, J. San Román and R. L. Reis, Biomaterials, 2002, 23, 1955–1966 CrossRef CAS .
  31. Y. Zhou, M. Zhang, X. Hu, X. Wang, J. Niu and T. Ma, J. Chem. Eng. Data, 2013, 58, 413–421 CrossRef CAS .
  32. A. Metin, H. Çiftçi and E. Alver, Ind. Eng. Chem. Res., 2013, 52, 10569–10581 CrossRef CAS .
  33. S. Lagergren, K. Sven. Vetenskapsakad. Handl., 1898, 24, 1–39 Search PubMed .
  34. Y. S. Ho and G. McKay, Chem. Eng. J., 1998, 70, 115–124 CrossRef CAS .
  35. I. Langmuir, J. Am. Chem. Soc., 1916, 38, 2221–2295 CrossRef CAS .
  36. H. M. F. Freundlich, Z. Phys. Chem., 1906, 57, 385–471 CAS .
  37. T. W. Weber and R. K. Chakravorti, AlChE J., 1974, 20, 228–238 CrossRef CAS .
  38. S. Li, Bioresour. Technol., 2010, 101, 2197–2202 CrossRef CAS PubMed .
  39. P. Monash and G. Pugazhenthi, Adsorption, 2009, 15, 390–405 CrossRef CAS .
  40. G. O. El-Sayed, Desalination, 2011, 272, 225–232 CrossRef CAS PubMed .
  41. B. Nandi, A. Goswami, A. Das, B. Mondal and M. Purkait, Sep. Sci. Technol., 2008, 43, 1382–1403 CrossRef CAS .
  42. M. H. Liao, K. Y. Wu and D. H. Chen, Sep. Sci. Technol., 2005, 39, 1563–1575 CrossRef .
  43. Y. Zhou, M. Zhang, X. Wang, Q. Huang, Y. Min, T. Ma and J. Niu, Ind. Eng. Chem. Res., 2014, 53, 5498–5506 CrossRef CAS .
  44. X. S. Wang and W. Zhang, Sep. Sci. Technol., 2011, 46, 656–663 CrossRef CAS .

Footnote

Electronic supplementary information (ESI) available. See DOI: 10.1039/c4ra17103a

This journal is © The Royal Society of Chemistry 2015
Click here to see how this site uses Cookies. View our privacy policy here.