Xylene sensor based on α-MoO3 nanobelts with fast response and low operating temperature
Dingsheng Jianga,
Ying Wanga,
Wei Weib,
Feng Lia,
Yujia Lib,
Linghui Zhua,
Caihui Fengb,
Caixia Liu*b and
Shengping Ruan*a
aState Key Laboratory on Integrated Optoelectronics, Jilin University, Changchun 130012, China
bCollege of Electronic Science and Engineering, Jilin University, Changchun 130012, China
First published on 28th January 2015
Abstract
A hydrothermal treatment strategy was used to synthesize α-MoO3 nanobelts. X-ray diffraction (XRD) and scanning electron microscopy (SEM) was used to characterize the phase and the morphology of the samples, respectively. The results show the length and the width of the α-MoO3 nanobelts were about 6 μm and 200 nm, respectively. The sensing properties towards various types of gases were tested and heater-type sensors coated with α-MoO3 nanobelts showed excellent performance towards xylene. The sensors achieved a response of 3 to 100 ppm xylene at an operating temperature of 206 °C. The response and recovery time were 7 s and 87 s, respectively.
Introduction
Xylene mainly comes from chemical engineering materials such as painting and adhesive in indoor environments. Even a microscale of xylene has tremendous damage to human beings. In addition, careless oral ingestion of xylene can cause acute pneumonia and cancer. Thus, it is significant to detect and measure the existence and content of xylene. Hitherto, various effective methods, such as solid-state chemical technology,1 micro-fabricated preconcentrator technology,2 and double-layered metal–oxide thin film technology,3 have been used to detect xylene. However, these methods have disadvantages of slow response speed, the use of bulky instruments and are dangerous to the body. Metal oxide semiconductors demonstrate the advantages of low cost, facile method, easy fabrication, fast response and recovery time.Various materials, such as Co3O4 and In2−xNixO3, have been used to detect xylene and exhibited excellent performance.1,3–5 However, they are not satisfactory in response time towards xylene. Therefore, an improvement in response time is urgently needed in the detecting xylene.
α-MoO3 has been investigated and applied in solar cells,6–9 catalysis,10–13 capacitors,14–16 light-emitting diodes,17,18 gas sensors and optical detectors. In recent years, α-MoO3 has been one of the most newly-developed n-type metal oxide semiconductors, which can detect toxic gas. α-MoO3 is an n-type semiconductor with a wide band gap of 3.2 eV and has been investigated for NO2,19 ethanol,20 TMA,21 H2S,22 H2,23 and C2H5OH24 detection. However, to date, there is no report for the detection of xylene using α-MoO3 nano structures.
One dimensional (1D) nanostructure oxide semiconductors, such as nanotubes, nanowires, nanofibers and nanobelts have received considerable attention due to the high ratio of surface to volume. Plenty of methods, such as electrospinning, vapor–solid and hydrothermal synthesis, have been used to prepare 1D nanostructured materials during the past few decades. One-dimension nano-products play an important role in gas sensing owing to their advantages of high surface area. A high ratio of surface to volume can achieve higher response when compared with that of a low surface to volume ratio.
In this study, optimal experimental conditions for synthesizing α-MoO3 nanobelts were researched using a facile hydrothermal method at a low temperature of 180 °C. The gas sensing properties based on α-MoO3 nanobelts materials were investigated for detecting xylene. Heater-type sensors based on α-MoO3 nanobelts performed excellent response, as well as fast response time to xylene at a low operating temperature of 206 °C, which is lower than that of most other sensors.1,5,23,25
Experimental
Synthesis of α-MoO3 nanobelts
All of the chemical reagents were of analytical grade and used without any further purification. In a typical experimental procedure, 0.618 g of ammonium heptamolybdate tetrahydrate ((NH4)6Mo7O24·4H2O) was dissolved into 25 mL of deionized water with continuous stirring to achieve an aqueous solution (0.02 M). Then, 2.5 mL of nitric acid (HNO3) was slowly added dropwise into the aqueous solution. After stirring, the solution was transferred into a Teflon-lined stainless steel autoclave with a 50 mL capacity and underwent hydrothermal treatment for 12/24/36/48 h at 120 °C and 12/24/36/48 h at 180 °C to explore the optimum conditions of the reaction, respectively. After the autoclave was cooled down to room temperature, the white precipitate was separated by centrifugation 5 times using deionized water and ethanol. Then, the precipitate was dried at 60 °C for 12 h. Finally the products were annealed at 300 °C for 2 h at the heating rate of 1 °C min−1 to obtain the light yellow α-MoO3 nanobelts.Characterization
X-ray diffraction patterns were achieved to measure the phase identification and the crystal size (Rigaku TTRIII X-ray diffractometer with Cu Kα 1 radiation (λ = 1.5406 Å) in the range of 20–80°). The morphologies of the samples were investigated using scanning electron microscopy (JEOL JSM-7500F microscope operating at 15 kV).Fabrication and measurement of gas sensors
Sensor devices were fabricated using a similar method used in our previous work.4,26 The prepared products were mixed with deionized water at a weight ratio of 1![[thin space (1/6-em)]](https://www.rsc.org/images/entities/char_2009.gif) :
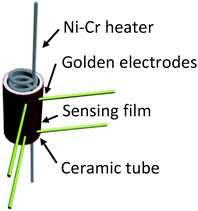
:![[thin space (1/6-em)]](https://www.rsc.org/images/entities/char_2009.gif) 4 and ground for a while. Then, the specimens were coated on the surface of the ceramic tube, which was attached with a pair of parallel golden electrodes using a small brush. The Ni–Cr alloy heating coil was inserted through the ceramic tube. The structure of the sensors is shown in Fig. 1.
4 and ground for a while. Then, the specimens were coated on the surface of the ceramic tube, which was attached with a pair of parallel golden electrodes using a small brush. The Ni–Cr alloy heating coil was inserted through the ceramic tube. The structure of the sensors is shown in Fig. 1.
The working temperature was measured by the electric current, which were produced by a CGS-8 Intelligent Gas Sensing Analysis System (Beijing Elite Tech Co., Ltd., China). The test gases were injected using micro-injections from air bags. The response of the gas sensors was expressed and measured as Ra (the resistance of the sensors in air)/Rg (the resistance of the sensor in the test gas). The response time was defined as the period in which the resistance of the sensors reached 90% from 10% of the steady-state value when exposed to the test gases, while the recovery time was defined as the period in which the resistance of sensors reached 10% from 90% of the steady-state value after exposure to oxygen.27
Results and discussion
Materials characterizations
Fig. 2(A–H) shows the morphologies of the samples, which were calcined at 300 °C for 2 h after hydrothermal treatment for 12/24/36/48 h at 180 °C and 12/24/36/48 h at 120 °C, respectively. As shown in Fig. 2(E–H), the morphologies of the samples were needle-like with hydrothermal treatment for 12/24/36/48 h at 120 °C. The morphologies in Fig. 2(A–D) show that nanobelts were achieved during hydrothermal treatment for 12/24/36/48 h at 180 °C. Fig. 2(D) shows that the nanobelts formed the phenomenon of agglomeration and the uniformity of Fig. 2(C) are better than Fig. 2(A and B), thus the following discussions are with reference to the hydrothermal treatment for 36 h at 180 °C. The width of the α-MoO3 nanobelt was about 200 nm and the length was about 6 μm.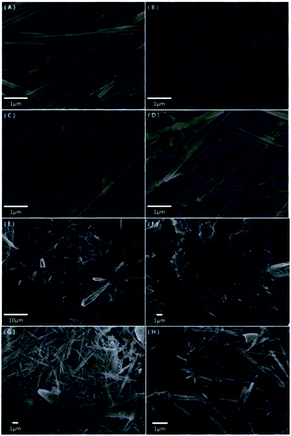 | ||
| Fig. 2 (A–H) SEM images of the pure α-MoO3 nanostructure for 12/24/36/48 h at 180 °C and for 12/24/36/48 h at 120 °C, respectively. | ||
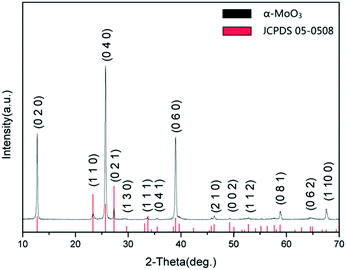
The phase identification and the crystal sizes of the prepared materials were investigated by X-ray diffraction. Fig. 3 shows the XRD patterns of the specimens, which were calcined at 300 °C. The sample was assigned to pure α-MoO3 (JCPDS 05-0508) by verifying the patterns of the sample.
Gas sensing properties
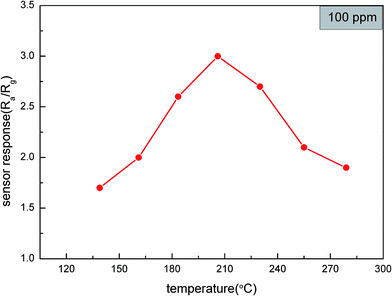
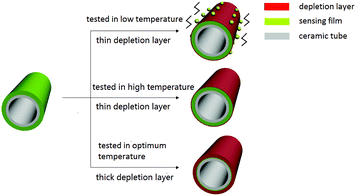
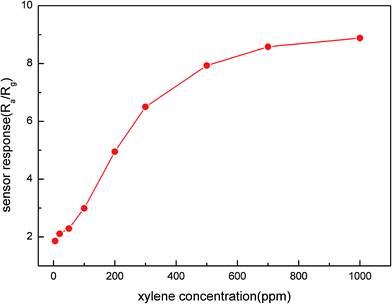
The sensors, which were coated with α-MoO3 nanobelts had a good performance on xylene. In order to find the optimum temperature of the sensors, the responses of the sensors to 100 ppm xylene at different temperatures were collected. As shown in Fig. 4, the response increased along with the working temperature from 136 °C to 206 °C. It was obvious that the temperature improved the chemical reaction between the sensor and test gas because it increased the speed of molecular vibration. However, further increase in temperature resulted in the response of the sensors to decrease. The reason for this is illustrated in Fig. 5, which shows that chemical reaction between xylene and α-MoO3 nanobelts was so fast that the penetration was less relative to the entire sensing film. Therefore, the response of the sensor decreased along with temperature. Therefore, the response reached a maximum value of 3 when the temperature was 206 °C.Fig. 6 shows the response of the sensors towards different concentrations of the test gas (xylene) at 206 °C. The response increased nearly linearly with the concentration of xylene over the range of 5 to 100 ppm and came to saturation when the concentration was over 1000 ppm. Significantly, the response of the sensor could reach 1.89 towards xylene at 5 ppm.
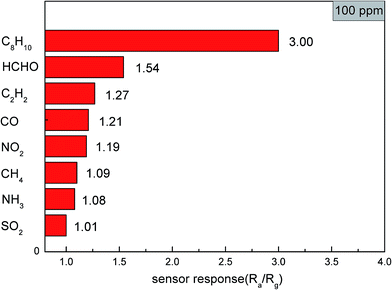
Selectivity is an important property of gas sensors in their practical applications. The responses of the sensors towards different test gases such as methylbenzene, formaldehyde and carbon monoxide are shown in Fig. 7. The gases were tested at 206 °C with a concentration of 100 ppm. The results show that the response of the sensors based on α-MoO3 nanobelts to 100 ppm of xylene could reach 3 and to other test gases were less than 1.6. The sensors also showed a low response towards other test gases at different temperature including toluene. Therefore, α-MoO3 has a good selectivity for xylene. However, it is still difficult for us to distinguish the three forms of xylene (o, m, p) at present because of their similar chemical properties.
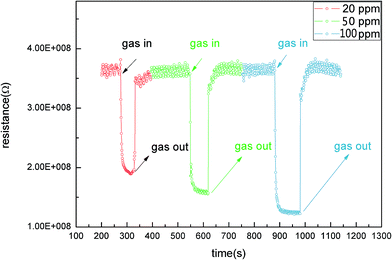
Rapid response and recovery time are significant parameters in designing metal oxide semiconductor gas sensors. Fig. 8 shows the response and recovery characteristics of the sensors towards xylene from 20 ppm to 100 ppm at 206 °C. Fig. 8 indicates that the resistance of the sensors decreased rapidly at first, and then changed slowly due to the reaction slowing down gradually when the sensors were transferred from air to xylene. The resistance of the sensors resumed slowly when sensors were exposed to the air. The time of response and recovery were 7 s and 87 s, respectively. The fast response may be due to the high ratio of surface to volume in the 1D nanostructure.
Sensing mechanism of α-MoO3 nanobelts to xylene
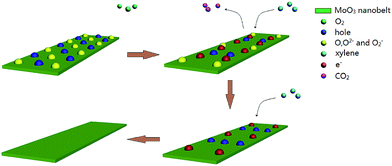
As an n-type semiconductor, the sensing performance of α-MoO3 nanobelts maybe related to the mechanism of adsorption and desorption process of gas molecules on the surface of the oxide because of its crystal structure.28 As shown in Fig. 9, the formation of defects in the α-MoO3 nanobelts is as follows: oxygen is attached on the α-MoO3 nanobelts when the sensor is exposed to air. The oxygen captures electrons from α-MoO3 nanobelts and transforms into O− (420 K–670 K), O2− (above 670 K) and O2− (below 420 K) on the surface of sensing layer, which would lead the holes spread all over the surface of α-MoO3 nanobelts and the increasing resistance.28 When the α-MoO3 nanobelts are transformed to the test gas (xylene), the interaction between xylene and the adsorbed oxygen ions can be explained as follows:| C8H10 + 21O− → 8CO2 + 5H2O + 21e− (420 K–670 K) | (1) |
| C8H10 + 21O2− → 8CO2 + 5H2O + 42e− (above 670 K) | (2) |
| 2C8H10 + 21O2− → 16CO2 + 10H2O + 21e− (below 420 K) | (3) |
| e− + h0 → Null | (4) |
Because the optimum temperature of the sensors based on α-MoO3 nanobelts was 206 °C (479 K), the reaction, including O−, as shown in eqn (1), was the dominative form in the process. The oxygen ion would release CO2 and electrons when the reaction progressed. These electrons neutralize the holes in the α-MoO3 nanobelts and cause a decrease in the resistance of the sensor. The excellent sensing performance makes α-MoO3 nanobelts a new potential candidate for the detection of xylene.
The fast response of the sensors based on α-MoO3 nanobelts materials could be attributed to their 1D nanostructure. The ratio of length to width of the α-MoO3 nanobelts could reach as high as 30/1 and the nanobelts were pretty thin, which leads the adsorption and desorption of O2 and xylene faster at the surface of the sensing layer. Consequently, the reaction occurring at the sensing surface will be greatly accelerated, which results in the faster response of the sensors based on α-MoO3 nanobelts.
Conclusions
In conclusion, the optimal conditions of synthesizing α-MoO3 nanobelts were explored successfully using a hydrothermal method. The α-MoO3 nanobelts were homogeneous and thin with a width of 200 nm and length of 6 μm. The sensors based on α-MoO3 nanobelts exhibited a fast response of 7 s and recovery time of 87 s. The sensors showed a high response for xylene at a low operating temperature of 206 °C. The results show that the α-MoO3 nanostructure is a potential candidate for xylene gas sensing.Acknowledgements
The study was supported by National Natural Science Foundation of China (Grant no. 61404058, 51303061), National High Technology Research and Development Program of China (Grant no. 2013AA030902), Project of Science and Technology Plan of Changchun City (Grant no. 13KG49), and Post doctoral Sustentation Fund of Jilin Province (Grant no. RB201371).Notes and references
- J. Hue, M. Dupoy, T. Bordy, R. Rousier, S. Vignoud, B. Schaerer, T. H. Tran-Thi, C. Rivron, L. Mugherli and P. Karpe, Sens. Actuators, B, 2013, 189, 194–198 CrossRef CAS PubMed.
- C. E. Davis, C. K. Ho, R. C. Hughes and M. L. Thomas, Sens. Actuators, B, 2005, 104, 207–216 CrossRef CAS PubMed.
- T. Akiyama, Y. Ishikawa and K. Hara, Sens. Actuators, B, 2013, 181, 348–352 CrossRef CAS PubMed.
- Y. Chen, L. Zhu, C. Feng, J. Liu, C. Li, S. Wen and S. Ruan, J. Alloys Compd., 2013, 581, 653–658 CrossRef CAS PubMed.
- H.-M. Jeong, H.-J. Kim, P. Rai, J.-W. Yoon and J.-H. Lee, Sens. Actuators, B, 2014, 201, 482–489 CrossRef CAS PubMed.
- J. Park, G. Park, H.-J. Ko and J.-S. Ha, Ceram. Int., 2014, 40, 16281–16285 CrossRef CAS PubMed.
- Y. Ma, X. Zhang, M. Yang and Y. Qi, Mater. Lett., 2014, 136, 146–149 CrossRef CAS PubMed.
- N. Datta, N. S. Ramgir, S. Kumar, P. Veerender, M. Kaur, S. Kailasaganapathi, A. K. Debnath, D. K. Aswal and S. K. Gupta, Sens. Actuators, B, 2014, 202, 1270–1280 CrossRef CAS PubMed.
- M. Maniruzzaman, M. A. Rahman, K. Jeong, H.-s. Nam and J. Lee, Renewable Energy, 2014, 71, 193–199 CrossRef CAS PubMed.
- Y. Meng, T. Wang, S. Chen, Y. Zhao, X. Ma and J. Gong, Appl. Catal., B, 2014, 160–161, 161–172 CrossRef CAS PubMed.
- Z. Zhang, R. Yang, Y. Gao, Y. Zhao, J. Wang, L. Huang, J. Guo, T. Zhou, P. Lu, Z. Guo and Q. Wang, Sci. Rep., 2014, 4, 6797 CrossRef PubMed.
- Y. Wang, X. Zhang, Z. Luo, X. Huang, C. Tan, H. Li, B. Zheng, B. Li, Y. Huang, J. Yang, Y. Zong, Y. Ying and H. Zhang, Nanoscale, 2014, 6, 12340–12344 RSC.
- D. Wang, N. Liu, J. Zhang, X. Zhao, W. Zhang and M. Zhang, J. Mol. Catal. A: Chem., 2014, 393, 47–55 CrossRef CAS PubMed.
- F. Jiang, W. Li, R. Zou, Q. Liu, K. Xu, L. An and J. Hu, Nano Energy, 2014, 7, 72–79 CrossRef CAS PubMed.
- X. Zhang, X. Zeng, M. Yang and Y. Qi, ACS Appl. Mater. Interfaces, 2014, 6, 1125–1130 CAS.
- C. Liu, Z. Li and Z. Zhang, Electrochim. Acta, 2014, 134, 84–91 CrossRef CAS PubMed.
- Z. Hongmei, X. Jianjian, Z. wenjin and H. Wei, Displays, 2014, 35, 171–175 CrossRef PubMed.
- Z. Yin, X. Zhang, Y. Cai, J. Chen, J. I. Wong, Y. Y. Tay, J. Chai, J. Wu, Z. Zeng, B. Zheng, H. Y. Yang and H. Zhang, Angew. Chem., 2014, 53, 12560–12565 CAS.
- S. Bai, S. Chen, L. Chen, K. Zhang, R. Luo, D. Li and C. C. Liu, Sens. Actuators, B, 2012, 174, 51–58 CrossRef CAS PubMed.
- A. D. Rushi, K. P. Datta, P. S. Ghosh, A. Mulchandani and M. D. Shirsat, J. Phys. Chem. C, 2014, 118, 24034–24041 CAS.
- Y. H. Cho, Y. N. Ko, Y. C. Kang, I.-D. Kim and J.-H. Lee, Sens. Actuators, B, 2014, 195, 189–196 CrossRef CAS PubMed.
- W.-S. Kim, H.-C. Kim and S.-H. Hong, J. Nanopart. Res., 2009, 12, 1889–1896 CrossRef.
- M. B. Rahmani, S. H. Keshmiri, J. Yu, A. Z. Sadek, L. Al-Mashat, A. Moafi, K. Latham, Y. X. Li, W. Wlodarski and K. Kalantar-zadeh, Sens. Actuators, B, 2010, 145, 13–19 CrossRef CAS PubMed.
- L. Wang, P. Gao, D. Bao, Y. Wang, Y. Chen, C. Chang, G. Li and P. Yang, Cryst. Growth Des., 2014, 14, 569–575 CAS.
- L. Brigo, M. Cittadini, L. Artiglia, G. A. Rizzi, G. Granozzi, M. Guglielmi, A. Martucci and G. Brusatin, J. Mater. Chem. C, 2013, 1, 4252 RSC.
- C. Feng, W. Li, C. Li, L. Zhu, H. Zhang, Y. Zhang, S. Ruan, W. Chen and L. Yu, Sens. Actuators, B, 2012, 166–167, 83–88 CrossRef CAS PubMed.
- L. Li, P. Gao, M. Baumgarten, K. Mullen, N. Lu, H. Fuchs and L. Chi, Adv. Mater., 2013, 25, 3419–3425 CrossRef CAS PubMed.
- F. Qu, C. Feng, C. Li, W. Li, S. Wen, S. Ruan and H. Zhang, Int. J. Appl. Ceram. Technol., 2014, 11, 619–625 CrossRef CAS PubMed.
| This journal is © The Royal Society of Chemistry 2015 |

