DOI:
10.1039/C4RA16763E
(Paper)
RSC Adv., 2015,
5, 20623-20633
Molecular insight and resolution for tumors harboring the H-ras(G12V) mutation
Received
28th December 2014
, Accepted 5th February 2015
First published on 5th February 2015
Abstract
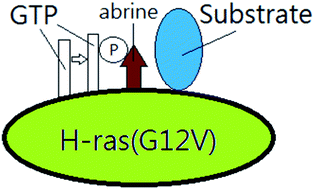
A study about the physiological regulators of oncogenic growth has recently been published in the literature. When the H-ras gene mutates, the mutant H-ras(G12V) protein causes uncontrolled cell growth. We tried to observe whether there is any difference between the wild type and mutant H-ras protein in terms of the molecular character and structural variation in silico. Our hypothesis is that the H-ras(G12V) protein, accompanied by an altered structure, might be responsible for excess signal transduction and even tumor formation. In this study, we wanted to find a potent compound that could bind to the H-ras(G12V) protein and interfere with the phosphorylation of the substrate protein. By using homology modeling, structure-based docking, candidate screening, and molecular dynamics (MD) simulations, we demonstrated that the structural and molecular character of the H-ras and H-ras(G12V) proteins were different. Abrine could bind to H-ras(G12V) and might interfere with the phosphorylation process. These results provided novel insight for the management of tumors or cancers, which harbor the H-ras(G12V) mutation.
Introduction
A study about the physiological regulators of oncogenic growth has previously been reported.1 The H-ras protein receives growth factor stimulation and regulates cell division.2 It is a GTPase involved in signal transduction pathways,3 and becomes active through binding with guanosine triphosphate (GTP).4 A rapid response of cell proliferation can be induced by H-ras protein injection in animal experiments.5 It is evident that H-ras plays a proto-oncogenic role in tumor formation.6 When the H-ras gene mutates, the mutant protein causes uncontrolled cell growth.7 This mutation occurs in only one amino acid substitute of the normal H-ras protein.8 It replaces the normal amino acid glycine (G) with valine (V) at position 12 (known as a G12V mutation).9 The mutated H-ras protein is overactive even in the absence of an outside growth factor stimulation.10 Finally, it leads to endless cell proliferation and tumor formation.11 In this study, we attempted to observe whether there is any difference between the normal and mutant H-ras(G12V) protein through a structure-based docking procedure and molecular dynamics (MD) simulations.
The H-ras gene is located at the position 15.5 on the short arm of chromosome 11. It belongs to the Ras superfamily of small GTPases. There are many proteins in the Ras superfamily. They attach to the cell membrane by the prenylation or palmitoylation domains.12 The Ras protein plays a switch on/off role in signal transduction.13 It is in the “on” state while binding with GTP. After transduction of one phosphate group, it is in the “off” state, while GTP transforms to guanosine diphosphate (GDP). So the Ras active or inactive states depend on the GTP-bound or GDP-bound form. Ras proteins are involved in transmitting external signals into cells.14 The signal pathway following Ras is the rapidly accelerated fibrosarcoma/mitogen-activated protein kinase/extracellular signal-regulated kinase (RAF/MAPK/ERK) pathway. ERK controls cell division, proliferation and differentiation subsequently.15
“Ras” refers to the abbreviation of “Rat sarcoma”, which indicates its relationship to the oncogenes.16 The well-known members in the superfamily are K-ras, N-ras and H-ras. The three Ras proteins share high sequence identities and similarities. All of them are associated with cell division, proliferation and differentiation.17 They are the most common human Ras oncogenes, which lead to tumor formation.18 Ras oncogenes are also related to tumor invasion and even metastasis.19 Ras mutation is notorious for its oncogenic characteristics.20 Thus, Ras inhibitors are one option to manage tumors.21 Scientists seek a way to inhibit Ras protein activity.22 H-ras is a hot topic in the physiological regulation of oncogenic growth. If we know the mechanism by which the H-ras protein transmits the signal, we can suppress tumor formation by blocking the signal pathway.23 Accompanied with modern technology, the function of the H-ras protein can be disrupted.24 Tumor therapy for the target of other oncogenes may provide a new idea to inhibit the activity of the mutant H-ras protein.25
As we know, the mutant H-ras protein can be responsible for tumor or cancer. Our hypothesis is that the mutant H-ras(G12V) protein, accompanied by an altered structure, might lead to its oncogenic characteristics. In this study, we attempted to search for a small molecular compound that may be a H-ras(G12V) protein inhibitor. In other words, we wanted to find the compound that could bind to the H-ras(G12V) protein successfully and interfere with the contact of GTP and the substrate protein. Thanks to modern technology, computer-aided drug design (CADD) saves time to select an appropriate drug compound rapidly compared with traditional one-by-one biochemistry.26,27 Structure-based methods employ docking procedures and MD simulations.28,29 The best candidate from docking and MD simulations can be selected as the potential therapeutic drug.30 Traditional Chinese medicine (TCM) combines tradition and innovation together.31 There are many advantages for utilizing a TCM database to conduct CADD.32 Thus, we tried to utilized the largest TCM database in the world, TCM Database@Taiwan (http://tcm.cmu.edu.tw/), to search for a small molecular compound that has the ability to be a H-ras(G12V) protein inhibitor for tumor suppression.33
Materials and methods
Homology modeling
We obtained the sequence and 3D structure of the human H-ras protein from the Uniprot Knowledgebase (P01112, human, 189 amino acids) and the Protein Data Bank (PDB ID: 4Q21), respectively. We performed homology modeling of the H-ras(G12V) protein using the Build Homology Models program in Accelrys Discovery Studio (DS) 2.5. We further confirmed the H-ras(G12V)-modeled structure by Ramachandran plot with the Rampage program in DS 2.5.34
Structure-based docking and candidate screening
We utilized the small molecular compounds from TCM Database@Taiwan to dock with the H-ras(G12V) protein. Docking with the target protein was a necessary step for the ligand to produce a subsequent influence on the binding forces and even cause a structural change. It was important to estimate if any given ligand could match the binding sites of the target protein. We minimized all docking poses between the ligands and the H-ras(G12V) protein by the force field of Chemistry at HARvard Molecular Mechanics (CHARMm).35 The LigandFit program in DS 2.5 was utilized to conduct the docking procedure. The first step was to determine the binding sites of the H-ras(G12V) protein. Key residues for the candidate’s binding sites were set around GDP-bound sites. The second step was to generate the ligand’s conformation by the Monte Carlo method and dock it with the binding sites. The third step was to calculate the binding affinity and binding scores between the ligand and the H-ras(G12V) protein.36 In this study, we adopted the scores of piecewise linear potentials (−PLP1 and −PLP2) to compare the binding affinity for the TCM compounds and the control with the H-ras(G12V) protein.37
Molecular dynamics (MD) simulations
The procedure of molecular binding was a dynamic process. To count and analyze the data of the dynamic process, we needed a method for mathematical calculation. The Groningen Machine for Chemical Simulations (GROMACS) program was utilized for the MD simulations. The assumed four phases for each ligand–protein complex were minimization, heating, equilibration, and finally, production. The cytoplasmic situation was set as a transferable intermolecular potential 3P (TIP3P) function for water with a 0.9% sodium chloride concentration. The minimization course comprised of 500 steps of steepest descent and conjugate gradient. The heating course involved heating from 50 K to 310 K within 50 picoseconds (ps) and the equilibration course comprised of 310 K for 150 ps. The production course comprised of a constant temperature for 20 nanoseconds (ns). The trajectories of the root mean square deviation (RMSD), mean square displacement (MSD), solvent accessible surface area (SASA), radius of gyration (Rg) and total energy were illustrated to evaluate the results of the MD simulations. We drew diagrams of the root mean square fluctuation (RMSF) to compare the change of individual residues. Cluster analysis and the representative structure, docking and molecular MD snapshots were used to compare the differences between H-ras, H-ras(G12V) and abrine.38,39
Results and discussion
Homology modeling
We substituted the amino acid glycine (G) with valine (V) at position 12 in the sequence of the H-ras protein, and constructed a H-ras(G12V)-modeled structure according to the wild type template (4Q21, human H-ras protein). The Ramachandran plot of the H-ras(G12V)-modeled structure demonstrated that 94.6% of residues were in the favored region, 4.2% were in the allowed region, and only 1.2% were in the outlier region (Fig. 1).
 |
| | Fig. 1 Ramachandran plot of the H-ras(G12V)-modeled structure. Number of residues in the favored region (∼98.0% expected): 157 (94.6%). Number of residues in the allowed region (∼2.0% expected): 7 (4.2%). Number of residues in the outlier region: 2 (1.2%). | |
We chose the human H-ras(G12V) protein sequence and human H-ras template (4Q21) as the homologous models to construct the ideal H-ras(G12V)-modeled structure. By analyzing the Ramachandran plot, the high percentage of residues in the favored (94.6%) and allowed (4.2%) regions implied that the H-ras(G12V)-modeled structure was a reasonable conformational model.
Structure-based docking and candidate screening
We utilized GDP as the ligand-binding control model of H-ras and the H-ras(G12V) protein. The ligand–protein complex of 4Q21 which was recruited by the Protein Data Bank has included GDP and H-ras protein. Table 1 lists the piecewise linear potential (PLP) scores of the top 9 candidates screened from the TCM Database@Taiwan. Based on the docking results, we chose abrine as the candidate for further investigation (Fig. 2). The binding residues between GDP and H-ras or the H-ras(G12V) protein were illustrated. GDP formed a hydrogen bond (H-bond) with Gly13, Lys16, Ser17, Ala18 and Lys117 of the H-ras protein. GDP formed a H-bond with Gly13, Gly15, Lys16 and Lys117 of the H-ras(G12V) protein. Abrine formed a H-bond with Lys117 and Asp119 of the H-ras(G12V) protein (Fig. 3).
Table 1 Piecewise Linear Potential (PLP) scores of top 9 candidates screening from the TCM Database@Taiwan
| Name |
−PLP1 |
−PLP2 |
| Abrine |
65.01 |
63.57 |
| Saussureamine A |
59.55 |
57.98 |
| N-Methyl tyramine-O-alpha-L-rhamnopyranoside |
29.36 |
34.53 |
| 3,4,5-Trimethoxy benzeneethanamine |
28.6 |
26.2 |
| Mescaline |
27.7 |
23.87 |
| Norerythrostachaldine |
23.17 |
20.15 |
| (S)-Cathinone |
12.07 |
6.91 |
| Norephedrine |
14.03 |
14.29 |
| Hexyl amine-1 |
13.6 |
8.48 |
| Guanosine-5′-diphosphate (the control) |
51.31 |
55.4 |
 |
| | Fig. 2 Scaffolds of the ligands. (A) Guanosine diphosphate (GDP) for the H-ras protein. (B) GDP for the H-ras(G12V) protein. (C) Abrine for the H-ras(G12V) protein. | |
 |
| | Fig. 3 Schematic diagram of the binding area for the ligand and (A) the H-ras protein, and (B) the H-ras(G12V) protein. Docking poses of the ligand and its corresponding protein: (C) GDP-bound H-ras, (D) GDP-bound H-ras(G12V), and (E) abrine-bound H-ras(G12V). | |
Comparing GDP-bound H-ras and the H-ras(G12V) protein, demonstrates that there were common and different binding residues. Gly13, Lys16 and Lys117 were the common binding residues, found by the docking procedure. Gly15, Ser17 and Ala18 were the different binding residues. It was evident that even a tiny change (G12V) could induce a slight different in the binding results. Further comparison of the GDP-bound and abrine-bound H-ras(G12V) protein, shows that Lys117 was the only common binding residue. It was evident that abrine was bound to the H-ras(G12V) protein near the GDP binding sites. This result inferred that abrine might interfere with the contact of GTP and the substrate protein.
Molecular dynamics (MD) simulations
Molecular character. First, we focused on two conditions of the molecular character during the MD simulations. One was a wild type GDP-bound H-ras and a mutant H-ras(G12V) protein, and the other was abrine and the GDP-bound H-ras(G12V) protein.The trajectory of the root mean square deviation (RMSD) was drawn to evaluate the deviation degree of each ligand and its relevant H-ras or H-ras(G12V) protein. H-ras had the highest average protein RMSD value. In contrast, the relevant protein of abrine had the lowest average protein RMSD value. Interestingly, abrine had the highest average ligand RMSD value among the three ligands. H-ras was higher than H-ras(G12V) too (Fig. 4). It was evident that GDP or its relevant H-ras(G12V) protein was more stable than the wild type H-ras protein. This result inferred that GTP-bound H-ras(G12V) provided a more stable condition to phosphorylate the substrate protein.
 |
| | Fig. 4 Root mean square deviation for (A) protein RMSD and (B) ligand RMSD. | |
We drew the trajectory of the mean square displacement (MSD) to investigate the molecular deviation distance of each ligand and its relevant protein. H-ras had the highest average protein MSD value. In contrast, the relevant protein of abrine had the lowest average protein MSD value. Interestingly, abrine had the highest ligand MSD value among the three ligands. The average value of H-ras was also higher than H-ras(G12V) (Fig. 5). It was evident that although abrine had a certain degree of deviation, its relevant protein was quite stable. This result inferred that abrine might interfere with the contact of GTP and the substrate protein.
 |
| | Fig. 5 Mean square displacement for (A) protein MSD and (B) ligand MSD. | |
The trajectory of the solvent accessible surface area (SASA) was drawn to evaluate the water contact surface of each ligand and its relevant protein. H-ras had the highest average protein SASA value. In contrast, H-ras(G12V) had the lowest average protein SASA value (Fig. 6). However, the average ligand SASA value of abrine was much higher than H-ras or H-ras(G12V). We supposed this result might reflect that the abrine molecule had a long hydrophobic tail (Fig. 7).
 |
| | Fig. 6 Solvent accessible surface area (protein SASA) for (A) GDP corresponding H-ras, (B) GDP corresponding H-ras(G12V) and (C) abrine corresponding H-ras(G12V). | |
 |
| | Fig. 7 Solvent accessible surface area (ligand SASA) of (A) GDP for H-ras, (B) GDP for H-ras(G12V) and (C) abrine for H-ras(G12V). | |
We drew the trajectory of the radius of gyration (Rg) to investigate the degree of compactness of each ligand and its relevant protein. H-ras had the highest average protein Rg value among the three proteins. However, abrine had the highest average ligand Rg value, and H-ras(G12V) had the lowest average value (Fig. 8). It was evident that GDP or its relevant H-ras(G12V) protein was more compact than the wild type H-ras protein. This result inferred that GTP-bound H-ras(G12V) provided a closer condition to phosphorylate the substrate protein.
 |
| | Fig. 8 Radius of gyration (Rg) for (A) proteins and (B) ligands. | |
The trajectory of the total energy was drawn to evaluate the binding energy needed for each ligand and its relevant protein. The frequent total energy for H-ras, H-ras(G12V) and abrine was around −415
500, −415
500 and −409
000 kJ mol−1, respectively (Fig. 9). According to the trajectories of the total energy, abrine was higher than H-ras and H-ras(G12V). We supposed that a single mutation of the H-ras protein didn’t affect its binding stability with GDP, but abrine might bind to H-ras(G12V) successfully with a higher energy.
 |
| | Fig. 9 Total energy for (A) GDP-bound H-ras, (B) GDP-bound H-ras(G12V) and (C) abrine-bound H-ras(G12V). | |
Structural variation. In the following section, we focused on the comparison of the detailed structural or conformational variations of these three proteins: H-ras, H-ras(G12V) and the relevant H-ras(G12V) protein for abrine.We showed the diagram of the root mean square fluctuation (RMSF) to assess the fluctuation degree from the view of every residue. All of the three proteins had a similar RMSF pattern, but the number matrix could tell us the difference. The highest relative value was 1, which meant that there was no difference. The relative value between H-ras and H-ras(G12V) was 0.5476. The relative values between abrine and H-ras(G12V) or H-ras were 0.7919 and 0.795, respectively (Fig. 10). Based on the relative value of the RMSF number matrix between H-ras and H-ras(G12V), it was evident that there was a certain degree of structural change even due to a single mutation. This was in accordance with our hypothesis that the mutant H-ras(G12V) protein was accompanied by an altered structure.
 |
| | Fig. 10 (A) The trajectories of the root mean square fluctuation (RMSF). (B) The matrix of the RMSF for H-ras, H-ras(G12V) and abrine. | |
We performed a cluster analysis to determine the representative structure of each ligand and its relevant protein during the MD simulations. The times for the representative structures of H-ras, H-ras(G12V) and abrine were 15.06, 15.96 and 13.44 ns, respectively. GDP formed a H-bond with Val14, Gly15, Lys16, Ser17 and Lys117 of the H-ras protein at 15.06 ns. GDP formed a H-bond with Gly15, Lys16 and Ser17 of the H-ras(G12V) protein at 15.96 ns. Abrine formed a H-bond with Lys117 of the H-ras(G12V) protein at 13.44 ns (Fig. 11).
 |
| | Fig. 11 Cluster analysis and the representative structures for (A) GDP-bound H-ras, (B) GDP-bound H-ras(G12V) and (C) abrine-bound H-ras(G12V). | |
Comparative diagrams of the docking and MD snapshots for H-ras, H-ras(G12V) and abrine were illustrated. We adopted overlapping methods to display the difference between the docking and MD snapshots for the ligand and its relevant protein. H-bonding and hydrophobic contact were important binding forces for the connection between the ligand and its relevant protein. The binding angles of abrine changed prominently. Besides the binding angles, there was one prominent difference between the docking and MD snapshots for the H-ras(G12V) protein. The important binding residue Lys117, which existed in docking was lost at 15.96 ns of the MD simulations (Fig. 12–14).
 |
| | Fig. 12 Comparative diagrams of the docking and molecular dynamics (MD) snapshots for GDP bound with the H-ras protein. | |
 |
| | Fig. 13 Comparative diagrams of the docking and molecular MD snapshots for GDP bound with the H-ras(G12V) protein. | |
 |
| | Fig. 14 Comparative diagrams of the docking and MD snapshots for abrine bound with the H-ras(G12V) protein. | |
Based on the cluster analysis and comparative diagrams of docking and the MD snapshots, there were several important findings. Except the binding angles, there was no prominent change for the H-ras protein. However, the important binding residue Lys117, which existed in docking was lost at 15.96 ns of the MD simulations for the H-ras(G12V) protein. It was evident that H-ras(G12V) lost the Lys117 connection gradually due to a conformational change during the MD simulations. This change provided abrine with a chance to bind with the H-ras(G12V) protein and the changing binding angles might interfere with the contact of GTP and the substrate protein.
Conclusion
From the results of the MD simulations, such as RMSD, MSD, SASA, Rg and RMSF, it can be seen that H-ras(G12V) had a different molecular character and structural variation from the wild type H-ras protein. We also demonstrated that the altered structure might provide a more convenient condition to phosphorylate the substrate protein. According to the structure-based docking, candidate screening, and MD simulations, it was evident that abrine might interfere with the contact of GTP and the substrate protein. The above findings provided a novel idea or insight for the management of tumors or cancers, which harbor the H-ras(G12V) mutation.
Acknowledgements
The research was supported by grants from China Medical University Hospital (DMR-102-001, DMR-104-084, DMR-104-001, DMR-104-048, DMR-104-023). The study is supported in part by the Taiwan Ministry of Health and Welfare Clinical Trial and Research Center of Excellence (MOHW104-TDU-B-212-113002), and CMU under the Aim for Top University Plan of the Ministry of Education, Taiwan.
References
- S. Beronja, P. Janki, E. Heller, W. H. Lien, B. E. Keyes, N. Oshimori and E. Fuchs, Nature, 2013, 501, 185–190 CrossRef CAS PubMed.
- K. Irani, Y. Xia, J. L. Zweier, S. J. Sollott, C. J. Der, E. R. Fearon, M. Sundaresan, T. Finkel and P. J. Goldschmidt-Clermont, Science, 1997, 275, 1649–1652 CrossRef CAS.
- J. C. Lacal, P. de la Pena, J. Moscat, P. Garcia-Barreno, P. S. Anderson and S. A. Aaronson, Science, 1987, 238, 533–536 CAS.
- I. A. Prior, A. Harding, J. Yan, J. Sluimer, R. G. Parton and J. F. Hancock, Nat. Cell Biol., 2001, 3, 368–375 CrossRef CAS PubMed.
- C. Collin, A. G. Papageorge, D. R. Lowy and D. L. Alkon, Science, 1990, 250, 1743–1745 CAS.
- J. R. Feramisco, M. Gross, T. Kamata, M. Rosenberg and R. W. Sweet, Cell, 1984, 38, 109–117 CrossRef CAS.
- U. Krengel, I. Schlichting, A. Scherer, R. Schumann, M. Frech, J. John, W. Kabsch, E. F. Pai and A. Wittinghofer, Cell, 1990, 62, 539–548 CrossRef CAS.
- D. Meder and K. Simons, Science, 2005, 307, 1731–1733 CrossRef CAS PubMed.
- Y. Wakabayashi, J. H. Mao, K. Brown, M. Girardi and A. Balmain, Nature, 2007, 445, 761–765 CrossRef CAS PubMed.
- A. Goriely, R. M. Hansen, I. B. Taylor, I. A. Olesen, G. K. Jacobsen, S. J. McGowan, S. P. Pfeifer, G. A. McVean, E. Rajpert-De Meyts and A. O. Wilkie, Nat. Genet., 2009, 41, 1247–1252 CrossRef CAS PubMed.
- S. A. Radkov, P. Kellam and C. Boshoff, Nat. Med., 2000, 6, 1121–1127 CrossRef CAS PubMed.
- J. F. Hancock, H. Paterson and C. J. Marshall, Cell, 1990, 63, 133–139 CrossRef CAS.
- O. Rocks, A. Peyker, M. Kahms, P. J. Verveer, C. Koerner, M. Lumbierres, J. Kuhlmann, H. Waldmann, A. Wittinghofer and P. I. Bastiaens, Science, 2005, 307, 1746–1752 CrossRef CAS PubMed.
- H. Schipper, E. A. Turley and M. Baum, Lancet, 1996, 348, 1149–1151 CrossRef CAS.
- M. Malumbres and M. Barbacid, Nat. Rev. Cancer, 2003, 3, 459–465 CrossRef CAS PubMed.
- D. Bar-Sagi and J. R. Feramisco, Science, 1986, 233, 1061–1068 CAS.
- M. A. White, C. Nicolette, A. Minden, A. Polverino, L. Van Aelst, M. Karin and M. H. Wigler, Cell, 1995, 80, 533–541 CrossRef CAS.
- K. H. Vahakangas, J. M. Samet, R. A. Metcalf, J. A. Welsh, W. P. Bennett, D. P. Lane and C. C. Harris, Lancet, 1992, 339, 576–580 CrossRef CAS.
- N. Hayashi, I. Ito, A. Yanagisawa, Y. Kato, S. Nakamori, S. Imaoka, H. Watanabe, M. Ogawa and Y. Nakamura, Lancet, 1995, 345, 1257–1259 CrossRef CAS.
- M. Oft, R. J. Akhurst and A. Balmain, Nat. Cell Biol., 2002, 4, 487–494 CrossRef CAS PubMed.
- J. Chen and R. Iyengar, Science, 1994, 263, 1278–1281 CAS.
- S. M. Johnson, H. Grosshans, J. Shingara, M. Byrom, R. Jarvis, A. Cheng, E. Labourier, K. L. Reinert, D. Brown and F. J. Slack, Cell, 2005, 120, 635–647 CrossRef CAS PubMed.
- M. H. Tsai, C. L. Yu and D. W. Stacey, Science, 1990, 250, 982–985 CAS.
- S. Roy, R. Luetterforst, A. Harding, A. Apolloni, M. Etheridge, E. Stang, B. Rolls, J. F. Hancock and R. G. Parton, Nat. Cell Biol., 1999, 1, 98–105 CrossRef CAS PubMed.
- F. Su, A. Viros, C. Milagre, K. Trunzer, G. Bollag, O. Spleiss, J. S. Reis-Filho, X. Kong, R. C. Koya, K. T. Flaherty, P. B. Chapman, M. J. Kim, R. Hayward, M. Martin, H. Yang, Q. Wang, H. Hilton, J. S. Hang, J. Noe, M. Lambros, F. Geyer, N. Dhomen, I. Niculescu-Duvaz, A. Zambon, D. Niculescu-Duvaz, N. Preece, L. Robert, N. J. Otte, S. Mok, D. Kee, Y. Ma, C. Zhang, G. Habets, E. A. Burton, B. Wong, H. Nguyen, M. Kockx, L. Andries, B. Lestini, K. B. Nolop, R. J. Lee, A. K. Joe, J. L. Troy, R. Gonzalez, T. E. Hutson, I. Puzanov, B. Chmielowski, C. J. Springer, G. A. McArthur, J. A. Sosman, R. S. Lo, A. Ribas and R. Marais, N. Engl. J. Med., 2012, 366, 207–215 CrossRef CAS PubMed.
- X. Y. Pan, H. Guo, J. Han, F. Hao, Y. An, Y. Xu, Y. Xiaokaiti, Y. Pan and X. J. Li, Eur. J. Pharmacol., 2012, 683, 27–34 CrossRef CAS PubMed.
- H. C. Tang and C. Y. Chen, J. Evidence-Based Complementary Altern. Med., 2014, 2014, 254678 Search PubMed.
- S. Tian, J. Wang, Y. Li, X. Xu and T. Hou, Mol. Pharmaceutics, 2012, 9, 2875–2886 CrossRef CAS PubMed.
- H. C. Tang and C. Y. Chen, J. Evidence-Based Complementary Altern. Med., 2014, 2014, 385120 Search PubMed.
- H. C. Tang and C. Y. Chen, BioMed Res. Int., 2014, 2014, 798742 Search PubMed.
- Z. Li, Y. Liu, L. Wang, X. Liu, Q. Chang, Z. Guo, Y. Liao, R. Pan and T. P. Fan, J. Evidence-Based Complementary Altern. Med., 2014, 2014, 392324 Search PubMed.
- H. C. Tang and C. Y. Chen, J. Evidence-Based Complementary Altern. Med., 2014, 2014, 928589 Search PubMed.
- C. Y. Chen, PLoS One, 2011, 6, e15939 CAS.
- C. Y. Chen, Curr. Top. Med. Chem., 2013, 13, 965–988 CrossRef CAS.
- K. Vanommeslaeghe, E. Hatcher, C. Acharya, S. Kundu, S. Zhong, J. Shim, E. Darian, O. Guvench, P. Lopes, I. Vorobyov and A. D. Mackerell Jr, J. Comput. Chem., 2010, 31, 671–690 CAS.
- M. Montes, M. A. Miteva and B. O. Villoutreix, Proteins: Struct., Funct., Bioinf., 2007, 68, 712–725 CrossRef CAS PubMed.
- C. Y. Chen, J. Biomol. Struct. Dyn., 2009, 27, 271–282 CAS.
- D. Van Der Spoel, E. Lindahl, B. Hess, G. Groenhof, A. E. Mark and H. J. Berendsen, J. Comput. Chem., 2005, 26, 1701–1718 CrossRef CAS PubMed.
- S. Pronk, S. Pall, R. Schulz, P. Larsson, P. Bjelkmar, R. Apostolov, M. R. Shirts, J. C. Smith, P. M. Kasson, D. van der Spoel, B. Hess and E. Lindahl, Bioinformatics, 2013, 29, 845–854 CrossRef CAS PubMed.
|
| This journal is © The Royal Society of Chemistry 2015 |
Click here to see how this site uses Cookies. View our privacy policy here.