Polymerization kinetics of a fluorinated monomer under confinement in AAO nanocavities

Maitane Salsamendia, Nicholas Ballarda, Belén Sanzb, José M. Asua*a and Carmen Mijangos*abc
aPOLYMAT, University of the Basque Country EHU-UPV, Edificio Joxe Mari Korta, Avda. Tolosa 72, 20018 Donostia-San Sebastian, Guipúzcoa, Spain. E-mail: cmijangos@ictp.csic.es
bInstituto de Ciencia y Tecnología de Polímeros, CSIC, c/Juan de la Cierva 3, 28006 Madrid, Spain
cIKERBASQUE, Basque Foundation for Science, 48011, Bilbao, Spain

Received 19th December 2014 , Accepted 30th January 2015

First published on 2nd February 2015


Abstract

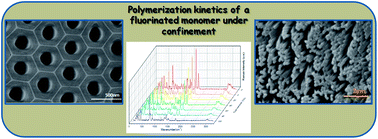
In this work we show for the first time the kinetic study of the radical polymerization of a fluorinated acrylic monomer (MFA) in the confinement of anodic aluminum oxide (AAO) nanocavities. AAO templates with different pore sizes were used as nanoreactors and polymerization kinetics were studied in situ by Raman spectroscopy and in bulk by differential scanning calorimetry (DSC). Afterwards, a mathematical model that describes the effect of nanoconfinement on the polymerization kinetics was derived. Furthermore, similar nanostructures were observed by SEM when in bulk polymerized PFA was infiltrated into the AAO nanocavities. Superhydrophobic surfaces were achieved with the water contact angle of 159°, much higher than its analogous non-nanostructured PFA, 114°. The “lotus effect” was observed in the superhydrophobic surface which has a low sliding angle of 8°.

Introduction

Nanostructured polymers have attracted increasing interest due to their unique properties and applications. Porous aluminum oxide anodized (AAO) nanocavities are emerging as one of the most promising structures to produce template-nanostructured polymers.1–10 After one-step polymerization reaction in the AAO nanocavities or wet polymer infiltration to the porous surface, nanostructured polymers can be obtained. Moreover, polymers synthesized in bulk and those confined into nanocavities show different properties, such as crystallinity, chain dynamics or glass transition values.11–14 Both strategies provide a variety of shapes and morphologies, long or short, hollow or solid, free or supported nanofibers by selecting an appropriate monomer or polymer and the dimensions of AAO templates. Supported nanofibers are generally obtained by placing a film on the top of the AAO nanocavities and removing of the template. When short nanofibers (nanorods) are supported on a surface they can stand up as pillars. The distance from one pillar to the other is constant/periodic and adjusted to the dimensions of the AAO templates. This kind of “patterned” surfaces can provided potential applications in biomedicine, and others fields.2,5,8

Fluoropolymers exhibit very interesting properties such as good mechanical, thermal or chemical stability. Moreover, these materials show hydrophobic and lipophobic character due to their low surface energies.15–18 However, the hydrophobicity is an important characteristic of the polymer surfaces which depends not only on the chemical nature of the material but also on the surface roughness.19–23 The chemical structure, surface preparation (spin coating, spraying, etc.), surface treatment with plasma, surface morphology, can heavily influence the wettability of the material. For instance, Shang et al.19 reported the facile creation of superhydrophobic surfaces with a fluorine–silicon polymer using a phase separation technique. The surface morphologies of the polymer films were controlled by the degree of phase separation, which could be tuned easily by the ethanol/THF volume ratio and the initial solution concentration.19 Other techniques, such as electrospinning of fluorinated polymers or spraying of non-fluorinated supercritical solutions, were also described to improve the surface hydrophobicity.24,25 However, to our knowledge, fluorinated polymer surfaces have never been prepared before from confinement in AAO nanocavities, which is one of our objectives together with the study of the polymerization kinetics.

Therefore, in this work, for the first time the polymerization kinetics of (1H,1H,2H,2H-perfluorodecyl acrylate) (MFA) under confinement within AAO nanocavities is studied and compared with bulk polymerization. In order to understand the free radical polymerization of the fluorinated acrylic monomer inside of confined nanoreactors a mathematical model was constructed taking into account the confinement effects experienced by radicals during the polymerization process. It is shown that an increased termination rate is expected due to the increased possibility of radicals recombining in the narrow cylindrical space. Furthermore, nanostructures are also obtained after infiltrating into AAO nanocavities poly(1H,1H,2H,2H-perfluorodecyl acrylate) PFA, previously synthesized in bulk, and the hydrophobic character of these nanostructured polymer surfaces is determined.

Experimental procedure

Materials

The initiator, azoisobutyronitrile (AIBN), was bought from Sigma-Aldrich and the monomer, 1H,1H,2H,2H-perfluorodecyl acrylate, 96% (MFA), was supplied by Interchin. Both were used as received.

Ultrapure (99[thin space (1/6-em)]999%) aluminum foils of 12 cm2 were purchased from Goodfellow and degreased by sonication into solvents of different polarity (acetone, deionized water and ethanol).

Sample preparation

Fabrication of AAO templates. Ordered AAO templates have been prepared by two-step electrochemical anodization of aluminum foils, as previously reported.4 Briefly, the electrochemical anodization process was carried out with phosphoric acid (2%) and aluminum oxalate (0.02 M) at temperature of 0–1 °C during 6 h. The second step determined the length of the AAO, this electrochemical anodization was carried out at different times in order to get length from 0.7 to 50 μm. After those two steps of anodization, AAO were widened in 5% phosphoric acid during different times to get pore sizes from 200–350 nm.
In situ polymerization of MFA in AAO nanocavities. The polymerization of MFA was carried out in an AAO template with cavities of 250 nm diameter and 50 μm of length. In order to dissolve the initiator in the monomer, the mixture of MFA and AIBN (1% in weight respect to monomer) was previously heated at 40 °C. Then the mixture was poured onto the surface of AAO template, which was placed in the oven at 40 °C and in nitrogen atmosphere for overnight to provide a template wetting. Afterwards, the temperature was increased to 90 °C for one hour and a half and the PFA polymer was synthesized. To finish, the excess of polymer was removed from the aluminum surface using a sharp razor blade.

In order to study the in situ polymerization kinetics of MFA in the AAO template, the reaction was followed by Raman spectroscopy as a function of time. For that purpose, a temperature cell was fixed at 70 °C during 165 minutes, and registered statics spectra center was at 1641 cm−1 and 725 cm−1. For polymer nanostructures, the Raman measurements have been performed following the methodology described by Maiz et al.26 Briefly, the Raman scattering was excited with a 785 nm near-infrared diode laser of 320 mW maximum input power. A 100×, NA090 microscope objective lens was used to focus the laser beam. With this objective the sampling depth is estimated to be around 4–5 μm (half-width of the confocal depth profile for a silicon wafer) and the lateral resolution is estimated at about 1 μm with the system operated in the confocal mode. Raman scattered radiation was focused through a pinhole aperture. Data acquisition covered the spectral range 3200–300 cm−1 with a spectral resolution of 4 cm−1 for each exposure of the CCD detector. Depth profiles were obtained by focusing the microscope stepwise, at 10 μm intervals through long AAO templates.

Bulk polymerization of MFA. For kinetic studies, the polymerization reactions in bulk were performed by differential scanning calorimetry (DSC) under isothermal and dynamic conditions. Isothermal polymerization was carried out at 80, 90, 100 and 110 °C for a time sufficient to achieve 100% of conversion. For that purpose, approximately 10–15 mg of FA monomer with AIBN (1% w/w) was weighted, put into hermetic TA Instruments sample pan, sealed and placed into the appropriate position of the instrument. The polymerizations were conducted under nitrogen atmosphere and it was maintained constant in all cases during the whole polymerization process. The reaction exotherms (in normalized values, W g−1) were recorded as a function of time. After the isothermal polymerization process, a dynamic scan from 0 to 150 °C was applied in order to check any residual heat of reaction and to determine the crystallization and melting processes of obtained PFA (see Fig. S1 of ESI). The procedure was repeated twice.

PFA was synthesized by polymerization of MFA at 90 °C under nitrogen atmosphere using AIBN (1% in weight respect to monomer) as initiator and used for polymer infiltration.

Polymer infiltration. In order to obtain nanostructured PFA from the bulk polymer, it was infiltrated into AAO nanocavities by using templates of several pore sizes/lengths: 200, 250, 350 nm of diameter and 50, 1.5, and 0.7 μm of length. Before the infiltration process, the AAO template was dried in the oven under vacuum at 200 °C for 2 h. Then, the temperature was lowered to 120 °C, and the PFA was placed on the template for 8 hours under nitrogen atmosphere. The infiltration was favored by application of manual force when the polymer reached rubbery-liquid flow state. In order to observe that polymer nanofibers are obtained, the aluminum and alumina substrates were eliminated following a procedure described elsewhere.10 Briefly, the aluminum substrate was eliminated by treatment with a mixture of HCl, CuCl2 and H2O, and then, the alumina was dissolved in 5 wt% H3PO4 or 10 wt% NaOH. PFA infiltrated into AAO nanocavities was studied by Raman spectroscopy at room temperature.

Characterization techniques

Morphological characterization.
Scanning electron microscopy (SEM). The AAO templates and all the in situ polymerized and infiltrated samples were morphologically characterized by Scanning Electron Microscopy (SEM), Philips XL-30 ESEM. In order to observe the polymer nanofibers, aluminum and alumina substrates were eliminated as described before.
Chemical characterization by Raman spectroscopy (RAMAN). Two types of experiments have been carried out by Raman spectroscopy to study both the infiltration of PFA and the in situ polymerization of MFA in AAO nanocavities. Renishaw InVia Raman Microscope (Renishaw plc, Wottonunder-Edge, UK) was used fitted with a grating spectrometer of 1200 lines per mm and a Peltier-cooled charge-coupled device (CCD) detector, coupled to a confocal microscope. All spectra were processed using Renishaw WiRE 3.3 software.
Thermal characterization.
Differential scanning calorimetry (DSC). DSC experiments were performed by using a TA Q 2000 instrument equipped with a refrigerant cooling system. Both, the polymerization kinetics and the polymer thermal transitions, were studied with this technique.
Surface characterization.
Contact angle and sliding angle. The contact angle measurements were performed using Contact Angle System OCA (Dataphysics) equipment. The films were deposited onto glassy supports and the contact angles were measured at the air-film interface using 12 μL and 8 μL of water drops. The sliding angle was measured manually as a function of the angle needed to slide the water drop down of the surface (see ESI video).

Results and conclusions

Preparation of AAO templates

The synthesis of AAO templates was carried out under different anodization conditions, in order to obtain templates with nanopores of different sizes, as described in the Experimental section. The morphological characterization and pore arrangement of prepared templates was achieved by scanning electronic microscopy. The study through this technique allows for determination of both the surface and the length of AAO nanocavities by observing the top and the lateral view on the template. Fig. 1 shows SEM micrographs of some of the synthesized AAO templates, at different magnifications: A, B and C correspond to the surface of AAO templates and D, E and F to the length of the nanocavities. From Fig. 1A to C, it can be observed that the diameter of the pores is very homogeneous with values around 200, 250 and 350 nm, respectively. From the cross sectional SEM images (Fig. 1D–F) it can be observed that the length of the nanocavities varies from 50 μm (D) to 1.5 μm (E) and to 0.7 μm (F). From these pictures we can conclude that the nanoporosity of the templates is highly regular in size, which is maintained all along the pores.
image file: c4ra16728g-f1.tif
Fig. 1 SEM micrographs of surfaces of prepared AAO templates: ((A) ∼200 nm, (B) ∼250 nm and (C) ∼350 nm) top view and ((D) ∼50 μm, (E) ∼1.5 μm and (F) ∼0.7 μm) 3D lateral view illustrating AAO longitudinal nanocavities of AAO.

Polymerization and modeling for free radical polymerization of MFA in confinement

In order to study the free radical polymerization of a fluorinated acrylic monomer under confinement, in situ polymerization of MFA in AAO nanocavities was performed and the kinetics of the reaction was studied with respect to bulk polymerization. First, the kinetics of MFA polymerization in bulk was studied in a differential scanning calorimeter (DSC). Isothermal polymerizations were carried out at 80, 90, 100 and 110 °C using AIBN as initiator. Fig. 2 presents the evolution of the heat of the reaction (in normalized values, W g−1) and the polymerization enthalpies obtained are summarized in the Table 1. In order to study the conversion of these processes, the polymerization enthalpy (ΔHT) for the total conversion of the MFA to PFA was experimentally measured by DSC (see Fig. S1) and was given as 160 J g−1. This value was determined experimentally from an average of 3 dynamic DSC experiments in which after isothermal polymerization the samples were heated to high temperatures to polymerize any residual double bonds and calculating the residual heat release. The total enthalpy was calculated from the sum of the integrals of both the isothermal and dynamic parts of the experiment.
image file: c4ra16728g-f2.tif
Fig. 2 The heat release measured by the DSC in the polymerization of PFA at different reaction temperatures (80, 90, 100, 110 °C).
Table 1 The heat releases (ΔH) obtained by DSC in PFA polymerized at different isothermal processes (80, 90, 100, 110 °C)
Sample Polymerization T (°C) ΔH (J g−1)
PFA-80 80 149
PFA-90 90 163
PFA-100 100 161
PFA-110 110 139


Following this, the polymerization was carried out within the AAO templates. For this purpose, templates with pores of 250 nm and 50 μm of length were chosen and Raman spectroscopy was used to monitor the polymerization inside the template. The DSC technique was unfeasible to monitor the reaction because the volume of monomer that can be loaded into the template was too small. The polymerization of MFA monomer within the AAO nanotemplates was conducted at 70 °C and followed within time by Raman spectroscopy. In Fig. 3A, the Raman spectra of MFA monomer and PFA polymer film are plotted between 100 and 3200 cm−1, where the most significant bands are observable. The kinetics of the polymerization was monitored by following the C[double bond, length as m-dash]C stretching signal of the monomer, which appears at 1641 cm−1. Fig. 3B shows the evolution of that band during polymerization at 70 °C (spectra are given in Fig. S2). In order to calculate the conversion, the spectrum was normalized with the signal at 725 cm−1, which corresponds to the skeletal C–C stretching band that appears in both, the monomer and the polymer. Table S1 (see ESI) shows the evolution of the conversion.


image file: c4ra16728g-f3.tif
Fig. 3 Raman spectra of (A) FA and PFA bulk with assignation of differences between both spectra, (B) in situ polymerization of FA in AAO templates.
Kinetic model for free radical polymerization in confinement. Assuming the initiator concentration to be constant for the duration of the polymerization and there to be no diffusional constraints as conversion increases, the evolution of conversion in a bulk free radical polymerization is given by (see ESI for the derivation of this equation).
 
−ln(1 − XM) = kt (1)
where XM is the conversion of monomer expressed as a fraction, k is the overall kinetic rate coefficient and t is the time. The assumption of constant initiator concentration is only valid for short times so from a plot of −ln(1 − XM) versus time at short times yields a straight line with gradient proportional to the overall kinetic rate constant, k. The conversion, XM, at a given time is given from the heat release and the total reaction enthalpy, which was taken to be 160 J g−1 according to the experimentally determined value detailed in the previous section. The plot of −ln(1 − XM) versus time for polymerization of the fluoroacrylate monomer at various temperatures can be seen in Fig. 4.

image file: c4ra16728g-f4.tif
Fig. 4 Linear plots of bulk free radical polymerization of PFA at varying temperatures. The open symbols represent experimental data points and the straight lines correspond to the linear fit of the data in this region.

The overall rate constants calculated from Fig. 4 follow a linear trend in the Arrhenius plot presented in Fig. 5. This figure also includes the overall rate constant for a reaction conducted under confinement in the AAO nanotemplate from the data in Table S1 (see ESI). It can be seen that the value was much lower than that obtained from the unconfined reactions which indicates that confinement affects the concentration of radicals.


image file: c4ra16728g-f5.tif
Fig. 5 Arrhenius plot showing difference in rate constants between bulk polymerization (squares) and nanoconfined polymerization (star). The line represents the linear fit to the bulk polymerization data giving the Arrhenius parameters ln(A) = 19.1, Ea = 72.6 kJ mol−1.

In order to explain the significantly reduced rate of polymerization we considered the confinement effects experienced by propagating radicals. The situation observed here is similar in nature to dispersed phase polymerizations such as miniemulsion and emulsion polymerization where the concentration of radicals in the dispersed phase varies depending on the volume of monomer droplets/polymer particles dispersed in water.27,28 In this work, rather than being confined to droplets within a continuous medium, the reaction is confined to a cylindrical space defined by the dimensions of the AAO template used. We developed a mathematical model to account for the compartmentalization effects in such a case.

The model was constructed assuming the radicals were confined to short cylindrical sections of an infinite cylinder. The confinement of radicals to a volume defined by the radius of the compartment and a given length is a result of the lower effective volume experienced by the radicals in a cylindrical space compared to an infinite 3 dimensional space as in bulk polymerization. This is been demonstrated in Brownian dynamic simulations and diffusional models that predict the probability of escape of a particle from a cylindrical space is significantly lower than from a spherical/unconfined space of equivalent volume.29–32 The volume of the individual nanocompartments was given by assuming the length to be equal to the characteristic length of the system, given here by the diameter of the cylindrical compartment, D. Radical exit and entry between the cylindrical sections was assumed to be nonexistent. Such an assumption is valid based on the zero net diffusion of radicals along the cylinder. The net diffusion of zero would be expected because a concentration gradient along the cylinder is induced only by the ends of the cylinder. In a system where the length of the cylinder is much greater than its diameter this effect is insignificant and the system can be modelled as a series of individual cylindrical sections with diameter, D, and no net movement of species between them (see Fig. 6).


image file: c4ra16728g-f6.tif
Fig. 6 Schematic showing the volume of each cylindrical section according to the model.

In each compartment the material balance for the monomer is

 
image file: c4ra16728g-t1.tif(2)
where kp is the polymerization rate constant, [M] is monomer concentration and [P˙] is the radical concentration which is affected by the compartmentalization effects, and νp is the volume of the individual compartments. To account for these a modified Smith–Ewart type equation can be used that describes the number of compartments containing n propagating radicals. Let us consider a population of N nanocompartments of volume, vp, with a distribution of propagating radicals, N0, N1, N2,… that correspond to the number of nanocompartments with 0, 1, 2,… radicals. The number of radicals per compartment varies with time due to termination and initiation events only. These processes are shown in Fig. 7. The population balance of nanocompartments with n radicals is given by
 
image file: c4ra16728g-t2.tif(3)
where kd is the initiator decomposition constant, [I] is the initiator concentration, f is the initiator efficiency, kt is the termination constant and Na is Avogadro's number. The average rate of polymerization in one compartment is described by
 
image file: c4ra16728g-t3.tif(4)
where [n with combining macron] is the average number of radical per compartment given by
 
image file: c4ra16728g-t4.tif(5)


image file: c4ra16728g-f7.tif
Fig. 7 Process leading to change in radical concentration within a single compartment.

The rate constants used were taken from literature values for n-butyl acrylate and are shown in Table 2, namely no adjustable parameters were used in the model. No gel effect was taken into account in the model but given the typically low value of [n with combining macron] ([n with combining macron] ≈ 0.075) this omission is acceptable.

Table 2 Rate constants used in the kinetic model
Reaction step Parameter Value Ref.
Initiator decomposition AIBN → 2˙I kd (s−1) 2.8 × 10¹⁵[thin space (1/6-em)]exp(−15[thin space (1/6-em)]685/T) 33 and 34
f 0.4 This work
Propagation Pn˙ + M → Pn+1˙ kp (M−1 s−1) 2.2 × 10⁷[thin space (1/6-em)]exp(−2152/T) 35
Termination Pn˙ + Pm˙ → D kt (M−1 s−1) 1.3 × 10¹⁰[thin space (1/6-em)]exp(−1010/T) 36


The results of the model along with the experimental data and the predicted rate for a bulk polymerization are shown in Fig. 8. It can be seen that a good agreement between the experimental data and the compartmentalized model is obtained while the corresponding bulk free radical polymerization would proceed at a much faster rate. Thus, the current model accurately predicts that as the nanocompartment diameter is decreased the probability of termination is increased due to a higher local radical concentration resulting in a slower rate of polymerization. The results are also quantitatively in agreement with the Arrhenius plot in Fig. 5 which predicts a value of ln(k) = −6.27 compared to the simulated value in Fig. 8 of −6.38 for the bulk polymerization, and an experimental value of ln(k) = −7.54 compared to the simulated value of −7.82 for the compartmentalized polymerization. It is thought that this model and experimental system may prove useful for the detection and quantification of compartmentalization effects in many other radical systems, most notably controlled radical polymerizations, since complications arising from radical entry/exit and partitioning effects can be neglected.37–39


image file: c4ra16728g-f8.tif
Fig. 8 Graph of conversion versus time for polymerization of PFA in AAO template. Symbols represent experimental points while the dotted and solid lines represent the model prediction for bulk and nanoconfined polymerization respectively. The rate constants used are shown in Table 3.

In order to determine the nanostructure of the fibers SEM measurement was performed. Fig. 9 shows that nanofibers were successfully obtained by radical polymerization of MFA monomer in the AAO nanocavities. The diameter of the nanofibers was around 300 nm, very similar to the template used. A small difference of diameter between the AAO's pores and nanofibers is produced due to the dilatometer effect. However, nanostructures had similar dimensions and polymer nanofibers reproduced the dimensions of nanocavities.


image file: c4ra16728g-f9.tif
Fig. 9 SEM of nanofibers of PFA: (A) in situ polymerized into the AAO nanocavities; (B) infiltrated polymer into the AAO nanocavities (AAO templates pore size: 250 nm of diameter and 50 μm of length).

Infiltration of PFA in AAO templates

In the experiments documented above the nanostructured polymer surfaces were obtained by in situ polymerization of MFA under confinement into AAO templates. In order to expand the application of nanostructured polymers produced by this technique, the infiltration of the preformed polymer into the template was carried out. PFA was previously polymerized in bulk and then infiltrated into AAO templates of different pore diameters 200, 250 and 350 nm and length of 1,5 and 0.7 μm. Afterwards, the alumina and aluminum of AAO were removed following the procedure mentioned before. Evidence of the polymer infiltration into the nanocavities was achieved through the morphological study of the film using SEM. Fig. 10A–C shows the SEM images of nanofibers obtained with templates of 1.5 μm of length and different pore diameters, while Fig. 10D shows nanofibers of 0.7 μm of length and the 350 nm of pore diameters. Samples are named: n(B)PFA/200 fibers, n(B)PFA/250 and, n(B)PFA/350 fibers. No apparent difference in the fiber morphology neither in the crystallinity was obtained when comparing the PFA nanofibers synthesized inside the AAO templates and those obtained by infiltration in the same template.
image file: c4ra16728g-f10.tif
Fig. 10 n(B)PFA infiltrated into AAO templates with different pore sizes: (A) 200 nm of diameter and 1.5 μm of length; (B) 250 nm of diameter and 1.5 μm of length; (C) 350 nm of diameter and 1.5 μm of length; (D) 350 nm of diameter and 0.7 μm of length.

One of the most interesting properties of the fluorinated polymer surfaces is the hydrophobicity. However, the water-repellent character of a film is not only controlled by the chemical composition, but also by the surface morphology, that affects the contact angle of a water droplet placed on it. In rough morphologies, air pockets can be trapped between the surface and the liquid droplet and highly hydrophobic surfaces can be achieved. In this regard, and with Cassie's model very much in mind,40 the contact angle of nanostructured PFA surfaces obtained after infiltration of the polymer into AAO nanocavities were measured. Table 3 summarizes the results obtained. For the sake of comparison the contact angle of a flat PFA (no infiltrated) surface is included. These results demonstrated the increase in hydrophobicity of the same starting material after nanostructuration by using AAO templates. The nanocavities induced the roughness on the PFA surfaces increasing the amount of air cubicles trapped between the surface and water droplet, and superhydrophobic films were achieved as a consequence. This way, starting from hydrophobic PFA surfaces of around 114° of contact angle, superhydrophobic surfaces with contact angles above 150° were obtained by a nanostructuration of the material (see Fig. 11).

Table 3 Values of contact angles and f2 (the surface occupied by air when the porous PFA surface contacted the water droplet) corresponding to the n(B)PFA surfaces with different nanostructuring
Sample Characteristics θ (8 μL drop) f2 (%)
PFA Flat 114
n(B)PFA1 Ø ≈ 200 nm/L ≈ 1.5 μm 137 54.8
n(B)PFA2 Ø ≈ 250 nm/L ≈ 1.5 μm 159 88.8
n(B)PFA3 Ø ≈ 350 nm/L ≈ 1.5 μm 141 62.4
n(B)PFA4 Ø ≈ 350 nm/L ≈ 0.7 μm 151 78.9


image file: c4ra16728g-f11.tif
Fig. 11 Hydrophobicity enhancement of the fluorinated surface (PFA) after nanostructuring by AAO templates.

Furthermore, the effect of the AAO nanocavities pore size/length on the hydrophobicity of the PFA surfaces was studied. In an ideal system, when the pore size of the AAO templates increases the diameter of the resulting nanofibers is bigger, thus lowering the amount of air pockets trapped between the surface and water droplet, resulting in a contact angle that should be closer to that of the corresponding smooth surface. However, no clear correlation between the pore size (200, 250 and 350 nm) of the template and the final contact angles (n(B)PFA1 = 137°, n(B)PFA2 = 159°, n(B)PFA3 = 141°) was observed. This can be attributed to the random collapse of PFA nanofibers after removing the AAO nanocavities used as templates. PFA pillars are not rigid enough to maintain their individuality after removing the template and they tend to collapse. The same collapsing effect was observed using 0.7 μm pore length template (Fig. 10D) and a contact angle of 151° was achieved. In all cases, it can be observed that there is a clear enhancement in the hydrophobic property of the surface by molding the material with AAO templates, which is attributed to the roughness of the new surfaces.

As explained above, air pockets trapped between the surface and a water droplet were responsible for the enhancement in the hydrophobicity of the surface. According to Cassie's model, the surface occupied by the air can be calculated by the following equation:

cos[thin space (1/6-em)]θ* = f1[thin space (1/6-em)]cos[thin space (1/6-em)]θ1 + f2[thin space (1/6-em)]cos[thin space (1/6-em)]θ2
where f1 and f2 are corresponding to a fraction interfacial areas of the liquid in contact with the solid and the air, respectively, thus f1 + f2 = 1. When θ2 = 180° (contact angle of a liquid on air in the case of suspended droplets) the equation can be modified in the following way:
cos[thin space (1/6-em)]θ* = (1 − f2)cos[thin space (1/6-em)]θ1f2

Considering the contact angle of 114° for PFA in a smooth surface, f2 was calculated for each sample taking the contact angle values corresponding to 8 μL of water drop (see Table 3). The values of f2 given in Table 1 for n(B)PFA2,3,4 are much higher than the values that can be calculated from the AAO templates in Fig. 1, indicating that the nanopillar collapse induced an additional degree of roughness.

Another characteristic of superhydrophobic surfaces is the sliding angle, which is defined as the critical angle where a water droplet with a certain weight begins to slide down the inclined plane.41 An interesting superhydrophobic material is found in the nature, the “lotus leaf”, where the water droplet rolls off the leaf spontaneously when slightly tilted. Miwa et al. described the effect of the surface roughness on the sliding angle of the water droplet and they concluded by microstructural observation that surface structures that can trap air were important for the preparation of low-sliding-angle surfaces.41 Therefore, the sliding angle of the n(B)PFA surface was measured to obtain a small angle of 8° using a water droplet with a volume of around 8 μL. As a result of obtaining a superhydrophobic surface with structures that can trap air, the water droplet easily rolled off it when the substrate was inclined at a slight angle and a lotus effect was observed on the surface (see ESI video).

Conclusions

Polymerization kinetics of MFA within an AAO nanomold was studied and a mathematical model was derived to explain the decrease in polymerization rate compared to bulk free radical polymerization when it was conducted under confinement. The decrease in rate was directly related to the increased termination due to a lower effective volume experienced by the radicals when confined to a cylindrical volume. Raman spectroscopy was used to determine the polymerization inside the template and deduce degree of conversion, while nanofibers were observed by SEM.

The methodology proposed in this work, using AAO nanocavities as nanoreactor for obtaining nanostructured polymer surface can be generalized and applied to obtain polymer nanostructures of very different chemical nature and morphology by choosing the appropriate monomer or polymer and by tailoring the dimension of AAO cylindrical nanocavities, in which the diameter can vary from 20 to 400 nm and the length from a few to hundreds of microns.

Moreover, similar nanostructures were observed by SEM when in bulk polymerized PFA was infiltrated into the AAO nanocavities. The hydrophobic character of PFA surfaces was studied and observed that it increases considerably after nanostructuring a fluorinated acrylic polymer using AAO templates. This way, lotus leaf mimetic surfaces with superhydrophobic properties were obtained, in which the contact angle switched from 114° to 159° when increasing the roughness of the polymer. Air is trapped in these nanostructured materials, thus the water droplet easily rolled off them when the substrate was inclined at a slight angle of 8°.

Acknowledgements

IKERBASQUE foundation, University of Basque Country (UFI 11/56), Basque Government (GVIT373-10, postdoctoral fellowship and Etortek Nanoiker IE11-304) and Ministerio de Economía y Competitividad (CTQ2011-25572 and MAT2011-24797) are gratefully acknowledged for their financial support.

References

  1. C. R. Martin, Science, 1994, 266, 1961–1966 CAS.
  2. S. Grimm, A. Lange, D. Enke and M. Steinhart, J. Mater. Chem., 2012, 22, 9490–9493 RSC.
  3. J. Martín, A. Nogales and M. Martín-González, Macromolecules, 2013, 46, 1477–1483 CrossRef CAS.
  4. M. Steinhart, J. H. Wendorff, A. Greiner, R. B. Wehrspohn, K. Nielsch, J. Schilling, J. Choi and U. Gösele, Science, 2002, 296, 1997 CrossRef CAS PubMed.
  5. J. Martín, J. Maiz, J. Sacristan and C. Mijangos, Polymer, 2012, 53, 1149–1166 CrossRef PubMed.
  6. J. Martín and C. Mijangos, Langmuir, 2008, 25, 1181–1187 CrossRef PubMed.
  7. J. Martín, M. Krutyeva, M. Monkenbusch, A. Arbe, J. Allgaier, A. Radulescu, P. Falus, J. Maiz, C. Mijangos, J. Colmenero and D. Richter, Phys. Rev. Lett., 2010, 104, 197801 CrossRef.
  8. J. M. Giussi, I. Blaszczyk-Lezak, P. E. Allegretti, M. S. Cortizo and C. Mijangos, Polymer, 2013, 54, 5050–5057 CrossRef CAS PubMed.
  9. R. M. Michell, A. T. Lorenzo, A. J. Müller, M.-C. Lin, H.-L. Chen, I. Blaszczyk-Lezak, J. Martín and C. Mijangos, Macromolecules, 2012, 45, 1517–1528 CrossRef CAS.
  10. J. M. Giussi, I. Blaszczyk-Lezak, M. S. Cortizo and C. Mijangos, Polymer, 2013, 54, 6886–6893 CrossRef CAS PubMed.
  11. A. Serghei, W. Zhao, D. Miranda and T. P. Russell, Nano Lett., 2013, 13, 577–580 CrossRef CAS PubMed.
  12. Y. Guan, G. Liu, P. Gao, L. Li, G. Ding and D. Wang, ACS Macro Lett., 2013, 2, 181–184 CrossRef CAS.
  13. J. Maiz, H. Schäfer, G. Trichy Rengarajan, B. Hartmann-Azanza, H. Eickmeier, M. Haase, C. Mijangos and M. Steinhart, Macromolecules, 2013, 46, 403–412 CrossRef CAS.
  14. Y. Suzuki, H. Duran, M. Steinhart, H.-J. Butt and G. Floudas, Soft Matter, 2013, 9, 2621–2628 RSC.
  15. L. Feng, S. Li, Y. Li, H. Li, L. Zhang, J. Zhai, Y. Song, B. Liu, L. Jiang and D. Zhu, Adv. Mater., 2002, 14, 1857–1860 CrossRef CAS.
  16. B. Chen, P. Kwong and M. Gupta, ACS Appl. Mater. Interfaces, 2013, 5, 12701–12707 CAS.
  17. M. Gupta and K. K. Gleason, Thin Solid Films, 2009, 517, 3547–3550 CrossRef CAS PubMed.
  18. H. Yabu, M. Takebayashi, M. Tanaka and M. Shimomura, Langmuir, 2005, 21, 3235–3237 CrossRef CAS PubMed.
  19. Q. Shang, B. Fu, H. Liu, M. Wang and G. Xiao, J. Coat. Technol. Res., 2012, 9, 589–595 CrossRef CAS.
  20. J. A. Lee and T. J. McCarthy, Macromolecules, 2007, 40, 3965–3969 CrossRef CAS.
  21. U. Cengiz and H. Y. Erbil, Appl. Surf. Sci., 2014, 292, 591–597 CrossRef CAS PubMed.
  22. S. Bilgin, M. Isik, E. Yilgor and I. Yilgor, Polymer, 2013, 54, 6665–6675 CrossRef CAS PubMed.
  23. C.-W. Peng, K.-C. Chang, C.-J. Weng, M.-C. Lai, C.-H. Hsu, S.-C. Hsu, S.-Y. Li, Y. Wei and J.-M. Yeh, Polym. Chem., 2013, 4, 926–932 RSC.
  24. S. Agarwal, S. Horst and M. Bognitzki, Macromol. Mater. Eng., 2006, 291, 592–601 CrossRef.
  25. L. Ovaskainen, I. Rodriguez-Meizoso, N. A. Birkin, S. M. Howdle, U. Gedde, L. Wågberg and C. Turner, J. Supercrit. Fluids, 2013, 77, 134–141 CrossRef CAS PubMed.
  26. J. Maiz, J. Sacristan and C. Mijangos, Chem. Phys. Lett., 2010, 484, 290–294 CrossRef CAS PubMed.
  27. J. A. Alduncin, J. Forcada, M. J. Barandiaran and J. M. Asua, J. Polym. Sci., Part A: Polym. Chem., 1991, 29, 1265–1270 CrossRef CAS.
  28. C. Autran, J. C. de la Cal and J. M. Asua, Macromolecules, 2007, 40, 6233–6238 CrossRef CAS.
  29. A. M. Berezhkovskii, M. A. Pustovoit and S. M. Bezrukov, J. Chem. Phys., 2002, 116, 9952–9956 CrossRef CAS PubMed.
  30. S. M. Bezrukov, A. M. Berezhkovskii, M. A. Pustovoit and A. Szabo, J. Chem. Phys., 2000, 113, 8206–8211 CrossRef CAS PubMed.
  31. A. M. Berezhkovskii, M. A. Pustovoit and S. M. Bezrukov, J. Chem. Phys., 2003, 119, 3943–3951 CrossRef CAS PubMed.
  32. H. F. Hernandez and K. Tauer, Ind. Eng. Chem. Res., 2008, 47, 9795–9811 CrossRef CAS.
  33. N. Tefera, G. Weickert and K. R. Westerterp, J. Appl. Polym. Sci., 1997, 63, 1663–1680 CrossRef CAS.
  34. N. Tefera, G. Weickert and K. R. Westerterp, J. Appl. Polym. Sci., 1997, 63, 1649–1661 CrossRef CAS.
  35. J. M. Asua, S. Beuermann, M. Buback, P. Castignolles, B. Charleux, R. G. Gilbert, R. A. Hutchinson, J. R. Leiza, A. N. Nikitin, J.-P. Vairon and A. M. van Herk, Macromol. Chem. Phys., 2004, 205, 2151–2160 CrossRef CAS.
  36. J. Barth, M. Buback, P. Hesse and T. Sergeeva, Macromolecules, 2010, 43, 4023–4031 CrossRef CAS.
  37. P. B. Zetterlund, Polym. Chem., 2011, 2, 534–549 RSC.
  38. P. B. Zetterlund and M. Okubo, Macromolecules, 2006, 39, 8959–8967 CrossRef CAS.
  39. Y. Kagawa, P. B. Zetterlund, H. Minami and M. Okubo, Macromol. Theory Simul., 2006, 15, 608–613 CrossRef CAS.
  40. A. B. D. Cassie and S. Baxter, Trans. Faraday Soc., 1944, 40, 546–551 RSC.
  41. M. Miwa, A. Nakajima, A. Fujishima, K. Hashimoto and T. Watanabe, Langmuir, 2000, 16, 5754–5760 CrossRef CAS.

Footnote

Electronic supplementary information (ESI) available. See DOI: 10.1039/c4ra16728g

This journal is © The Royal Society of Chemistry 2015
Click here to see how this site uses Cookies. View our privacy policy here.