
A solution-phase synthesis method to prepare Pd-doped carbon aerogels for hydrogen storage
Minglong Zhongab,
Zhibing Fub,
Lei Yuanb,
Haibo Zhaob,
Jiayi Zhub,
Yongwei Heb,
Chaoyang Wang*b and
Yongjian Tang*ab
aInstitute of Modern Physics, Fudan University, Shanghai 200433, China. E-mail: 13110200008@fudan.edu.cn; Fax: +86 0816 2480830; Tel: +86 0816 2480830
bResearch Center of Laser Fusion, CAEP, Mianyang 621900, China. E-mail: zhongml06@sina.com
First published on 17th February 2015
Abstract
A solution-phase synthesis method was studied to prepare Pd-doped carbon aerogels (Pd/CAs) with different contents. The physical properties of the pristine CAs and Pd/CAs were systematically characterized by X-ray diffraction, transmission electron microscopy, scanning electron microscopy, and N2 adsorption measurements. We concluded that increasing Pd content produced an increase of the metal particle size and decrease of the surface area of the CAs. The effects of different amounts of palladium loading on the hydrogen uptake capacities of CAs have been investigated. The results show that Pd doping has a negative effect on hydrogen uptake capacity at 77 K. At 298 K, hydrogen uptake capacity depends on Pd content and particle size in the low pressure region (<10 bar). The hydrogen uptake capacity of the 4.8 wt% Pd/CA is about 0.11 wt% at 10 bar and 298 K. For higher pressure (>10 bar), the pore volume controls hydrogen uptake capacity.
1. Introduction
Carbon aerogels are three-dimensional nanoporous carbon materials that hold great technological promise for a variety of sustainable energy applications, including energy storage, adsorption and catalysis.1–6 One area of carbon aerogels research that has received significant attention is the use of these porous materials as sorbents for hydrogen.7–10 Safe and efficient storage of hydrogen is considered as one of the main challenges associated with utilization of this fuel source in the transportation sector.11 Two important criteria required for effective hydrogen physisorption are (1) a high surface area that provides a large number of sorption sites and (2) sufficiently deep potential wells so that the storage material can be utilized at reasonable operating temperatures.12 Carbon aerogels are the promising candidate for hydrogen physisorption due to their high surface area and low mass density. However, the low hydrogen binding energy (6 kJ mol−1) requires a cryogenic temperature (77 K) to be used for hydrogen storage in these materials.13 In general, the hydrogen uptake capacity of porous carbon at 77 K and 35 bar varies linearly with the surface area, and the value is about 1 wt% H2 per 500 m2 g−1 of surface area.14 The hydrogen uptake capacity dropped dramatically at near ambient temperature due to the low binding energy associated with porous carbon.To enhance hydrogen storage in carbon aerogels at room temperature, one of the promising ways is to dope carbon aerogels with a noble metal, such as palladium, according to the spillover phenomenon.15–21 Hydrogen spillover storage is defined as the dissociative chemisorption of hydrogen on transition or noble metal nanoparticles, and subsequent migration of hydrogen atoms onto adjacent surfaces of a receptor via surface diffusion. To incorporate metal nanoparticles onto sorbents, various approaches have been used, such as wet impregnation, chemical vapor deposition (CVD), plasma-assisted doping, and atomic layer deposition (ALD).22–25 The doping technique determines not only the size and distribution of the metal nanoparticles but also the contacts between metal nanoparticles and the supports, and subsequently affects the storage capacity of the metal-doped adsorbents. In these methods, the wet impregnation is the most commonly used, but not good for the control of metal nanoparticles size and could result the big loss of dopants. Besides, the destruction of the carbon structure might also occurred due to the high temperature heat-reduction treatment in the wet impregnation method. Recently, an elegant organic solution phase synthesis approach to self-organized FePt magnetic nanoparticles with controlled assembly thickness and surface roughness was successfully developed by the IBM researchers.26,27 Later, this method has been extended to prepare carbon supported metal nanoparticles.28
In the present paper, we modified this novel solution-phase synthesis method to prepare Pd/CAs with different Pd contents. The Pd nanoparticles with controlled size and homogeneous dispersion on the network of CAs were successfully prepared. The content of Pd was analyzed by inductively couple plasma optical emission spectrometer (ICP-OES). The morphology of Pd/CAs with different Pd contents was characterized by transmission electron microscopy (TEM) and scanning electron microscope (SEM). The effects of different amounts palladium loading on the hydrogen uptake capacities of CAs have been investigated.
2. Experimental section
2.1 Preparation of carbon aerogels
Carbon aerogels were derived from pyrolysis of resorcinol–formaldehyde (RF) gels. The RF gels were prepared by the sol–gel polymerization of resorcinol and formaldehyde with a slight amount of sodium carbonate as a basic catalyst. The molar ratio of formaldehyde (F) to resorcinol (R) was held at a constant value of 2, and the molar ratio of resorcinol (R) to catalyst (C) was set at R/C = 200. Deionized water was used as a diluent to control the final gel concentration. Sol–gel polymerization of the mixture was poured into glass vials and holding the mixture at 333 K for 6 days in water bath. Next, crosslinked RF gels were exchanged with acetone and subsequently dried from supercritical carbon dioxide (Tc = 304 K; Pc = 7.4 MPa). RF aerogels were pyrolyzed in a tube furnace at 1323 K under Ar flow. The resultant vitreous black monoliths were carbon aerogels, which were denoted by CAs in this paper. The apparent density of CAs, which was determined from the geometrical volume and weight of the monolith, was of 0.32 g cm−3. In order to uniformly dope Pd nanoparticles, the CAs monoliths were made into powder.2.2 Preparation of Pd-doped carbon aerogels
The Pd-doped carbon aerogels (Pd/CAs) were synthesized through a solution-phase method.29,30 A typical synthesis procedure for the Pd/CAs is presented in Fig. 1. In detail, the proper amount of Pd(acac)2 and 1 g CAs powder were mixed in 100 ml benzyl ether, and heated rapidly up to 373 K under the N2 flow. During this period, the light amount of oleic acid and oleylamine were injected into the solution, followed by quick injection of proper amount of LiBet3H. Then the mixture was heated to reflux at 453 K for 30 min to reduce Pd2+. The resultant black dispersion was isolated by centrifugation and washed 5 times with ethanol. The Pd/CAs were finally obtained by drying of the black powder at 333 K in an oven overnight. Following a similar procedure, the Pd/CAs with Pd loading 1.2 wt%, 2.7 wt%, and 4.8 wt% were prepared by adjusting the amount of Pd(acac)2 and the reducing agent (LiBet3H). The products were labeled as 1.2 wt% Pd/CAs, 2.7 wt% Pd/CAs, and 4.8 wt% Pd/CAs. The Pd content was determined by an inductively couple plasma optical emission spectrometer (Varian Vista Axial ICP-OES). | ||
| Fig. 1 Procedures of the solution-phase method for preparing Pd/CAs. | ||
2.3 Characterization
The X-ray diffraction (XRD) measurements were performed with a PANalytical X'Pert Pro X-ray diffractometer with nickel-filtered Cu Kα radiation as the X-ray source. The pattern was recorded in the 2θ range of 10–90° with a step of 0.02°. The morphology of the samples was characterized by field emission scanning electron microscope (SEM, Nova 600i) equipped with energy dispersive spectroscopy (EDS) analysis and transmission electron microscope (TEM, JEM-200CM, 200 kV). Specimen for TEM examination was prepared by carefully crushing the sample with a mortar and pestle set. The resulting powders were suspended in ethanol and proceed with ultrasonication to obtain a uniform suspension. One or two drops of this suspension were deposited onto a copper mesh grid coated with a holey carbon film, followed by being dried in air at room temperature.The textural properties were determined from nitrogen adsorption–desorption isotherms measured with a Quantachrome Autosorb-1 Instrument. The samples were degassed for 10 h under vacuum at 553 K prior to any adsorption experiment. N2 adsorption data were obtained and treated as described elsewhere for obtaining: (1) surface area (SBET), by the BET calculation method at relative pressures between 0.05 and 0.3;31 (2) total pore volume (Vt), defined as the volume of liquid nitrogen correspond to the amount adsorbed at a relative pressure P/P0 = 0.99; (3) micropore volume (Vmic), according to the Dubinin–Radushkevich (DR) method.32 The pore-size distributions were determined using the Density Functional Theory (DFT) method by Quantachrome's data reduction software with N2 isotherms collected at 77 K.33 Hydrogen adsorption was measured by a P–C–T hydrogen storage performance tester at 77 K and 298 K. The samples were placed in a stainless steel sample holder closed with a metal seal. Before each measurement, the samples were outgassed overnight under primary vacuum at 573 K. The sample holder was immersed in a liquid nitrogen dewar at 77 K or in a thermostated water bath maintained at 298 K, and high purity hydrogen was introduced step by step until the hydrogen pressure was up to 50 bar. The pressure variations due to both gas cooling and hydrogen sorption were measured after thermodynamic equilibrium, which was usually within a few minutes.
3. Results and discussion
Fig. 2 shows the XRD patterns of pristine CAs and Pd/CAs samples. As expected, the pristine CAs corresponds to a carbon with a low structural organization (low degree of graphitization) as indicating by the two observed broad peaks at 2θ = 23° and 2θ = 43°. For the 1.2 wt% Pd/CAs, an additional weak peak is observed, which can be indexed to the cubic phase of Pd as Pd (111). For the 2.7 wt% and 4.8 wt% Pd/CAs, in addition to these peaks, the fingerprint peaks of palladium corresponding to the (200), (220), and (311) plane reflections are observed. These four peaks can be indexed with the cubic cell of palladium, which confirms the presence of Pd in Pd/CAs. The XRD pattern of Pd/CAs also shows that the introduction of palladium in the carbon does not lead to a structural change of the carbon at an atomic level. From the analysis of XRD patterns, a conclusion can be drawn that the metal Pd was successfully doped in CAs by the solution-phase method. | ||
| Fig. 2 XRD patterns of Pd/CAs with different Pd contents. The Pd fingerprint peaks have been indicated against the respective peaks. | ||
Fig. 3 shows typical TEM images and particle size histograms of Pd/CAs with different Pd contents. The dark nanoparticles in TEM images are the Pd catalyst. It is evidenced that most Pd nanoparticles are round and uniformly dispersed on the CAs support for all the samples. Only a few agglomerations were observed for the 2.7 wt% and 4.8 wt% Pd/CAs. Comparison of Fig. 3(a–c) indicates the effects of the Pd content on the general morphology and particle size of the Pd loaded on CAs. The histograms of particle sizes evaluated from over 100 particles in an arbitrarily chosen area are shown in Fig. 3(d–f). The 1.2 wt% Pd/CAs shows a narrow particle size distribution between 2 and 6 nm with a mean particle size of 3.9 nm in Fig. 3(d). Fig. 3(e) shows a broader size distribution between 2 and 16 nm with a mean particle size of 7.3 nm for the 2.7 wt% Pd/CAs. For the 4.8 wt% Pd/CAs (Fig. 3(f)), the particle size distribution of Pd is similar to that in Fig. 3(e), and the mean particle size is 9.2 nm. The microstructural TEM study suggests that the mean particle size depends on the Pd content: the lower the metal content, the smaller the particle size.
 | ||
| Fig. 3 TEM images and particle size histograms of (a and d) 1.2 wt% Pd/CAs, (b and e) 2.7 wt% Pd/CAs, (c and f) 4.8 wt% Pd/CAs. | ||
Fig. 4 shows typical SEM images of 4.8 wt% Pd/CAs. It is easy to note that the introduction of palladium in CAs does not lead to an obvious structural change of the CAs. Elemental mapping may provide a meaningful representation of the element distribution that comprises a surface, as shown in Fig. 4(b) and (c), which display the C and Pd elemental mapping of 4.8 wt% Pd/CAs. It can be seen from Fig. 4(b) and (c) that the C and Pd atoms were uniformly distributed in the sample. The HRTEM image of 4.8 wt% Pd/CAs is shown in Fig. 4(d). It is clearly observed that there is a Pd nanoparticle with the diameter of 9 nm embedding in the network of CAs. In addition, the lattice fringes corresponding to the Pd (111) spacing are observed on the surface of amorphous carbon matrix.
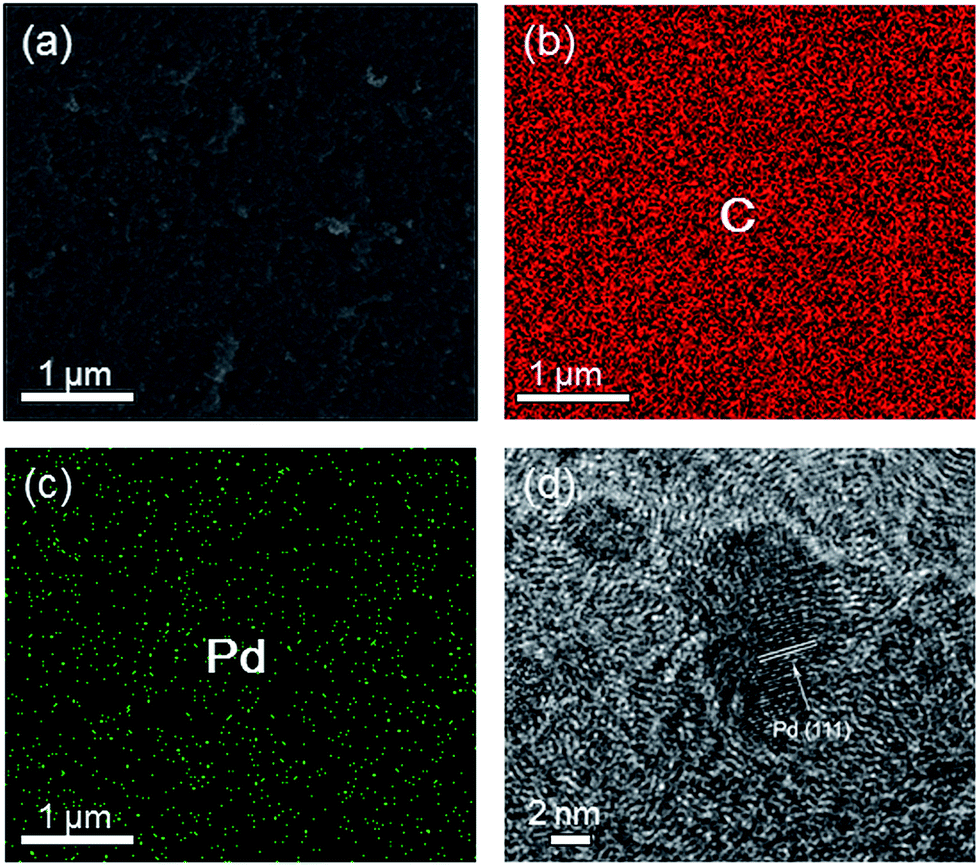 | ||
| Fig. 4 SEM image (a), EDX mapping distribution images (b and c), and HRTEM image (d) of 4.8 wt% Pd/CAs. | ||
The textural properties of the pristine CAs and Pd/CAs samples were analyzed by nitrogen adsorption at 77 K. The nitrogen adsorption–desorption isotherms of the samples are shown in Fig. 5(a). According to International Union of Pure and Applied Chemistry (IUPAC) definition, both samples exhibited type IV isotherms with type H2 hysteresis loops. This indicated the structure of these carbons is retained after doping with Pd nanoparticles. In the low relative pressure range (<0.1), nitrogen adsorption capacity is very low indicating a small number of micropores in CAs. The major difference between the pristine CAs and Pd/CAs samples is observed for the nitrogen adsorption in the high relative pressure range, which is characteristic of the presence of larger mesopores. Table 1 shows the textural parameters determined from N2 adsorption at 77 K for the samples studied. SBET, Vt, Vmic and Vmes are expressed relatively to the total sample mass, including Pd. The BET surface areas of Pd/CAs were lower than the pristine CAs. In addition, the reduction of Vt, Vmic and Vmes was observed. This was due to the increased weight and partial pore blocking caused by the doped Pd nanoparticles. The doping of Pd nanoparticles on the CAs was confirmed by the TEM. The surface area difference among 1.2 wt% Pd/CAs, 2.7 wt% Pd/CAs, and 4.8 wt% Pd/CAs was attributed to the different Pd content. Fig. 5(b) depicts a comparison of DFT calculated micropores size distribution of the pristine CAs and Pd/CAs. The results show that the micropores and mesopores volume of CAs were reduced after Pd introduction.
 | ||
| Fig. 5 Nitrogen isotherms (a) and pore size distribution (b) of Pd/CAs with different Pd contents. | ||
| Sample | SBET (m2 g−1) | Vt (cm3 g−1) | Vmic (cm3 g−1) | Vmes (cm3 g−1) |
|---|---|---|---|---|
| Pristine CAs | 700 | 3.20 | 0.257 | 2.94 |
| 1.2 wt% Pd/CAs | 617 | 3.14 | 0.232 | 2.91 |
| 2.7 wt% Pd/CAs | 566 | 3.08 | 0.217 | 2.86 |
| 4.8 wt% Pd/CAs | 499 | 2.61 | 0.184 | 2.43 |
Fig. 6(a) shows hydrogen uptake at 77 K as a function of pressure for Pd/CAs. The highest performance was obtained for pristine CAs, whereas the lowest one was the material containing the highest Pd amount, 4.8 wt% Pd/CAs. In addition, a progressive decrease of hydrogen uptake capacities with the increase of Pd content was observed. At low temperature 77 K, the physical adsorption is the mainly contribution to the hydrogen storage. So the hydrogen uptake capacities decreased with Pd content mainly due to the increase of the overall weight of sample by Pd and to the decrease of the surface area.
 | ||
| Fig. 6 Hydrogen uptake isotherms of Pd/CAs with different Pd contents at (a) 77 K and (b) 298 K. Inset in (b) shows low pressure (<10 bar) hydrogen uptake isotherms of Pd/CAs at 298 K. | ||
Hydrogen uptake isotherms of the pristine CAs and Pd/CAs at 298 K are presented in Fig. 6(b). The hydrogen uptake capacity at 298 K is much lower than at 77 K since physisorption is a function of van der Waals forces. However, inset in Fig. 6(b) shows the hydrogen uptake capacities of all the Pd/CAs samples enhanced comparing to the pristine CAs in the low pressure region (<10 bar). The hydrogen uptake capacity of the 4.8 wt% Pd/CAs is about 0.11 wt% at 10 bar and 298 K. This value was higher than those of the Pd/carbon composites,34,35 but lower than that of Pd/HCS materials.36 The enhancement of hydrogen storage should be attributed to the spillover of atomic hydrogen from Pd nanoparticles to the CAs, not to the surface area difference as the Pd/CAs samples have lower surface areas than the pristine CAs. It seems that the hydrogen spillover effect has not obvious contribution to the total hydrogen adsorption at 77 K. It should be noted that the larger the Pd content, the higher the hydrogen storage capacity. This is due to the more Pd nanoparticles providing more places for the formation of the hydrides. In addition, the formation of Pd hydrides is particle size dependent. The mean particle size of the 4.8 wt% Pd/CAs is 9.2 nm, which is larger than the particle sizes of 2.7 wt% and 1.2 wt% Pd/CAs. Comparing to the smaller Pd particles, the large Pd particles could provide more interstitial places for the formation of hydrides and lead subsequently to a more intense new antibonding state.36 This means that the more hydrogen per Pd atom can be absorbed in the larger particles. As a result, the high hydrogen uptake capacity of the 4.8 wt% Pd/CAs could be attributed to the high Pd content and suitable size of Pd nanoparticles. For higher pressure (>10 bar), hydrogen physisorption appeared in the porous volume of CAs. As the increase of Pd leads to a monotonous decrease of the pore volume, the slope of hydrogen uptake isotherms of Pd/CAs decreased with the pressure increase. As a result, it was observed the hydrogen uptake capacity of pristine CAs was higher than all the Pd/CAs samples under the pressure of 50 bar (Fig. 6(b)). These results were in agreement with the previously report.15 This behavior means a linear combination of chemisorption and physisorption for hydrogen storage at 298 K. The physisorption depends on pore volume and is pressure-dependent. To the contrary, the chemisorption depends on metal content and particle size but is almost independent of pressure. Hydrogen is initially stored at low pressure in the form of Pd hydrides, followed by hydrogen physisorption in the porous volume of carbon.
4. Conclusions
In this study, the Pd-doped CAs with different contents were successfully prepared by a solution-phase method. We found that the different contents had particular effects on the Pd particle size and dispersion, which can change the hydrogen uptake characteristics of CAs. Hydrogen storage at 77 K fundamentally depends on the textural properties of CAs, Pd doping decreases hydrogen storage capacities by decreasing the surface area available for physisorption. However, all the Pd/CAs samples showed enhanced hydrogen uptake capacities compared to the pristine CAs in the low pressure region (<10 bar) at 298 K. In addition, the hydrogen uptake capacities depend linearly on Pd content. The high hydrogen uptake capacity of the 4.8 wt% Pd/CAs could be attributed to the high Pd content and suitable size of Pd nanoparticles. For higher pressure (>10 bar), hydrogen uptake capacity depends on pore volume so the introduction of Pd does not bring capacity enhancement.Acknowledgements
This work is supported by the national Natural Science Foundation of China (NSFC) under grants 51101141.References
- A. Stein, Z. Wang and M. A. Fierke, Adv. Mater., 2009, 21, 265–293 CrossRef CAS.
- Y. S. Hu, P. Adelhelm, B. Smarsly, S. Hore, M. Antonietti and J. Maier, Adv. Funct. Mater., 2007, 17, 1873–1878 CrossRef CAS.
- J. Chmiola, G. Yushin, Y. Gogotsi, C. Portet, P. Simon and P. L. Taberna, Science, 2006, 313, 1760–1763 CrossRef CAS PubMed.
- S. Tabata, H. Iida, T. Horie and S. Yamada, Med. Chem. Commun., 2010, 1, 136–138 RSC.
- K. Lee, J. Lytle, N. Ergang, S. Oh and A. Stein, Adv. Funct. Mater., 2005, 15, 547–556 CrossRef CAS.
- G. Chai, I. Shin and J. S. Yu, Adv. Mater., 2004, 16, 2057–2061 CrossRef CAS.
- K. Xia, Q. Gao, C. Wu, S. Song and M. Ruan, Carbon, 2007, 45, 1989–1996 CrossRef CAS PubMed.
- Z. Yang, Y. Xia and R. Mokaya, J. Am. Chem. Soc., 2007, 129, 1673–1679 CrossRef CAS PubMed.
- Y. Gogotsi, R. K. Dash, G. Yushin, T. Yildirim, G. Laudisio and J. E. Fischer, J. Am. Chem. Soc., 2005, 127, 16006–16007 CrossRef CAS PubMed.
- B. Panella, M. Hirscher and S. Roth, Carbon, 2005, 43, 2209–2214 CrossRef CAS PubMed.
- L. Schlapbach and A. Züttel, Nature, 2001, 414, 353–358 CrossRef CAS PubMed.
- K. Denbigh, The Principles of Chemical Equilibrium, Cambridge University Press, 1971 Search PubMed.
- B. Panella, M. Hirscher and S. Roth, Carbon, 2005, 43, 2209–2214 CrossRef CAS PubMed.
- R. Chahine and P. Benard, in Advances in Cryogenic Engineering, ed. P. Kittle, Plenum Press, New York, 1998, vol. 43, p. 1257 Search PubMed.
- J. Biener, M. Stadermann, M. Suss, M. A. Worsley, M. M. Biener, K. A. Rose and T. F. Baumann, Energy Environ. Sci., 2011, 4, 656–667 CAS.
- L. Wang, A. J. Lachawiec Jr and R. T. Yang, RSC Adv., 2013, 3, 23935–23952 RSC.
- U. Roland, T. Braunschweig and F. Roessner, J. Mol. Catal. A: Chem., 1997, 127, 61–84 CrossRef CAS.
- S. J. Teichner, Stud. Surf. Sci. Catal., 1993, 77, 27–43 CrossRef CAS.
- L. Wang, F. H. Yang and R. T. Yang, Ind. Eng. Chem. Res., 2009, 48, 2920–2926 CrossRef CAS.
- Y. Y. Liu, J. L. Zeng, J. Zhang, F. Xu and L. X. Sun, Int. J. Hydrogen Energy, 2007, 32, 4005–4010 CrossRef CAS PubMed.
- S. Z. Mortazavi, P. Parvin, A. Reyhani, R. Malekfar and S. Mirershadi, RSC Adv., 2013, 3, 1397–1409 RSC.
- W. Zhao, V. Fierro, C. Zlotea, M. T. Izquierdo, C. Chevalier-César, M. Latroche and A. Celzard, Int. J. Hydrogen Energy, 2012, 37, 5072–5080 CrossRef CAS PubMed.
- L. Wang, N. R. Stuckert, H. Chen and R. T. Yang, J. Phys. Chem. C, 2011, 115, 4793–4799 CAS.
- C. J. Liu, G. P. Vissokov and B. W. L. Jang, Catal. Today, 2002, 72, 173–184 CrossRef CAS.
- S. T. Christensen, H. Feng, J. L. Libera, N. Guo, J. T. Miller, P. C. Stair and J. W. Elam, Nano Lett., 2010, 10, 3047–3051 CrossRef CAS PubMed.
- S. H. Sun, C. B. Murray, D. Weller, L. Folks and A. Moser, Science, 2000, 287, 1989–1992 CrossRef CAS.
- S. H. Sun, S. Anders, T. Thomson, J. E. E. Baglin, M. F. Toney, H. F. Hamann, C. B. Murray and B. D. Terris, J. Phys. Chem. B, 2003, 107, 5419–5425 CrossRef CAS.
- H. Yano, M. Kataoka, H. Yamashita, H. Uchida and M. Watanabe, Langmuir, 2007, 23, 6438–6445 CrossRef CAS PubMed.
- Z. Zhang, L. Xin and W. Li, Int. J. Hydrogen Energy, 2012, 37, 9393–9401 CrossRef CAS PubMed.
- Z. Zhang, L. Xin, K. Sun and W. Li, Int. J. Hydrogen Energy, 2011, 36, 12686–12697 CrossRef CAS PubMed.
- S. Brunauer, P. H. Emmet and E. Teller, J. Am. Chem. Soc., 1938, 60, 309–319 CrossRef CAS.
- M. M. Dubinin, Carbon, 1989, 27, 457–467 CrossRef CAS.
- P. Tarazona, Surf. Sci., 1995, 331–333, 989–994 CrossRef CAS.
- R. Campesi, F. Cuevas, R. Gadiou, E. Leroy, M. Hirscher, C. Vix-Guterl and M. Latroche, Carbon, 2008, 46, 206–214 CrossRef CAS PubMed.
- P. Dibandjo, C. Zlotea, R. Gadiou, C. M. Ghimbeu, F. Cuevas, M. Latroche, E. Leroy and C. Vix-Guterl, Int. J. Hydrogen Energy, 2013, 38, 952–965 CrossRef CAS PubMed.
- K. Wenelska, B. Michalkiewicz, J. Gong and T. Tang, Int. J. Hydrogen Energy, 2013, 38, 16179–16184 CrossRef CAS PubMed.
| This journal is © The Royal Society of Chemistry 2015 |