R. A. Cormanichab,
R. Rittner*b and
M. Bühl*a
aEastChem School of Chemistry, University of St Andrews, North Haugh, St Andrews, Fife KY16 9ST, UK. E-mail: mb105@st-andrews.ac.uk; rittner@iqm.unicamp.br
bChemistry Institute, State University of Campinas, P.O. Box 6154, 13083-970, Campinas, SP, Brazil
First published on 13th January 2015
The conformational behaviour of Ac-Gly-NHMe in nonpolar, polar and polar protic solutions was systematically studied in this work by theoretical calculations and experimental infrared and 1H NMR spectroscopies. Ac-Gly-NHMe prefers a gauche conformer with a strong seven-membered intramolecular hydrogen bond for the isolated compound and in nonpolar solvents, but such preference changes in polar and polar protic solvents. Elucidation of Ac-Gly-NHMe preferences was also supported by studying the conformers of its CF3-C(O)-Gly-NHMe and Ac-Gly-N(Me)2 derivatives in solution.
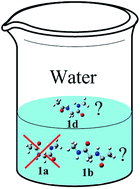
In an effort to understand amino acid conformational preferences and the forces that govern such preferences we have been undertaking systematic studies for different amino acid compounds and some of their ester derivatives.6 Contrary to the common interpretations from the literature, we have found that the interplay between steric and hyperconjugative interactions and not IHBs are the main forces ruling the conformational behaviour of this important class of natural compounds.
The rationalization of the forces that govern peptide-like compounds of the general formula Ac-R-NHMe (R = amino acid) is desirable to understand the structures of natural macromolecules that contain such amino acid residues as building blocks. In the present paper we report experimental 1H NMR and infrared (IR) conformational studies of the dipeptide model Ac-Gly-NHMe (1) and its fluorinated CF3-C(O)-Gly-NHMe (2) and N-methylated Ac-Gly-N(Me)2 (3) derivatives (Scheme 1). The experiments in solution are supported by theoretical calculations, in the framework of quantum topological methods as the Quantum Theory of Atoms in Molecules (QTAIM),7 Electron Localization Functions (ELF)8 and the recently developed Non-Covalent Interactions (NCI)9 and Density Overlap Regions Indicator10 methods and the orbital based Natural Bond Orbital (NBO) method.11
![]() | ||
Fig. 2 Most stable conformers of compounds 1, 2 and 3 optimised at the B3LYP-D3/aug-cc-pVDZ level (O red, N blue, C grey). |
Additionally, a B3LYP/cc-pVDZ Monte Carlo conformational search was carried out in Spartan 14 program17 by using a 10 kcal mol−1 threshold and 5000 K maximum temperature, which give rise to many more conformers, namely 11, 9 and 7 for 1, 2 and 3, respectively (Fig. S2 in the ESI†). Optimisations and frequency calculations were carried out at the B3LYP and B3LYP-D3 levels for all conformers found in the Monte Carlo calculations, and the lack of negative frequencies confirmed that all conformers are energy minima. All conformers of compound 1 were re-optimised by using the B3LYP, BLYP, BP86, B97 and M06 functionals with and without DFT-D3 (ref. 18 and 19) corrections and the MP2 ab initio method with the aug-cc-pVDZ basis set and also by using the AM1, PM3 and PM6 semi-empirical methods (energy values in Table S1 in the ESI†) as implemented in the Gaussian 09 program. The B3LYP-D3/aug-cc-pVDZ level showed the smallest mean absolute deviation (MAD) from CCSD(T)-F12a/VDZ-F12 single point calculations performed on MOLPRO program20 (Table S1 in the ESI†) and, hence, it was used in all subsequent calculations. The B3LYP-D3/aug-cc-pVDZ energies were converted into enthalpies and Gibbs free energies using standard thermodynamic corrections from the B3LYP-D3/aug-cc-pVDZ frequency calculations. The enthalpies were in better agreement with experimental IR populations than Gibbs free energies (see the section on infrared spectra in the ESI†). All conformers were also optimised in the IEF-PCM [integral equation formalism variant of the polarizable continuum model]21 implicit solvent model at the B3LYP-D3/aug-cc-pVDZ level. NBO analysis11 was performed at the B3LYP-D3/aug-cc-pVDZ level employing geometries fully optimised at the same level for the isolated compounds. NMR 3JHH spin–spin coupling constant (SSCC) values were calculated at the BHandH/EPR-III level.22,23 This level was used because the BHandH functional performs well for a large variety of spin–spin coupling constants (SSCCs) involving carbon, fluorine and hydrogen atoms24 and the EPR-III basis set that was developed and optimised for the computation of the Fermi-contact term, which is usually the leading component of SSCCs.25 The second-order polarization propagator approximation (coupled cluster singles and doubles) SOPPA(CCSD)26 method was also used for comparison with the BHandH/EPR-III level. SOPPA(CCSD) calculations used the EPR-III basis set for 1H and the cc-pVDZ basis for the remaining atoms and were ran in the Dalton 2013 program.27 QTAIM, ELF, NCI and DORI topological analysis were carried out on the electron densities obtained from the B3LYP-D3/aug-cc-pVDZ optimised geometries through the AIMALL 14.06.21,28 TopMod29 and NCIPLOT 3.09 programs, respectively.
Isolated | CH2Cl2 | Acetone | CH3CN | DMSO | CH3OH | H2O | |
---|---|---|---|---|---|---|---|
1a | 61.1 | 46.1 | 36.5 | 32.4 | 31.2 | 33.0 | 29.2 |
1b | 36.4 | 27.3 | 24.8 | 23.1 | 22.6 | 23.4 | 21.5 |
1c | 1.5 | 3.6 | 3.1 | 2.9 | 2.8 | 2.9 | 2.6 |
1d | 0.8 | 19.6 | 31.9 | 37.7 | 39.5 | 36.9 | 42.7 |
1e | 0.2 | 2.2 | 2.5 | 2.5 | 2.5 | 2.5 | 2.5 |
1f | 0.0 | 0.0 | 0.3 | 0.3 | 0.3 | 0.3 | 0.3 |
1g | 0.0 | 1.0 | 0.5 | 0.6 | 0.6 | 0.6 | 0.6 |
1h | 0.0 | 0.2 | 0.3 | 0.3 | 0.3 | 0.3 | 0.4 |
1i | 0.0 | 0.1 | 0.1 | 0.1 | 0.1 | 0.1 | 0.1 |
1j | 0.0 | 0.0 | 0.0 | 0.0 | 0.0 | 0.0 | 0.0 |
1k | 0.0 | 0.0 | 0.0 | 0.0 | 0.0 | 0.0 | 0.0 |
Experimental and theoretical IR spectra of the amide N–H bond stretching region of Ac-Gly-NHMe are shown in Fig. 3 (in CH2Cl2 and CH3CN solvents). Only conformers 1a, 1b and 1d, which account for >90% of total population at the B3LYP-D3/aug-cc-pVDZ level, were used for the theoretical. Experimental IR populations were corrected for each conformer with the calculated N–H stretching intensities in km mol−1 (for the graph of calculated intensity for each conformer see Fig. S3 in the ESI†).
The observed and calculated populations of 1a and 1b in CH2Cl2 are in reasonable agreement.32 From experimental IR, conformers 1a and 1b are the most populated conformers in CH2Cl2, with an observed population of 68.1% and 31.9%, respectively (Fig. 3). The calculated population of conformer 1a (46.1%) is smaller than the observed experimental IR result and calculated population of conformer 1b (27.3%) is in good agreement with the experimental. Conformer 1d could not be observed experimentally, which IR band could be hidden below the most abundant 1a and 1b conformers. Population of conformer 1d in CH2Cl2 is calculated to be 19.6% at the B3LYP-D3/aug-cc-pVDZ level with IEF-PCM implicit solvent model. The IEF-PCM calculations in acetonitrile indicate that conformer 1d becomes the global minimum with 37.7% of the total population. However, the experimental N–H band of Ac-Gly-NHMe in acetonitrile is much broader than in CH2Cl2 (Fig. 3), presumably due to intermolecular HB formation with the solvent, and no experimental conformer population could be derived from this spectrum. It was also not possible to obtain the experimental populations in H2O and D2O from the amide N–H stretching bands, since H2O absorbs strongly in the same region range as N–H bands of 1 and also D2O absorbs in the same region as N–D bands, which arise from proton exchange with the solvent. However, experimental regions corresponding to amide I (CO stretchings) and amide II bands [C(O)–N–H angular deformations] could be observed. While they present many shoulders in CH2Cl2 and CH3CN, corresponding to a mix of conformers 1a, 1b and 1d (Fig. 4a and c), these bands seem to be more symmetrical in H2O and D2O (Fig. 4e and f). Thus, one might infer that only one conformer would be present in water. However, the bands are very broad in water (presumably due to intermolecular HB formation between Ac-Gly-NHMe C
O and N–H bonds and the solvent); and bands from other conformers could just be hidden within. In fact, the IEF-PCM calculations (Table 1) indicate that all conformers 1a, 1b and 1d would be present in considerable amount in water, 1d being the global minimum.
QTAIM, ELF, NCI, DORI and NBO methods were then applied for the isolated Ac-Gly-NHMe conformers 1a, 1b and 1d in order to understand the intramolecular interactions that stabilise each conformer. The ELF, NCI, DORI and NBO methods found an IHB for all 3 conformers, while QTAIM found it only for conformer 1a (ESI Fig. S4†). Indeed, QTAIM is being repeatedly criticised in the literature, since it may not find a HB in situations where it is expected to be formed either by other theoretical methods or by experiment.33 The ELF, through the so-called core-valence bond index (CVBI),34 indicates that conformer 1a forms the strongest IHB. The same is found with NCI and DORI, through the signal(λ2)ρ values from RDG and DORI peaks corresponding to IHB formation, and with NBO analysis, through n → σ*NH interaction energies (Table 2; details in the ESI Fig. S4–S8†). These findings are consistent with the short calculated CO⋯H–N distance in the 7-membered ring closed by the IHB (2.04 Å; Table 2). Larger distances are found in conformer 1b, which forms a weak C
O⋯H–N IHB within a 5 membered ring (2.21 Å) and in 1d, which forms the weakest N⋯H–N hydrogen bond (2.35 Å).
Ac-Gly-NHMe | CF3-C(O)-Gly-NHMe | ||||||
---|---|---|---|---|---|---|---|
1a | 1b | 1d | 2a | 2b | 2c | 2d | |
a More positive CVBI values correspond to weaker IHBs.b More negative values correspond to stronger IHBs. | |||||||
ρ | 0.022 | — | — | 0.017 | — | — | — |
CVBIa | +0.012 | +0.032 | +0.042 | +0.027 | +0.030 | +0.030 | +0.045 |
sign(λ2)ρb | −0.022 | −0.019 | −0.016 | −0.017 | −0.020 | −0.020 | −0.015 |
nO(1) → σ*NH | 2.57 | 0.67 | — | 1.65 | 0.79 | 0.83 | — |
nO(2) → σ*NH | 3.76 | 2.04 | — | 2.69 | 2.49 | 2.59 | — |
nN → σ*NH | — | — | 1.24 | — | — | — | 1.24 |
nF(2) → σ*NH | — | — | — | 1.10 | 0.94 | 0.94 | 1.10 |
IHB distance | 2.04 | 2.21 | 2.35 | 2.14 | 2.19 | 2.18 | 2.37 |
The N⋯H–N hydrogen bond in 1d may be rationalised to be weak due to the low availability of the amide nitrogen lone pairs (nN), which are expected be in resonance within the R2N–CO amide fragment. Indeed, the Natural Resonance Theory (NRT),35 indicates that 3 from the 4 main Ac-Gly-NHMe resonance hybrids (from a total of 126) have the nitrogen lone pairs in resonance (Fig. 5). All charged resonance hybrids strengthen the IHBs in conformers 1a and 1b, but weaken the N⋯H–N IHB in 1d IHB, since it localises negative charges in the O atoms (H atom acceptors in 1a and 1b) and positive charges on the N atoms (H atom acceptor in 1d).
It is worth to mention that both NCI and DORI found other weak intramolecular interactions, such as 5-membered O⋯H–C IHBs, that could not be found by QTAIM, ELF and NBO methods, wherein DORI found the highest number of those interactions (ESI; Fig. S4–S8†). Such interactions are indicated to be stabilising by both NCI and DORI. However, both NCI and DORI use the sign of λ2 parameter in order to differentiate stabilising and destabilising interactions. As observed in previous works: “care is recommended when interpreting the sign of λ2 in very weak interactions, because in these cases the sign might depend on the method of calculation”.36
Relative total enthalpy corrected energies [ΔH(T)], natural non-Lewis (hyperconjugative) contribution energies [ΔH(NL)] and natural Lewis structure (steric/electrostatic) contribution energies [ΔH(L)] for conformers 1a, 1b and 1d obtained from NBO analysis (deletion of all donor–acceptor interactions) at the B3LYP-D3/aug-cc-pVDZ level are collected in Table 3.
Isolated | CH2Cl2 | Acetone | Acetonitrile | DMSO | CH3OH | H2O | ||
---|---|---|---|---|---|---|---|---|
a Obtained by adding the enthalpic corrections from ΔH(T). | ||||||||
1a | ΔH(T) | 0.00 | 0.00 | 0.00 | 0.09 | 0.14 | 0.07 | 0.23 |
ΔH(L) | 11.00 | 11.93 | 11.91 | 11.90 | 11.87 | 11.90 | 11.90 | |
ΔH(NL) | 13.57 | 12.44 | 11.99 | 11.81 | 11.73 | 11.83 | 11.67 | |
1b | ΔH(T) | 0.31 | 0.31 | 0.23 | 0.29 | 0.33 | 0.27 | 0.41 |
ΔH(L) | 2.14 | 3.43 | 3.47 | 3.48 | 3.46 | 3.48 | 3.47 | |
ΔH(NL) | 4.40 | 3.63 | 3.32 | 3.19 | 3.13 | 3.21 | 3.06 | |
1d | ΔH(T) | 2.57 | 0.51 | 0.08 | 0.00 | 0.00 | 0.00 | 0.00 |
ΔH(L) | 0.00 | 0.00 | 0.00 | 0.00 | 0.00 | 0.00 | 0.00 | |
ΔH(NL) | 0.00 | 0.00 | 0.00 | 0.00 | 0.00 | 0.00 | 0.00 |
Table 3 indicates that 1a suffers the highest steric interactions [ΔH(L) values], followed by 1b and 1d as the conformer that experiences the lowest steric interactions. Hyperconjugative stabilisation operates in the other way round [ΔH(NL) values], i.e., it is highest for 1a and lowest for 1d. Conformer 1a is the most stable for the isolated compound, and it has an approximately gauche geometry, with dihedral angles of ϕ[N–C–C(O)–N] = 68.6° and ψ[C(O)–N–C–C(O)] = 81.2°. Thus, the conformational preference in Ac-Gly-NHMe is a consequence of the well known gauche effect,37 i.e., 1a is the lowest energy conformer even though it experiences the highest steric and electrostatic destabilisation. The stability of conformer 1a is assisted by its strong IHB within a 7-membered ring, which explains its high hyperconjugative stabilisation by increasing it by 6.33 kcal mol−1 (nO(1) → σ*NH = 2.57 kcal mol−1 + nO(2) → σ*NH = 3.76; orbital representations in the ESI; Fig. S8†). The Natural Steric Analysis (NSA)38 is in qualitative agreement with the ΔH(L) energy parameter and indicates that 1a is more destabilised due to steric interactions (+250.27 kcal mol−1) than 1b (+249.66 kcal mol−1) and 1d (+245.67 kcal mol−1), whose steric energy values are not due to any particular orbital–orbital interaction, but the sum of all of them.
As shown previously, theory indicates that conformer 1d becomes the most stable in acetonitrile. Indeed, the stability of 1a is highly dependent on its N–H⋯O 7-membered IHB, while that of conformer 1d is due to its minor destabilisation by steric effects. Also, 1b could have increased population in polar solvents not only due to its higher dipole moment, but also due to its smaller dependence of IHB stabilisation than 1a and 1b.
We turn now to 1H NMR, experimental 3JHH spin–spin coupling constant (SSCC) and chemical shift values (Table 4). The 3JHaHb values are almost constant in the studied solvents. Based on the well known Karplus relationship,39 one would expect that the 3JHaHb values would be similar for 1a and 1d, with higher values than 1b, since the former conformers have both a cis and an anti relationship between Ha and Hb atoms, while 1b has only anticlinal relationships between these atoms (Fig. 6). Thus, the observation that the 3JHaHb values are almost constant in different solvents would be either because the conformer populations do not change among the applied solvents or that the populations are shifting from conformer 1a to 1d, which have similar 3JHaHb values. IEF-PCM calculations (Table 1) suggest that the second hypothesis is the correct one, i.e., the population of 1b is almost constant in the different solvents and that of 1a shifts to 1d when the solvent polarity increases.
Solvent | ε | δH(a) | δH(b) | δH(c) | δH(d) | δH(e) | 3JHaHb | 3JHcHe |
---|---|---|---|---|---|---|---|---|
CD2Cl2 | 8.9 | 6.18 | 3.83 | 5.92 | 1.99 | 2.78 | 5.34 | 4.86 |
Acetone-d6 | 20.7 | 7.34 | 3.77 | 7.15 | 1.92 | 2.69 | 5.76 | 4.74 |
CD3CN | 37.5 | 6.71 | 3.68 | 6.52 | 1.92 | 2.66 | 5.88 | 4.80 |
DMSO-d6 | 46.7 | 8.08 | 3.61 | 7.74 | 1.85 | 2.57 | 5.94 | 4.62 |
CD3OH | 32.7 | 8.25 | 3.79 | 7.90 | 2.00 | 2.73 | 5.82 | 4.74 |
H2O | 80.1 | 8.30 | 3.85 | 7.85 | 2.05 | 2.74 | 5.76 | 4.80 |
BHandH/EPR-III and SOPPA(CCSD)/EPR-III 3JHaHb SSCCs for all 1 conformers are given in the ESI (Table S5†). Both methods indicate that the 3JHaHb values for 1a and 1d are indeed similar (∼7 and ∼6 Hz, respectively) and higher than the corresponding values for 1b [∼3 Hz for BHandH and ∼2 Hz for SOPPA(CCSD), respectively]. Fig. 7a shows the calculated 3JHaHb, weighted by all populations of conformer 1. In this case, BHandH/EPR-III results are in better agreement with experiment than SOPPA(CCSD)/EPR-III. Fig. 7b uses corrected IR populations (from Fig. 3) and BHandH/EPR-III calculated 3JHaHb values. 3JHaHb values obtained from theoretical and IR-derived populations in CH2Cl2 are in reasonable accordance (4.76 Hz and 5.77 Hz) with the experimental value (5.34 Hz) and theoretical is in excellent agreement in CH3CN (theoretical = 5.87 Hz; experimental = 5.98 Hz). Thus, theory and experimental IR and 1H NMR indicates that 1a and 1b are preferred for the isolated compound and in nonpolar solvents, but 1d is the preferential one and compete with 1b in more polar solvents. If mostly one conformer is present in water, it may not be 1b, even though it has an extended geometry and presumably smaller ΔG of solvation than the remaining conformers, because the calculated 3JHaHb SSCC for 1b (BHandH = 2.7 Hz and SOPPA = 1.8 Hz; ESI Table S5†) is much smaller than the experimental (5.6 Hz). On the other hand, conformer 1d more closely matches the experimental value in water (BHandH = 7.2 Hz and SOPPA = 6.2 Hz). The competition between 1b and 1d in water is in agreement with previous molecular dynamics and QM/MM studies from the literature, which found both 1b and 1d depending on the level of calculation40 and that 1d should be the preferential if increased number of water molecules are taken into account. Indeed, by simulating 11 water molecules around Ac-Gly-NHMe, Boopathi et al.41 showed, by using molecular dynamics calculations, that conformer 1d would be the preferential one in water.
In order to get a deeper insight into the factors that govern conformer stability in the more polar solvents, we decided to “manipulate” the H-bond in both 1a and 1d by studying the CF3-C(O)-Gly-NHMe (2) derivative. The electron withdrawing CF3-group should weaken the CO⋯H–N IHB in 2a and 2d (representations in Fig. 2) in comparison to 1a and 1d, because it withdraws electron density from the H atom acceptor groups in these conformers. Also, the CF3-group may strengthen the IHB in conformer 2b in comparison to 1b, since it withdraws electron density from the H(N) atom participating in the IHB in this conformer. All ELF, NCI, DORI and NBO parameters indicate that this is indeed the case (Table 2). QTAIM again could find an IHB only for conformer 2a. All methods, except QTAIM, also indicate formation of a CF⋯HN IHB for conformers 2a–d, which is of similar strength for all of them (nF(2) → σ*NH interaction energies; Table 2).
Theory indicates that conformer 2a is not the most stable conformer. Conformer 2b is the most stable one with more than 80% of the total population of 2 (Table 5). Such relative stability decreases in more polar solvents and 2d becomes progressively more stable as the dielectric constant increases. IR populations are not in quantitative agreement with theory. Although 2b conformer is the most stable in CH2Cl2 (59.6%), conformer 2d becomes the global minimum in acetonitrile (56.3%; Fig. 8). Thus, conformer 2d, which forms the weakest IHB, is the most stable in polar solvents for both 1 and 2. Amide I bands in H2O (Fig. 8e) and D2O (Fig. 8f) are sharper for 2 than for 1 (cf. Fig. 4e and f), but show some shoulders in the amide II band. This could be taken as indication that there is more than one conformer in water, which could be both 2b and 2d.
Isolated | CH2Cl2 | Acetone | CH3CN | DMSO | CH3OH | H2O | |
---|---|---|---|---|---|---|---|
a 2d is not a minimum for the isolated molecule. | |||||||
2a | 15.8 | 8.4 | 6.8 | 6.4 | 6.2 | 6.4 | 6.0 |
2b | 81.1 | 74.5 | 72.2 | 70.7 | 70.2 | 70.9 | 69.4 |
2c | 3.03 | 9.3 | 8.3 | 8.0 | 7.9 | 8.0 | 7.8 |
2da | — | 7.6 | 12.5 | 14.8 | 15.5 | 14.5 | 16.5 |
3a | 2.1 | 2.6 | 3.0 | 3.1 | 3.2 | 3.1 | 3.3 |
3b | 97.7 | 93.6 | 91.0 | 89.6 | 89.1 | 89.8 | 88.3 |
3c | 0.2 | 3.2 | 5.0 | 5.8 | 6.1 | 5.7 | 6.6 |
3d | 0.0 | 0.3 | 0.5 | 0.6 | 0.7 | 0.6 | 0.8 |
1H NMR parameters for 2 are collected in Table 6. Unfortunately, the H(N) atom in 2 is much more acidic than in 1 and exchanges quite fast within polar protic solvents. It is thus not possible to determine 3JHaHb SSCC in methanol and water, which could have indicated if either 2b or 2d would be the preferential one, since they have different calculated 3JHaHb values (ESI Table S5†).
Another way to probe if either the b or d conformer would be the preferential one in polar protic solvents, is to look at derivatives where one of them is disfavoured by design. Conformers 1d and 2d are stabilised by an IHB involving the C-terminal NHMe group (Fig. 2). Because changing this group to NMe2 should block this interaction, we finally studied Ac-Gly-N(Me)2 (3). Theoretical calculations indicate that 3b has ∼90% of the total population in all solvents (Table 5) and that, as expected, the geometries of conformers a and d are not the same as for compounds 1 and 2 (Fig. 2). This has consequences for the chemical shifts and SSCCs (Table 7). Thus, if 3b is the preferential conformer, with ∼90% of the total population in all solvents, one would expect that the experimental 3JHaHb SSCC would decrease considerably for 3 in comparison to 1 and 2. However, as shown in Table 7, the 3JHaHb SSCCs for 3 are overall only slightly smaller than those observed in 1.
Solvent | ε | δH(a) | δH(b) | δH(c) | δH(d)(e)a | δH(d)(e)a | 3JHaHb |
---|---|---|---|---|---|---|---|
a H(d) and H(e) were not assigned. | |||||||
CD2Cl2 | 8.9 | 6.81 | 4.00 | 1.99 | 2.96 | 2.94 | 4.26 |
Acetone-d6 | 20.7 | 7.19 | 3.98 | 1.93 | 2.90 | 3.01 | 4.80 |
Acetonitrile-d3 | 37.5 | 6.75 | 3.93 | 1.92 | 2.88 | 2.93 | 5.16 |
DMSO-d6 | 46.7 | 7.91 | 3.89 | 1.86 | 2.94 | 2.82 | 5.46 |
CD3OH | 32.7 | 8.07 | 4.05 | 2.02 | 3.05 | 2.96 | 5.04 |
H2O | 80.1 | — | 4.07 | 2.05 | 3.03 | 2.93 | — |
Experimental IR spectra of compound 3 in CD2Cl2, acetonitrile and water are shown in Fig. 9. In excellent agreement with theoretical calculations, experimental IR populations indicate that conformer 3b is the most prevalent in CH2Cl2 accounting for 93.4% of the total population (Fig. 9). The N–H band is very broad in acetonitrile and conformer populations could not be taken from it. Conformers 3c and 3d have the highest calculated dipole moment values (10.31 D and 10.08 D, respectively), while 3b has a relative small calculated dipole moment (4.62 D). Differently from compounds 1 and 2, the amide I IR band of compound 3 has a shoulder in water (Fig. 3f), hence, indicating that more than one conformer is stable in this solvent. Thus, even though 3b has an extended geometry and is more prone to be solvated by water, such conformer would not be the most stable in more polar or polar protic solvents if other conformers with higher dipole moments are present. This may also be the case for compounds 1 and 2, whose conformers 1b and 2b compete with 1d and 2d, respectively, in polar solvents. However, as shown previously, d conformers have higher dipole moments than b conformers and, consequently, should be the preferential ones in polar and polar protic solvents.
Footnote |
† Electronic supplementary information (ESI) available: 1–3 compounds PES, conformer geometrical representations. QTAIM, ELF, NCI and DORI details and experimental and theoretical IR and NMR spectra. See DOI: 10.1039/c4ra16472e |
This journal is © The Royal Society of Chemistry 2015 |