Silver ion post-column derivatization electrospray ionization mass spectrometry for determination of tetrabromobisphenol A derivatives in water samples

Yong Tiana, Ai-feng Liua, Guang-bo Qua, Chun-xiao Liua, Jian Chenb, Eric Handbergb, Jian-bo Shi*a, Huan-wen Chen*b and Gui-bin Jianga
aState Key Laboratory of Environmental Chemistry and Ecotoxicology, Research Center for Eco-Environmental Sciences, Chinese Academy of Sciences, Beijing 100085, China. E-mail: jbshi@rcees.ac.cn; Fax: +86-10-62849129; Tel: +86-10-62849129
bJiangxi Key Laboratory for Mass Spectrometry and Instrumentation, College of Chemistry, Biology and Material Sciences, East China Institute of Technology, Nanchang, 330013, China. E-mail: chw8868@gmail.com; Fax: +86-791-83896370; Tel: +86-791-83879275

Received 11th December 2014 , Accepted 3rd February 2015

First published on 3rd February 2015


Abstract

A rapid and sensitive method was developed for the identification and quantitation of tetrabromobisphenol A (TBBPA) derivatives in water samples. Six major TBBPA derivatives, including tetrabromobisphenol A bis(2-hydroxyethyl) ether (TBBPA-BHEE), tetrabromobisphenol A bis(glycidyl) ether (TBBPA-BGE), tetrabromobisphenol A bis(allyl) ether (TBBPA-BAE), tetrabromobisphenol A mono(2-hydroxyethyl) ether (TBBPA-MHEE), tetrabromobisphenol A mono(glycidyl) ether (TBBPA-MGE) and tetrabromobisphenol A mono(allyl) ether (TBBPA-MAE), were selected as the target compounds. By applying the silver cation (Ag+) as the post-column derivatization reagent, the TBBPA derivatives formed complexes ([M + Ag]NO3) online, which could be effectively electrosprayed to generate ionic clusters ([M + Ag]+) for sensitive mass analysis. Under the optimized conditions, the 6 TBBPA derivatives were separated and detected within 10 min. The limits of detection (LODs) were between 0.16 and 1.96 μg L−1, and the linear ranges extended to 200 μg L−1 (R2 ≥ 0.9957). The relative standard deviations (RSDs) were less than 7.7% for 10 μg L−1 of the TBBPA derivatives (n = 7). The proposed method was successfully applied in analysis of environmental water samples. The spiked recoveries ranged from 81.3% to 114.9%, suggesting the accuracy and feasibility of the method.

1. Introduction

Tetrabromobisphenol A (TBBPA) is industrially produced and is widely used as a reactive component or additive in various flame retardant products to reduce the risk of fire.1–5 It is mostly added into epoxy resins and polymers, which are used to produce printed circuit boards, acrylonitrile–butadiene–styrene (ABS), polystyrenes, phenolic resins, adhesives, paper, and textiles.6–9 Because the global market demand of TBBPA was 170[thin space (1/6-em)]000 tons in 2004[thin space (1/6-em)]10–12 and it accounted for about 60% of all brominated flame retardant (BFR) products,3,13 TBBPA is recognized as the most produced and consumed of the BFRs.14 TBBPA is also a possible substitute for polybrominated diphenyl ethers (PBDEs);15,16 as a result, the production and consumption of TBBPA have increased since 2004. Meanwhile, the main products of TBBPA derivatives, such as tetrabromobisphenol A bis(2-hydroxyethyl) ether (TBBPA-BHEE), tetrabromobisphenol A bis(glycidyl) ether (TBBPA-BGE) and tetrabromobisphenol A bis(allyl) ether (TBBPA-BAE), are largely produced and used in polystyrene foams (expandable polystyrene-EPS), engineering polymers (polybutylene terephthalate and polycarbonate), epoxy resins, thermoplastic polyesters, polyurethane, laminates, and polyester fibers.1,7,11 The production of TBBPA derivatives accounts for more than 25% of all TBBPA production.17 Because these derivatives could be used as modified BFRs, the production level and the market demand have continually increased in recent years.7 During the production, application, and degradation of the derivatives, byproducts of the TBBPA derivatives are also inevitably generated,18 such as, tetrabromobisphenol A mono(2-hydroxyethyl) ether (TBBPA-MHEE), tetrabromobisphenol A mono(glycidyl) ether (TBBPA-MGE) and tetrabromobisphenol A mono(allyl) ether (TBBPA-MAE). Recently, TBBPA derivatives, including both main TBBPA derivatives and byproducts, have been identified in environment samples.13,18–22 Therefore, as a large volume of these potentially-hazardous chemicals is produced, the environmental behavior and health effects of TBBPA and its derivatives should be monitored carefully.23

The safety of TBBPA derivatives and TBBPA decomposition products is constantly disputed. Although research from the Brominated Science and Environmental Forum (BSEF) and the European Brominated Flame Retardant Industry Panel (EBFRIP) asserted that TBBPA poses no risk to human health,6,24,25 the endocrine effect and the immunotoxicity of TBBPA are continual concerns of toxicologists.5,26–30 More importantly, one of the derivatives (TBBPA-BAE) has been found to be a neurotoxin in the environment.20 Throughout pyrolysis, combustion and degradation of TBBPA and its derivatives, the decomposition products might also lead to a health and environmental risk.3,19,31–33 Therefore, TBBPA and its derivatives should be investigated carefully to avoid causing serious damage to human health.34–37

However, the analytical methods for TBBPA derivatives are very limited until recently.11 A high performance liquid chromatography (HPLC) hyphenated ultra violet (UV) detector is a feasible way for TBBPA derivatives detection, but preconcentration (e.g., liquid–liquid microextraction or solid-phase microextraction) is often needed to improve the sensitivity for analysis of water samples.21,22,38 Hyphenated HPLC with mass spectrometry (MS) employed different ionization sources, such as electrospray ionization (ESI),18,39 atmospheric pressure chemical ionization (APCI)20 and atmospheric pressure photoionization (APPI),13 could determine only certain types of TBBPA derivatives. For example, ESI was able to ionize only the byproducts of TBBPA derivatives, but failed to ionize the main products because of their low proton affinities. Likewise, APCI and APPI were either difficult to get the molecular ions or need an appropriate dopant for ionization of TBBPA-BAE. Moreover, standards for TBBPA byproduct derivatives, such as TBBPA-MHEE, TBBPA-MGE and TBBPA-MAE, are not commercially available. There is no approved analytical method for both main and by-products of TBBPA derivatives. Hence, developing a practical and sensitive analytical method for TBBPA derivatives is imperative.7,11,40

In our previous study, Ag+ has been found to react with the main TBBPA derivatives by extractive electrospray ionization (EESI).41 The TBBPA derivatives were ionized by forming [TBBPA derivative + Ag]+ ions and analyzed by MS. It effectively simplified the ionization requirements for the main TBBPA derivatives. But the reactive EESI system has not been widely used yet, which limits its application for routine analysis. With further investigation, TBBPA derivatives, including its main derivatives and the byproducts, were found to form the complexes of [TBBPA derivative + Ag]NO3 rapidly in liquid phase, and these complexes could be effectively electrosprayed to generate [TBBPA derivative + Ag]+ for sensitive mass analysis of TBBPA derivatives. Therefore, sensitive electrospray ionization of TBBPA derivatives could be achieved by this mechanism. With the combination of HPLC for TBBPA derivatives separation and employing Ag+ for post-column derivatization, 6 TBBPA derivatives are sensitively detected by ESI-MS. The practicality and reliability for TBBPA derivatives identification and quantitation are highly improved; the present method offers an alternative analytical strategy for advance studies of TBBPA derivatives.

2. Experimental

2.1. Instrumentation

A high performance liquid chromatography (HPLC, Thermo Electron Corporation, USA) system with a C18 Hypersil GOLD column (100 mm × 2.1 mm, 1.9 μm, Thermo Scientific, USA) was used to separate the TBBPA derivatives. A holder (Universal UNIGUARD, Thermo Scientific) installed with a guard cartridge (Drop-in, Hypersil GOLD, Thermo Scientific, USA) was used as a guard column assembly to protect the C18 column. Another LC pump (P310, Skyray instrument Co., Ltd, China) was employed for pumping silver solution to react with TBBPA derivatives via a three-way tee connector (PEEK, Bore: 0.25 mm, Valco Instruments Co. Inc., USA) for post-column derivatization. A linear trap quadruple mass spectrometer (LTQ-XL, Thermo Scientific, USA) equipped with electrospray ionization source was used to detect the complexes of [TBBPA derivatives + Ag]+ after the post-column derivatization. The connections between HPLC separation, post-column derivatization and MS were assembled by PEEK tubing (i.d. = 0.005 in) and PEEK fittings (Valco Instruments Co. Inc., USA). A 20 cm (in length) PEEK tube was used to deliver the [TBBPA derivative + Ag]NO3 solution from the three-way tee connector to ESI source. The HPLC Ag+ post-column derivatization and ESI-MS/MS system for TBBPA derivatives detection was assembled as shown in Fig. 1. The details of instrument conditions were summarized in Table 1.
image file: c4ra16166a-f1.tif
Fig. 1 Schematic diagram of HPLC Ag+ post-column derivatization and ESI-MS/MS system for TBBPA derivatives detection.
Table 1 The experimental conditions for TBBPA derivatives detection by HPLC post column derivatization and LTQ-MS
HPLC conditions Column C18, Hypersil GOLD column, 100 mm × 2.1 mm
Column oven temp. 25 °C
Mobile phase Methanol–H2O (9/1, v/v) 0.15 mL min−1
Sample volume 10 μL
Post-column derivatization Ag+ methanol solution 10 mg L−1, 0.05 mL min−1
ESI conditions Sheath gas flow rate 20 arb
Aux gas flow rate 10 arb
Sweep gas flow rate 10 arb
Spray voltage +4 kV
Capillary temp. 250 °C

MS detector MRM conditions Time (min) Precursor ions (m/z) Normalized collision energy (%)
  0–2.70 739 28
695 32
2.70–3.00 695 32
707 30
3.00–3.35 707 30
763 20
3.35–3.79 763 20
691 32
3.79–7.10 691 32
7.10–10.00 731 30


2.2. Reagents and materials

All chemicals used were at least of analytical reagent grade. De-ionized water and methanol (HPLC grade, Fisher Scientific, USA) were used for standards and samples dilution. TBBPA-BAE (CAS 25327-89-3, 99%), TBBPA-BHEE (CAS 4162-45-2, 98%) and TBBPA-BGE (CAS 3072-84-2, purity unknown) were purchased from Sigma-Aldrich and purified with silica gel column chromatography before use. TBBPA-MAE, TBBPA-MHEE, TBBPA-MGE were synthesized following previous studies.18,39

2.3. Samples and pretreatment

Two river water samples were collected in Shandong (SDRW) and Jiangxi (JXRW) Province, respectively. TBBPA industry waste water (IWW) effluent was collected near a TBBPA plant in Shandong Province. Two lake water samples (ECITLW, NCLW) were collected from the lake of East China Institute of Technology (ECIT) campus and downtown of Nanchang, respectively. Tap water of ECIT (ECITTW) was also collected and tested in this study. All the water samples were filtrated through 0.22 μm mixed cellulose–ester membrane. The filtrates were analyzed directly by the present method without any further purification.

3. Results and discussion

3.1. The ESI-MS spectra of Ag+–TBBPA derivatives ([M + Ag]+)

Under experimental conditions listed in Table 1, the full scan (m/z 500–1000) MS spectra of [M + Ag]+ formed by TBBPA-MHEE, TBBPA-BHEE, TBBPA-MGE, TBBPA-BGE, TBBPA-MAE and TBBPA-BAE binding with Ag+ were recorded as shown in Fig. 2a–f, respectively. These MS spectra demonstrated the dominant characteristic isotope peaks of the corresponding silver-bound TBBPA derivatives. Because the abundance of the stable isotopes of both bromine and silver are almost equal (i.e., 79Br (50.7%) and 81Br (49.3%), 107Ag (51.8%) and 109Ag (48.2%)) the isotopic distribution patterns of [M + Ag]+ in the MS spectra should contain 6 isotope peaks and the proportions of abundance must be close to 1[thin space (1/6-em)]:[thin space (1/6-em)]5[thin space (1/6-em)]:[thin space (1/6-em)]10[thin space (1/6-em)]:[thin space (1/6-em)]10[thin space (1/6-em)]:[thin space (1/6-em)]5[thin space (1/6-em)]:[thin space (1/6-em)]1, as [M + Ag]+ contains 4 bromines and one Ag+.20,41 For example, the isotope peaks of TBBPA-MHEE bound Ag+ ([TBBPA-MHEE + Ag]+) dominated in the mass range from m/z 691 to 701 in Fig. 2a. The m/z ratios of the highest intensities for the isotope peak pairs (m/z 695 and 697) were equal to the most abundant molecular weight of TBBPA-MHEE (MW: 588) plus the silver ions' atomic weight (MW: 107 or 109). The six peaks and the intensity proportions of the isotope peaks at m/z 691, 693, 695, 697, 699 and 701 were highly correlated with the theoretical values. The MS spectrum of [TBBPA-MHEE + Ag]+ precisely proved TBBPA-MHEE could be ionized and could be determined by Ag+ post-column derivatization and ESI-MS method. The MS spectra of TBBPA-BHEE, TBBPA-MGE, TBBPA-BGE, TBBPA-MAE and TBBPA-BAE (Fig. 2b–f), were similar to the mass spectrum of TBBPA-MHEE. The m/z value, the peak number and the relative intensities of the isotope peaks all matched the theoretic values completely.
image file: c4ra16166a-f2.tif
Fig. 2 The ESI-MS spectra of Ag+–TBBPA derivatives ([M + Ag]+). (a) to (f) are the MS spectra of [M + Ag]+ for TBBPA-MHEE, TBBPA-BHEE, TBBPA-MGE, TBBPA-BGE, TBBPA-MAE and TBBPA-BAE, respectively. MW, most abundant molecular weight. 1 mg L−1 solutions of TBBPA derivatives were used and other experimental conditions were as shown in Table 1.

Because silver ions are combined with ether oxygen and bromine of the TBBPA derivatives41 and the symmetrical molecules (i.e., TBBPA-BHEE, TBBPA-BGE and TBBPA-BAE) contain two similar binding sites for silver ions, one molecule of the symmetrical molecule combined with two Ag+ were possible. However, because [M + 2Ag]2+ was less stable than [M + AgNO3 + Ag]+, the isotopic peaks around m/z 910, 934 and 902 were detected in Fig. 2b, d and f, respectively. Additionally, isotopic mass peaks of [TBBPA-BGE + CH3OH + Ag]+ were also detected in Fig. 2d nearby m/z 795 and 797. These MS spectra of TBBPA-BHEE, TBBPA-BGE and TBBPA-BAE were the same as the previous results achieved by silver ion reactive extractive electrospray ionization (EESI) mass spectrometry.41 Therefore, the Ag+ post-column derivatization and ESI-MS method was feasible for ionization and determination the TBBPA derivatives.

3.2. The MS/MS spectra of Ag+–TBBPA derivatives ([M + Ag]+)

Because the false-positive signals are unavoidable in the mass spectra, the MS/MS of [M + Ag]+ was necessary to eliminate this possibility and to ensure the accuracy of quantification and identification of these derivatives. Hence, the MS/MS spectra of TBBPA derivatives bound Ag+ were investigated by performing the collision-induced dissociation (CID) experiments on the precursor ions of m/z 695, 739, 707, 763, 691 and 731, respectively. The specific major ionic fragments produced by the precursor ions [M + Ag]+ are summerized in Fig. 3a–f.
image file: c4ra16166a-f3.tif
Fig. 3 The ESI-MS/MS spectra of Ag+–TBBPA derivatives ([M + Ag]+). (a) to (f) are the MS/MS spectra of [M + Ag]+ for TBBPA-MHEE, TBBPA-BHEE, TBBPA-MGE, TBBPA-BGE, TBBPA-MAE and TBBPA-BAE, respectively. 1 mg L−1 solutions of TBBPA derivatives were used and other experimental conditions were as shown in Table 1.

The MS/MS spectra of [TBBPA-MHEE + Ag]+, [TBBPA-MGE + Ag]+ and [TBBPA-MAE + Ag]+ were investigated for the first time to our knowledge. As illustrated in Fig. 3a, by applying 32% of the normalized collision energy to [TBBPA-MHEE + Ag]+, the major fragments of m/z 667, 651, 650, 615 and 613 were produced from the precursor ions (m/z 695) loss of C2H4 (28 Da), CH2[double bond, length as m-dash]CH–OH (44 Da), ˙CH2–CH2–OH (45 Da), H79Br (80 Da) and H81Br (82 Da), respectively. As performed CID experiment to the precursor ions of [TBBPA-MGE + Ag]+ with 30% normalized collision energy, the precursor ions of m/z 707 lose CH2O (30 Da), [C2H2, CH2O] (56 Da) and ˙CH2–CHCH2O (57 Da) species to generate fragment ions of m/z 677, 651 and 650 in the MS/MS spectrum (Fig. 3c). By neutral loss of H79Br and H81Br from the [TBBPA-MAE + Ag]+ (m/z 691) during CID process with 32% collision energy dominated the mass spectrum with fragment ions of m/z 611 and 609 (Fig. 3e). The tandem MS/MS spectra of [TBBPA-BHEE + Ag]+, [TBBPA-BGE + Ag]+ and [TBBPA-BAE + Ag]+ were identical with the analytical results generated by the Ag+ reactive EESI-MS method.41 By applying 28%, 20% and 30% of the normalized collision energy to the precursor ions of m/z 739, 763 and 731, the MS/MS spectra were generated and summarized in Fig. 3b, d and 3f. Briefly, precursor ions of [TBBPA-BHEE + Ag]+ (m/z 739) produced major fragment ions of m/z 695, 694, 659, 657 and 577 by loss of CH2[double bond, length as m-dash]CH–OH (44 Da), ˙CH2–CH2–OH (45 Da), H79Br (80 Da), H81Br (82 Da), and [H79Br, H81Br] (162 Da). Precursor ions of [TBBPA-BGE + Ag]+ (m/z 763) produced major fragment ions of m/z 733, 706 and 703 by loss of CH2O (30 Da), [CH2O, ˙C2H3] (57 Da) and 2CH2O (60 Da). Precursor ions of [TBBPA-BAE + Ag]+ (m/z 731) ion produced major fragment ions of m/z 690, 674, 651, 649 and 569 by loss of ˙CH2CHCH2 (41 Da), ˙OCH2CHCH2 (57 Da), H79Br (80 Da), H81Br (82 Da) and [H79Br, H81Br] (162 Da), respectively. These fragmentation pathways for all of the [TBBPA derivatives + Ag]+ ions were similar to the CID results of TBBPA and its derivatives in previous studies,41–44 and these MS/MS spectra also match the molecular structure of the precursor ions [M + Ag]+. This result proves the present method is an effective and convenient strategy to determine the TBBPA derivatives.

3.3. HPLC – Ag+ post-column derivatization and ESI-MS/MS for TBBPA derivatives determination

The TBBPA derivatives could be chromatographically separated by a C18 column with methanol and H2O (9/1, v/v) as the mobile phase.18,20–22 After HPLC separation, the derivatives were reacted with 10 mg L−1 of Ag+ sequentially to form complexes of Ag+ and TBBPA derivatives. Then, the complexes were electrosprayed and detected by ESI-MS. Both the concentration and flow rate of Ag+ methanol solution influenced the MS intensities and chromatographic resolution of these derivatives. A high concentration of Ag+ methanol solution was beneficial to increase the mass spectral intensity and chromatographic resolution, but induced a high vapor load on the vacuum system of the mass spectrometer, which is harmful to the vacuum pump and electron multiplier. Referring to previous conditions,41 a compromise concentration (10 mg L−1) of Ag+ was employed for post-column derivatization in this work. Moreover, the flow rate was optimized from 0.01 to 0.20 mL min−1. The results showed that low flow rates (i.e., <0.05 mL min−1) were insufficient for post-column derivatization (such as TBBPA-BGE and TBBPA-BHEE), and high flow rates (i.e., >0.05 mL min−1) decreased the MS intensities for diluting the [M + Ag]NO3 by excessive Ag+ solution during their delivering (e.g., TBBPA-BAE). The other experimental parameters influencing chromatographic resolution and detection sensitivity for TBBPA derivatives analysis were carefully investigated in this study. These optimized conditions were summarized in Table 1.

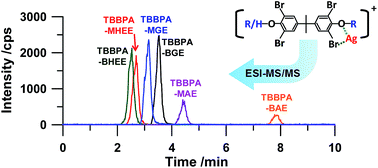
Under these experimental conditions (Table 1), the quantitative detection of the 6 TBBPA derivatives was accomplished by the present method. By using the selected characteristic fragments of m/z 694, 615, 677, 733, 611 and 651 for TBBPA-BHEE, TBBPA-MHEE, TBBPA-MGE, TBBPA-BGE, TBBPA-MAE and TBBPA-BAE, respectively, the chromatogram of each TBBPA derivative was recorded as shown in Fig. 4a to Fig. 4f. By using chromatographic separation, Ag+ post-column derivatization and multiple reactions monitoring (MRM) MS/MS detection, the 6 TBBPA derivatives were successfully detected. The figures of merit and calibration curves are summarized in Table 2 and Fig. 5. With a 10 μL sample injection, the present system detected 6 TBBPA derivatives within 10 min. The retention times for TBBPA-BHEE, TBBPA-MHEE, TBBPA-MGE, TBBPA-BGE, TBBPA-MAE and TBBPA-BAE were around 2.5, 2.7, 3.1, 3.5, 4.3 and 7.9 min, respectively. The limits of detections for TBBPA-BHEE, TBBPA-MHEE, TBBPA-MGE, TBBPA-BGE, TBBPA-MAE and TBBPA-BAE were determined to be 0.49, 0.33, 0.60, 0.16, 0.55 and 1.96 μg L−1 (S/N = 3, n = 7). As the sample volume was only 10 μL, the instrument detection limits (IDL) were equal to 1.6–19.6 pg. The LOD of the present method was sufficient for trace levels (μg L−1) of TBBPA derivatives, and the IDL of the present method was near the HPLC-APPI-MS (IDL = 12 pg) method,13 which was much better than HPLC-APCI-MS (IDL = 40 pg) method for TBBPA-BAE detection.20 The linear ranges were extended to 500 μg L−1 and coefficients of determination (R2) were larger than 0.9957. The relative standard deviations (RSD) of the signal intensity for seven successive determinations of 10 μg L−1 of TBBPA derivatives were less than 7.7% for all these TBBPA derivatives. By the reason of HPLC was used for separation of TBBPA derivatives and the co-eluted ions, the present method was more feasible than reactive Ag+ EESI-MS for accurate quantification of TBBPA derivatives.


image file: c4ra16166a-f4.tif
Fig. 4 The chromatograms of the TBBPA derivatives detected by Ag+ post-column derivatization and ESI-MS/MS. (a) to (f) are the chromatograms of characteristic fragments of [M + Ag]+ for TBBPA-BHEE, TBBPA-MHEE, TBBPA-MGE, TBBPA-BGE, TBBPA-MAE and TBBPA-BAE, respectively. 100 μg L−1 solutions of TBBPA derivatives were used and other experimental conditions were as shown in Table 1.
Table 2 The performance for TBBPA derivatives detected by HPLC Ag+ post-column derivatization and ESI-MS/MS
TBBPA derivatives Precursor ions (m/z) Product ions for quantification (m/z) Retention time (min) R2 LODsa (μg L−1) RSDsb (%)
a S/N = 3, n = 7.b RSDs: relative standard deviations, c = 10 μg L−1, n = 7.
TBBPA-BHEE 739 694 2.5 0.9981 0.49 4.6
TBBPA-MHEE 695 615 2.7 0.9978 0.33 5.1
TBBPA-MGE 707 677 3.1 0.9957 0.60 2.9
TBBPA-BGE 763 733 3.5 0.9998 0.16 3.7
TBBPA-MAE 691 611 4.3 0.9992 0.55 7.7
TBBPA-BAE 731 651 7.9 0.9965 1.96 5.2


image file: c4ra16166a-f5.tif
Fig. 5 The calibration curves for TBBPA derivatives detected by HPLC Ag+ post-column derivatization and ESI-MS/MS. (a) to (f) are the calibration curves for TBBPA-BHEE, TBBPA-MHEE, TBBPA-MGE, TBBPA-BGE, TBBPA-MAE and TBBPA-BAE, respectively. The experimental conditions were as shown in Table 1.

3.4. Detection of TBBPA derivatives in the water samples

TBBPA derivatives in the environmental water samples, including lake waters, river waters, TBBPA industrial waste water and tap water, were analyzed by the present method. The results (Table 3) indicate that the TBBPA derivatives are at a low concentration level in the environmental waters and are less concentrated than the TBBPA pollution sources. In the tap water and NCRW, the concentrations of all TBBPA derivatives are below the LODs of this method. For other environmental water samples, only trace levels of TBBPA-BGE are detected, i.e., 0.36 ± 0.40, 0.72 ± 0.50 and 0.71 ± 0.30 μg L−1 in NCLW, ECITLW and SDRW, respectively. These concentrations may be caused by the TBBPA-BGE releasing from the plastic materials in contact with these waters. Other TBBPA derivatives are not detected in these samples. The TBBPA-BAE, TBBPA-MAE and TBBPA-BGE concentrations were 18.90 ± 1.58, 1.41 ± 0.18 and 0.81 ± 0.40 μg L−1 in the TBBPA industry waste water. A reason for these TBBPA-BAE and TBBPA-MAE concentrations could be the product and by-product of the TBBPA factory. In the waste water of this factory, the concentration of TBBPA-BAE and TBBPA-MAE are much higher than other environmental water samples. 10 μg L−1 of each TBBPA derivatives was added into JXRW, SDRW, IWW and TW for spiking recovery experiments, and satisfactory spiking recoveries ranged from 81.3% to 114.9% were achieved (Table 3). These results further confirm the HPLC Ag+ post-column derivatization and ESI-MS/MS method is appropriate for TBBPA derivatives detection.
Table 3 The concentrations and spiking recoveries of TBBPA derivatives analyzed in environmental waters
Water samples TBBPA-MHEE TBBPA-BHEE TBBPA-MGE TBBPA-BGE TBBPA-MAE TBBPA-BAE
a Not detected.b Average ± standard division (n = 3).c 10 μg L−1 of TBBPA derivatives was spiked.
NCLW/μg L−1 n.d.a n.d. n.d. 0.36 ± 0.40b n.d. n.d.
ECITLW/μg L−1 n.d. n.d. n.d. 0.72 ± 0.50 n.d. n.d.
JXRW/μg L−1 n.d. n.d. n.d. n.d. n.d. n.d.
Recoveryc/% 111.0 93.2 107.7 97.4 113.0 109.5
SDRW/μg L−1 n.d. n.d. n.d. 0.71 ± 0.30 n.d. n.d.
Recovery/% 102.4 93.5 92.6 81.3 86.9 86.1
IWW/μg L−1 n.d. n.d. n.d. 0.81 ± 0.40 1.41 ± 0.18 18.90 ± 1.58
Recovery/% 100.9 94.1 95.7 94.9 93.2 97.3
ECITTW/μg L−1 n.d. n.d. n.d. n.d. n.d. n.d.
Recovery/% 101.9 100.0 105.0 109.8 101.6 114.9


4. Conclusion

The Ag+ derivatization method highly improves the sensitivity of ESI-MS for detection of TBBPA-BHEE, TBBPA-BGE and TBBPA-BAE. It enables the ESI to ionize both the main products (TBBPA-BHEE, TBBPA-BGE and TBBPA-BAE) and the by-products (TBBPA-MHEE, TBBPA-MGE and TBBPA-MAE) of TBBPA simultaneously in the positive detection mode. With combination of HPLC, the TBBPA derivatives can be chromatographically separated and ionized by ESI-MS in less than 10 min. The accuracy and the reliability of the present method are highly improved by employing HPLC, and the matrix effect is lower than with the Ag+ reactive EESI-MS method.41 Moreover, this method may be amenable to complex samples (e.g., soil, biological samples) by employing appropriate sample purification method and using a large-capacity HPLC column.

Acknowledgements

This work was supported by the National Natural Science Foundation of China (no. 21377155 and 21225522), the Strategic Priority Research Program of the Chinese Academy of Sciences (no. XDB14010400) and China Postdoctoral Science Foundation (no. 2013M530748 and 2014T70129). We Thank Mr Tenggao Zhu for HPLC-ESI-MS instrument assistance.

References

  1. World Health Organization (WHO), International Programme on Chemical Safety, Environmental health criteria 172, Tetrabromobisphenol and derivatives, Geneva, 1995 Search PubMed .
  2. European Food Safety Authority, EFSA Panel on Contaminants in the Food Chain (CONTAM); Scientific Opinion on Tetrabromobisphenol A (TBBPA) and its derivatives in food, EFSA J., 2011, 9(12), 2477 Search PubMed .
  3. N. Ortuno, J. Molto, J. A. Conesa and R. Font, Environ. Pollut., 2014, 191, 31–37 CrossRef CAS PubMed .
  4. W. A. Stubbings and S. Harrad, Environ. Int., 2014, 71, 164–175 CrossRef CAS PubMed .
  5. K. Vorkamp and F. F. Riget, Chemosphere, 2014, 111, 379–395 CrossRef CAS PubMed .
  6. Brominated Science and Environmental Forum (BSEF), TBBPA Fact Sheet, Brominated Flame Retardant, October 2013, www.bsef.com/uploads/Documents/documents/BSEf%20factsheet%20TBBPA_web.pdf.
  7. A. Covaci, S. Harrad, M. A. E. Abdallah, N. Ali, R. J. Law, D. Herzke and C. A. de Wit, Environ. Int., 2011, 37, 532–556 CrossRef CAS PubMed .
  8. K. K. Kefeni, J. O. Okonkwo, O. I. Olukunle and B. M. Botha, Environ. Rev., 2011, 19, 238–253 CrossRef CAS PubMed .
  9. I. Watanabe and S. Sakai, Environ. Int., 2003, 29, 665–682 CrossRef CAS .
  10. M. A.-E. Abdallah, S. Harrad and A. Covaci, Environ. Sci. Technol., 2008, 42, 6855–6861 CrossRef CAS .
  11. A. Covaci, S. Voorspoels, M. A.-E. Abdallah, T. Geens, S. Harrad and R. J. Law, J. Chromatogr. A, 2009, 1216, 346–363 CrossRef CAS PubMed .
  12. V. Steukers and L. Tange, Brominated Science and Environmental Forum (BSEF), EIPC Winter Conference 2006 “Tetrabromobisphenol A, how to meet the environmental requirements”, http://www.bsef.com/media-room/2006-2.
  13. R. J. Letcher and S. Chu, Environ. Sci. Technol., 2010, 44, 8615–8621 CrossRef CAS PubMed .
  14. L. S. Birnbaum and D. F. Staskal, Environ. Health Perspect., 2004, 112, 9–17 CrossRef CAS .
  15. C. A. de Wit, D. Herzke and K. Vorkamp, Sci. Total Environ., 2010, 408, 2885–2918 CrossRef CAS PubMed .
  16. X. Luo, S. Chen, B. Mai and J. Fu, Sci. China: Chem., 2010, 53, 961–973 CrossRef CAS PubMed .
  17. A. Bergman, A. Ryden, R. J. Law, J. de Boer, A. Covaci, M. Alaee, L. Birnbaum, M. Petreas, M. Rose, S. Sakai, N. Van den Eede and I. van der Veen, Environ. Int., 2012, 49, 57–82 CrossRef CAS PubMed .
  18. G. Qu, A. Liu, W. Thanh, C. Zhang, J. Fu, M. Yu, J. Sun, N. Zhu, Z. Li, G. Wei, Y. Du, J. Shi, S. Liu and G. Jiang, Environ. Sci. Technol., 2013, 47, 4760–4767 CrossRef CAS PubMed .
  19. F. Li, J. Wang, P. Nastold, B. Jiang, F. Sun, A. Zenker, B. A. Kolvenbach, R. Ji and P. F.-X. Corvini, Environ. Pollut., 2014, 193, 181–188 CrossRef CAS PubMed .
  20. G. Qu, J. Shi, T. Wang, J. Fu, Z. Li, P. Wang, T. Ruan and G. Jiang, Environ. Sci. Technol., 2011, 45, 5009–5016 CrossRef CAS PubMed .
  21. X. Wang, J. Liu, A. Liu, Q. Liu, X. Du and G. Jiang, Anal. Chim. Acta, 2012, 753, 1–7 CrossRef CAS PubMed .
  22. X. Wang, J. Liu, Q. Liu, X. Du and G. Jiang, Talanta, 2013, 116, 906–911 CrossRef CAS PubMed .
  23. S. L. Waaijers, D. Kong, H. S. Hendriks, C. A. de Wit, I. T. Cousins, R. H. S. Westerink, P. E. G. Leonards, M. H. S. Kraak, W. Admiraal, P. de Voogt and J. R. Parsons, in Reviews of Environmental Contamination and Toxicology, ed. D. M. Whitacre, 2013, vol. 222, pp. 1–71 Search PubMed .
  24. Brominated Science and Environmental Forum (BSEF), TBBPA Risk Assessment, http://www.bsef.com/science/scientific-studies-4/tbbpa-2.
  25. W. Dekant, Risk assessment of TBBPA, Updating the EU-Risk Assessment Reports, http://www.ebfrip.org, 2010.
  26. T. Debenest, F. Gagne, A. N. Petit, C. Andre, M. Kohli and C. Blaise, Comp. Biochem. Physiol., Part C: Toxicol. Pharmacol., 2010, 152, 407–412 CrossRef CAS PubMed .
  27. T. Hamers, J. H. Kamstra, E. Sonneveld, A. J. Murk, M. H. A. Kester, P. L. Andersson, J. Legler and A. Brouwer, Toxicol. Sci., 2006, 92, 157–173 CrossRef CAS PubMed .
  28. R. V. Kuiper, R. F. Canton, P. E. G. Leonards, B. M. Jenssen, M. Dubbeldam, P. W. Wester, M. van den Berg, J. G. Vos and A. D. Vethaak, Ecotoxicol. Environ. Saf., 2007, 67, 349–360 CrossRef CAS PubMed .
  29. J. Legler, Chemosphere, 2008, 73, 216–222 CrossRef CAS PubMed .
  30. L. T. M. Van der Ven, T. V. de Kuil, A. Verhoef, C. M. Verwer, H. Lilienthal, P. E. G. Leonards, U. M. D. Schauer, R. F. Canton, S. Litens, F. H. De Jong, T. J. Visser, W. Dekant, N. Stern, H. Hakansson, W. Slob, M. Van den Berg, J. G. Vos and A. H. Piersma, Toxicology, 2008, 245, 76–89 CrossRef CAS PubMed .
  31. M. Altarawneh and B. Z. Dlugogorski, J. Phys. Chem. A, 2014, 118, 9338–9346 CrossRef CAS PubMed .
  32. Y. Guo, J. Zhou, X. Lou, R. Liu, D. Xiao, C. Fang, Z. Wang and J. Liu, Chem. Eng. J., 2014, 254, 538–544 CrossRef CAS PubMed .
  33. F.-Q. Peng, G.-G. Ying, B. Yang, Y.-S. Liu, H.-J. Lai, G.-J. Zhou, J. Chen and J.-L. Zhao, Environ. Toxicol. Chem., 2014, 33, 1705–1711 CrossRef CAS PubMed .
  34. C. A. de Wit, Chemosphere, 2002, 46, 583–624 CrossRef CAS .
  35. S. Germer, A. H. Piersma, L. van der Ven, A. Kamyschnikow, Y. Fery, H. J. Schmitz and D. Schrenk, Toxicology, 2006, 218, 229–236 CrossRef CAS PubMed .
  36. A. Sjodin, D. G. Patterson and A. Bergman, Environ. Int., 2003, 29, 829–839 CrossRef CAS .
  37. W. Zhang, L. Chen, S. An, K. Liu, K. Lin and L. Zhao, Environ. Toxicol. Pharmacol., 2014, 38, 586–594 CrossRef CAS PubMed .
  38. S. Jonsson and M. Horsing, J. Phys. Org. Chem., 2009, 22, 1120–1126 CrossRef CAS .
  39. A. Liu, G. Qu, C. Zhang, Y. Gao, J. Shi, Y. Du and G. Jiang, J. Chromatogr. A, 2015, 1377, 92–99 CrossRef CAS PubMed .
  40. A. Covaci, S. Voorspoels, L. Ramos, H. Neels and R. Blust, J. Chromatogr. A, 2007, 1153, 145–171 CrossRef CAS PubMed .
  41. Y. Tian, J. Chen, Y.-z. Ouyang, G.-b. Qu, A.-f. Liu, X.-m. Wang, C.-x. Liu, J.-b. Shi, H.-w. Chen and G.-b. Jiang, Anal. Chim. Acta, 2014, 814, 49–54 CrossRef CAS PubMed .
  42. H. Gallart-Ayala, E. Moyano and M. T. Galceran, Rapid Commun. Mass Spectrom., 2007, 21e, 4039–4048 CrossRef PubMed .
  43. R. Saint-Louis and E. Pelletier, Analyst, 2004, 129, 724–730 RSC .
  44. U. M. Schauer, W. Völkel and W. Dekant, Toxicol. Sci., 2006, 91, 49–58 CrossRef CAS PubMed .

This journal is © The Royal Society of Chemistry 2015
Click here to see how this site uses Cookies. View our privacy policy here.