Spectroscopic characterization of C-4 substituted 3,5-dichloro-4H-1,2,6-thiadiazines

Eleni Theodorou, Heraklidia A. Ioannidou, Theodosia A. Ioannou, Andreas S. Kalogirou, Christos P. Constantinides, Maria Manoli, Panayiotis A. Koutentis* and Sophia C. Hayes*
Department of Chemistry, University of Cyprus, P.O. Box 20537, 1678, Nicosia, Cyprus. E-mail: koutenti@ucy.ac.cy; shayes@ucy.ac.cy

Received 10th December 2014 , Accepted 2nd February 2015

First published on 2nd February 2015


Abstract

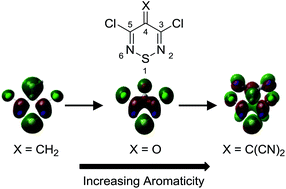
Three 3,5-dichloro-4H-1,2,6-thiadiazines, which differ according to the electron withdrawing nature of their substituent at C-4: (a) 3,5-dichloro-4-methylene-4H-1,2,6-thiadiazine (5a), (b) 3,5-dichloro-4H-1,2,6-thiadiazin-4-one (5b) and (c) 2-(3,5-dichloro-4H-1,2,6-thiadiazin-4-ylidene)malononitrile (5c), are characterized using resonance Raman (RR), absorption (UV/vis) and photoluminescence (PL) spectroscopies. These weakly aromatic and electron-deficient heterocycles are potential components as acceptors in donor–acceptor systems for organic electronics. Experimental results, which include the synthesis, characterization and single crystal X-ray structure of 3,5-dichloro-4-methylene-4H-1,2,6-thiadiazine (5a), combined with theoretical calculations of their orbitals and vibrational frequencies, provide an understanding of the optical properties, on the basis of molecular geometry and electron distribution.

1. Introduction

Heteroaromatic compounds have many uses in diverse fields such as the pharmaceutical, agrochemical and materials sectors.1 π-Conjugated small molecules, oligomers and polymers, that are composed of heteroaromatic compounds e.g., pyrroles, carbazoles and thiophenes, have been successfully used in organic electronic devices.2 The recent successes and the demand for more efficient optoelectronic devices have led to an intense search for new materials with improved physicochemical and electronic properties.

Within the field of heterocyclic chemistry there are a number of potentially useful scaffolds that have yet to be exploited and have essentially remained dormant since they were first reported. One such scaffold is 3,5-dichloro-4H-1,2,6-thiadiazin-4-one, which was first reported in 1974.3 For over twenty years the chemistry of this scaffold has been limited to the substitution of a chlorine, and the monochloro-monosubstituted thiadiazines have been studied as antifungal agents.4 Nevertheless, a recent perspective on R. B. Woodward's “unfinished symphony” identified poly(1,2,6-thiadiazines) as potential stable alternatives to the superconductor poly(sulfur nitride) (SN)x.5 A similar proposal was later put forward by C. W. Rees (Fig. 1).6–8


image file: c4ra16144k-f1.tif
Fig. 1 1,2,6-Thiadiazinone polymers proposed as alternatives to poly(sulfur nitride) (SN)x by Woodward (top) and Rees (bottom).

In addition, several fused 4H-1,2,6-thiadiazines such as acenaphtho[5,6-cd][1,2,6]thiadiazine (1),9,10 and naphtho[1,8-cd:4,5-cd′]bis([1,2,6]thiadiazine) (2),11 have been studied as examples of ‘extreme quinoids’ that have ambiguous aromatic character, while Torroba et al.,12,13 prepared cyclopenta[1,2,6]thiadiazines 3 and 4 starting from cyclic enaminonitriles, some of which displayed unusual liquid crystalline properties or behaved as near infra-red dyes (Fig. 2).


image file: c4ra16144k-f2.tif
Fig. 2 Selected fused 4H-1,2,6-thiadiazines.

Since 2000, we have been developing the synthesis and chemistry of 4H-1,2,6-thiadiazines,6–8,14–18 which has led to the preparation of the dicyanomethylene analogue 5c, on treating tetracyanoethene (TCNE) with sulfur dichloride.6,8 Recently, an electrochemical study of a diverse library of 1,2,6-thiadiazines indicated the dicyanomethylenes had electron affinities of 3.8–4.0 eV that were suitable as electron acceptor components for organic photovoltaic devices,19 while organic solar cells containing small molecule donors incorporating 1,2,6-thiadiazinones have already led to PCE of ∼2.7%.20 Despite the potential applications, detailed spectroscopic studies of these compounds have not yet appeared in the literature. Below we report the preparation of 3,5-dichloro-4-methylene-4H-1,2,6-thiadiazine (5a) for the first time. With this compound in hand we have access to three 3,5-dichloro-4H-1,2,6-thiadiazines that vary at the C-4 position (Fig. 3), allowing us to study the influence of the electron withdrawing power of the C-4 substituent on the structure and electronic properties of the ring system.


image file: c4ra16144k-f3.tif
Fig. 3 Chemical structure of 3,5-dichloro-4-methylene-4H-1,2,6-thiadiazine (5a), 3,5-dichloro-4H-1,2,6-thiadiazin-4-one (5b) and 2-(3,5-dichloro-4H-1,2,6-thiadiazin-4-ylidene)malononitrile (5c) together with the IUPAC numbering system for the heterocycle.

2. Results and discussion

2.1. Synthesis

Thiadiazines 5b3 and 5c7,8 were prepared according to literature methods starting from dichloromalononitrile and TCNE, respectively. The 3,5-dichloro-4-methylene-4H-1,2,6-thiadiazine (5a) was prepared by reacting the dichlorothiadiazinone 5b with methylmagnesium bromide (2 equiv.) in diethyl ether at −78 °C for 15 min followed by treatment with TsOH·H2O (5 mol%) in toluene heated to ca. 110 °C (Scheme 1).
image file: c4ra16144k-s1.tif
Scheme 1 Synthesis of 4H-1,2,6-thiadiazines 5a, 5b and 5c.

The methylene thiadiazine 5a was isolated as yellow needles, mp 73–75 °C (from n-pentane), and showed a lower wavelength absorption in the UV/vis [λmax(DCM)/nm 309 (log[thin space (1/6-em)]ε 3.72)] than that recorded for the analogous thiadiazinone 5b [λmax(DCM)/nm 326 (log[thin space (1/6-em)]ε 4.38)] and the ylidenemalonitrile 5c [λmax(DCM)/nm 403 (log[thin space (1/6-em)]ε 4.38)]8 analogues (Fig. 5), suggesting a less delocalized system (see below). This was further supported by the compound's poor stability in the solid state. A pale yellow crystalline sample of the methylene 5a stored at room temperature gradually became orange and then red and on analysis (TLC) had decomposed showing no traces of the starting methylene 5a. Instead, a strong odor of sulfur chlorides was detected and TLC analysis showed several very minor products but interestingly little sulfur. This unexpected decomposition is currently under investigation and a detailed study will be reported in the near future.

In light of this instability, we prepared single crystals of the methylene 5a via slow cooling of a n-pentane solution and obtained a crystallographic structure (Fig. 4) allowing a bond length and bond angle analysis for comparison to the known X-ray structures of the analogous thiadiazinone 5b21 and ylidenemalononitrile 5c.6 While the thiadiazinone 5b was almost planar,21 the analogous methylene 5a deviated slightly from planarity but not to the extent displayed by the dicyanomethylene 5c.6 Tentatively, this deviation can be attributed to steric interactions between the thiadiazines 3,5-chlorines and the C-4 substituents.


image file: c4ra16144k-f4.tif
Fig. 4 Ortep representation of the single crystal X-ray structure of 3,5-dichloro-4-methylene-4H-1,2,6-thiadiazine (5a) with crystallographic atom labelling.

2.2. Optical properties

Fig. 5 presents absorption spectra of the three compounds of interest measured in DCM solution. The methylene thiadiazine 5a (X = CH2) shows an absorption band at 309 nm, while the absorption spectrum of the thiadiazinone 5b (X = O) is broad with clear contributions from two transitions, with a λmax at 290 and 326 nm. The absorption spectrum of the dicyanomethylene 5c [X = C(CN)2] is unstructured, broad and significantly red-shifted relative to the other two molecules, with a λmax at 404 nm, consistent with increased electron delocalization. The fluorescence spectrum of the methylene thiadiazine 5a (λmax = 376 nm) (Fig. 6) appears slightly broader than in the case of the thiadiazinone 5b (λmax = 373 nm), with weak vibronic structure. In the case of the dicyanomethylene 5c, the fluorescence spectrum is broader with a λmax at 473 nm, appreciably red-shifted relative to the other two molecules as also observed in absorption. In addition, the fluorescence intensity of the latter molecule is larger, pointing to a higher quantum yield, as evidenced by the larger noise in the normalized spectra of thiadiazines 5a and 5b.
image file: c4ra16144k-f5.tif
Fig. 5 Normalized absorption spectra of the thiadiazines 5a (X = CH2) (dotted line), 5b (X = O) (black line) and 5c [X = C(CN)2] (dashed line).

image file: c4ra16144k-f6.tif
Fig. 6 Normalized photoluminescence spectra of the thiadiazines 5a (X = CH2) (dotted line), 5b (X = O) (solid line) and 5c [X = C(CN)2] (dashed line) with excitation at λabs,max.

Insight into the optical properties of molecules 5a–c was derived from theoretical calculations of the frontier molecular orbitals. The HOMO and LUMO energy levels, as well as their spatial distributions are crucial parameters for determining the molecular electronic properties.22 The geometrical structures were fully optimized in their ground state at the MP2/6-311G(d) level of theory (Fig. 7). In agreement with the X-ray structure,6 the dicyanomethylene 5c adopted a shallow boat conformation in its optimized ground state geometry in contrast to compounds 5a and 5b that exhibited planar conformations. However, the dihedral angle between the planes defined by the C3–C4–C5 and the C3–N2–N6–C5 atoms (see Fig. 3) in 5c is 15.3°, while the angle between planes defined from the N2–S1–N6 atoms and the C3–N2–N6–C5 atoms is 8.7°. These measurements suggest there is sufficient π orbital overlap to consider the ring system to be weakly aromatic (see below).


image file: c4ra16144k-f7.tif
Fig. 7 The optimized lowest energy structures of the ground state of 4H-1,2,6-thiadiazines 5a, 5b and 5c at the MP2/6-311G(d) level of theory calculated using Gaussian (top view: above ring plane; bottom view: in plane).

Table 1 summarizes the dominant transitions, vertical transition energies calculated using the TD-DFT/B3LYP/6-311+G(2d) method on MP2/6-311G(d) optimized structures, the corresponding assignments of the experimental absorption spectra, and oscillator strengths for all three compounds. Closely-spaced transitions are calculated for all three compounds. For the methylene 5a, the major transitions (with the highest oscillator strength) are the HOMO → LUMO (45 → 46) and the HOMO → LUMO + 1 (45 → 47), with vertical excitation energies 4.12 and 3.47 eV (4.01 and 3.49 eV experimental values, respectively, assigned based on the oscillator strength of the two transitions). Interestingly, the calculated vertical excitation energy for the HOMO → LUMO + 1 appears at a lower energy than the transition assigned to the HOMO → LUMO. Computations using a variety of basis sets have reproduced this result, which suggests that additional terms (such as two-electron integrals) in addition to the energy difference between orbitals participating in the transition along with probably a mixture of electronic configurations describing the excited state, contribute to this vertical excitation energy, raising thus the energy of the HOMO → LUMO transition.23 This is not observed for the other two compounds. For the thiadiazinone 5b, the two major transitions are the HOMO → LUMO (45 → 46) and the HOMO → LUMO + 1 (45 → 47) with vertical excitation energies 4.00 and 4.24 eV, and oscillator strengths 0.1549 and 0.1377, respectively. These transitions agree with the experimental energies of the bands in the absorption spectrum, where we observe transition to two states, one at 3.80 and the other at 4.27 eV. Three major transitions are calculated in the case of the dicyanomethylene 5c the HOMO → LUMO (57 → 58) with ΔE = 3.16 eV, the HOMO → LUMO + 1 (57 → 59) with ΔE = 3.61 eV and the HOMO − 2 → LUMO (55 → 58) with ΔE = 4.52 eV. This is confirmed from the absorption spectrum of the molecule (Fig. 5).

Table 1 Calculated electronic transitions, vertical excitation energies and their assignments for compounds 5a–c using the TD-DFT/B3LYP/6-311+G(2d) method on MP2/6-311G(d) optimized structures
State Transitions ΔΕ (eV) ΔΕexp (eV) ΔΕexp (nm) f
5a
1A 4547 (0.70) (H → L + 1) 3.47 3.49 355 0.0299
2A 45 → 46 (0.69) (H → L) 4.12 4.01 309 0.2920
3A 44 → 46 (0.69) 4.61     0.0000
4A 44 → 47 (0.70) 4.71     0.0030
5A 45 → 49 (0.69) 4.86     0.0000
6A 45 → 48 (0.70) 4.91     0.0006
[thin space (1/6-em)]
5b
1A 44 → 46 (0.70) 3.07     0.0000
2A 44 → 47 (0.70) 3.92     0.0007
3A 45 → 46 (0.69) (H → L) 4.00 3.80 326 0.1549
4A 45 → 47 (0.69) (H → L + 1) 4.24 4.27 290 0.1377
5A 42 → 46 (0.69) 4.96     0.0000
6A 40 → 46 (0.70) 4.99     0.0000
[thin space (1/6-em)]
5c
1A 57 → 58 (0.69) (H → L) 3.16 3.07 404 0.2922
2A 57 → 59 (0.70) (H → L + 1) 3.61 3.71 334 0.0296
3A 54 → 58 (−0.27) 4.08     0.0052
56 → 58 (0.64)
4A 54 → 58 (0.64) 4.34     0.0021
56 → 58 (0.25)
5A 55 → 58 (0.56) 4.52 4.52 274 0.0938
6A 52 → 58 (0.64) 4.66     0.0074
57 → 60 (0.26)


Fig. 8 presents the frontier orbitals involved in the electronic transitions described in Table 4 for the three compounds. Despite the different substitution at C-4 for the thiadiazines 5a and 5b, their frontier orbital diagrams appear very similar. A difference is observed, though, in their HOMO orbitals, where in the thiadiazinone 5b the electron density is delocalized throughout the N[double bond, length as m-dash]C–C–C[double bond, length as m-dash]N moiety, while there is a node in the C–C bonds in the methylene 5a consistent with a more quinoidal structure. A further difference exists between the orbitals of thiadiazines 5a and 5b and those that correspond to the dicyanomethylene 5c, where electron density appears throughout the molecule, owing to the extended π-conjugated system offered by the [double bond, length as m-dash]C(CN)2 group. This is consistent with increased delocalization of the electron cloud and aromaticity of the ring (see below) as evidenced by the red-shift in the absorption spectrum and supported by the vertical excitation calculations. Observation of the electronic density contours of these orbitals identifies the HOMO – LUMO and the HOMO – LUMO + 1 transitions as π–π* in all cases.


image file: c4ra16144k-f8.tif
Fig. 8 Frontier MOs for the 4H-1,2,6-thiadiazines 5a–c calculated at the MP2/6-311G(d) level of theory.

2.3. Vibrational analysis of Raman spectra

The resonance Raman spectra of the thiadiazines 5a (upper), 5b (middle) and 5c (bottom) at room temperature are presented in Fig. 9 in the low frequency range (A) and in the range 950–1700 cm−1 (B). The spectra were obtained with excitation at 282.4 nm for compounds 5a and 5b and 368.9 nm for compound 5c. Assignment of the vibrational bands was facilitated by normal mode analysis performed using the Gaussian 03 suite of programs at the MP2/6-311G(d) level of theory.24 Worthy of note was that the frontier orbitals for the methylene 5a in Fig. 8 indicated that the two methylene protons have some electron density. As such, the use of a 6-311G(d,p) basis set could better describe this electron density and provide more accurate frequencies. Interestingly, the data obtained from a geometry optimised using the 6311G(d,p) basis set (data not shown), reproduced the vibrational frequencies to within 1% of the 6-311G(d) calculation.
image file: c4ra16144k-f9.tif
Fig. 9 (A) Resonance Raman (RR) spectra in the low frequency range of the thiadiazines 5a (upper), and 5b (middle) excited at 282.4 nm and 5c (bottom) at 368.9 nm. The intensity scale approximately maintains the band relative intensity with respect to the bands in the high frequency region (B). The gap in the spectra corresponds to the spectral region with the very intense solvent (DCM) bands at 700 and 740 cm−1, and a strong artifact peak at ∼500 cm−1. The asterisks correspond to solvent bands or stray scatter.
2.3.1. 3,5-Dichloro-4-methylene-4H-1,2,6-thiadiazine (5a). The most intense band in the spectrum of the methylene 5a appears at 1589 cm−1 and is assigned to the C[double bond, length as m-dash]C symmetric stretching vibration of the methylene group. The band at 1469 cm−1 is assigned to the C[double bond, length as m-dash]N symmetric stretch and the band at 1555 cm−1 to the C[double bond, length as m-dash]N asymmetric stretch. The latter assignment was based on the large intensity of this band and the absence of the symmetric stretch in the infrared spectrum (see below and ESI) as also predicted from the calculations. A band at 1040 cm−1 is attributed to the CH2 rock of the methylene group, while the CH2 bend appears at 1378 cm−1. These two assignments were aided by the absence of the analogous frequencies in the Raman spectra of the other two molecules. The band at 1062 cm−1 is attributed to the C–C–C symmetric stretch and the band observed at 1256 cm−1 is loosely assigned to the C–C–C asymmetric stretch. Identification of the latter band was ambiguous from the normal mode analysis and isotope exchange studies are required for a more convincing assignment. The N–S–N vibrations appear in the low frequency range (Fig. 7A): the ring N–S–N symmetric stretch appears at 825 and the N–S–N bend at 477 cm−1.

Interestingly, a number of bands appearing in the RR spectrum are assigned to asymmetric modes, while only totally-symmetric modes are expected. Such modes can only be observed through Albrecht B term enhancement, which suggests the presence and vibronic coupling of two closely-spaced electronic excited states.25 This behaviour is observed in all three molecules 5a, 5b and 5c. The electronic structure calculations presented above reveal closely-spaced vertical transitions, which support the experimental findings. In the case of the methylene 5a, the second absorption band is a weak band that appears around 350 nm as a shoulder to the main absorption band.

Infrared spectra of the compound in the solid state reveal close agreement with the Raman spectra (ESI, Fig. S1). All the experimental and calculated frequencies of the methylene 5a along with their assignments are listed in Table 2.

Table 2 Experimental and MP2/6-311G(d) calculated frequencies of the methylene thiadiazine 5a
Raman (on resonance) (cm−1) Raman (off resonance) (cm−1) IR (cm−1) MP2/6-311G(d) (cm−1) MP2/6-311G(d) (cm−1) molecule with H Assignmenta
a s = symmetric, as = asymmetric, ip = in plane, op = out of plane.b n.a. = not assigned.
364 364   357   s ring breathing/deformation
419 419   376 368 ring bend [op C–C–C (ring), N–S–N & C(CH2) bend, planar → boat]
477 477   486 445 s N–S–N & C–C–C bend
572 570       n.a.b
787 792 792 717   s N–S–N bend/ring deformation
825 827 824 846 674 s N–S–N stretch
861 861   838   CH2 op bending
1040   1040 1004 987 CH2 rock
1062   1057 1077 932 s C–C–C (ring) stretch
1194   1192     n.a.b
1220 1223       n.a.b
1256   1273 1318 1382 as C–C–C (ring) stretch
1289 1289 1290     N–S–N bend + as N–S–N stretch combination
1379   1383 1445 1454 CH2 s bend (scissoring)
1469 1467   1550 1581 s C[double bond, length as m-dash]N stretch
1555 1556 1549 1557 1551 as C[double bond, length as m-dash]N stretch
1589 1590 1587 1638 1653 s C[double bond, length as m-dash]C stretch and CH2 bend


2.3.2. 3,5-Dichloro-4H-1,2,6-thiadiazin-4-one (5b). The most intense bands for the thiadiazinone 5b appear in the range of 1473–1561 cm−1 and correspond to the C[double bond, length as m-dash]N stretching vibrations. The ring symmetric and asymmetric C[double bond, length as m-dash]N stretch appear at 1478 and 1504 cm−1, respectively. The Raman band for the C[double bond, length as m-dash]O symmetric stretch of the thiadiazinone 5b appears at 1678 cm−1 as expected for a carbonyl group.26 The symmetric N–S–N stretch appears at 849 cm−1 and the N–S–N bend at 486 cm−1. The band at 1063 cm−1 is attributed to the C–C–C symmetric stretch with the in-plane C–C–C asymmetric stretch appearing at 1242 cm−1. There is a close agreement between the bands appearing in the RR and IR spectra for this molecule (see ESI) and the calculated and experimental frequencies with their assignments are listed in Table 3.
Table 3 Experimental and MP2/6-311G(d) calculated frequencies of the thiadiazinone 5b
Raman (on resonance) (cm−1) Raman (off resonance) (cm−1) IR (cm−1) MP2/6-311G(d) (cm−1) MP2/6-311G(d) (cm−1) molecule with H Assignmenta
a s = symmetric, as = asymmetric, ip = in plane, op = out of plane.b n.a. = not assigned.
362     369   ip ring deformation
428 429   446 440 ring bend (op N–S–N & C[double bond, length as m-dash]O bend) planar → boat
486 486   494 460 s N–S–N & C–C–C bend
  528   513 531 C[double bond, length as m-dash]O bending + ring deformation
849   854 875 701 s N–S–N stretch
1063 1062 1063 1097 916 s C–C–C (ring) stretch
1221   1225     n.a.b
1242 1242 1250 1273 1315 as C–C–C (ring) stretch
1321         n.a.b
1478 1477   1461 1519 s C[double bond, length as m-dash]N stretch
1504 1503 1501 1493 1509 as C[double bond, length as m-dash]N stretch
1678 1676 1657 1691 1689 s C[double bond, length as m-dash]O stretch


2.3.3. 2-(3,5-Dichloro-4H-1,2,6-thiadiazin-4-ylidene)malononitrile (5c). Fig. 9 (bottom) depicts the RR spectra of the dicyanomethylene 5c with excitation at 368.9 nm. The dicyanomethylene group adds new degrees of freedom to this thiadiazine which complicates the spectra. Based on the normal mode analysis, many of the ring normal modes involve contributions from the substituent in the C-4 position. The most intense band for this compound (1526 cm−1) corresponds to the C[double bond, length as m-dash]C symmetric stretch of the dicyanomethylene group. The bands corresponding to the C[double bond, length as m-dash]N symmetric and asymmetric stretching vibrations appear at 1486 and 1512 cm−1, respectively. The mode at 1512 cm−1 was deconvolved from the band including the C[double bond, length as m-dash]C stretch. The band at 962 cm−1 is assigned to the C–C–C bending of the dicyanomethylene group in combination with ring C–C–C bending. The symmetric and asymmetric ring C–C–C stretches appear at 1082 and 1283 cm−1, while the band at 1187 cm−1 is attributed to C–C–C asymmetric stretching of the dicyanomethylene group. In the range of low frequencies (Fig. 9A, bottom) there are bands due to N–S–N, C–C–C (dicyanomethylene group) and C–C–C (ring) vibrations which appear with enhanced intensity compared to the other two molecules. The N–S–N bend of the dicyanomethylene 5c appears at 598 cm−1 in combination with the symmetric C–C–C bend of the dicyanomethylene moiety, and the symmetric N–S–N stretch appears at 812 cm−1. Finally, the band at 448 cm−1 is assigned to a ring bend that involves switching between the boat and the planar conformation. The experimental and calculated vibrational frequencies for the dicyanomethylene 5c, considering the boat conformation, are listed in Table 4.
Table 4 Experimental and MP2/6-311G(d) calculated frequencies of the dicyanomethylene 5c
Raman (on resonance) (cm−1) Raman (off resonance) (cm−1) IR (cm−1) MP2/6-311G(d) (cm−1) MP2/6-311G(d) (cm−1) molecule with H Assignmenta
a s = symmetric, as = asymmetric, ip = in plane, op = out of plane.b After deconvolution.
358     364 392 ring op bending (boat → planar)
448     456 559 ring op bending (boat → planar)
598     597 624 s C–C–C (dicyano) & N–S–N bend
812 812 812 823 737 s N–S–N stretch
962   966 959 922 C–C–C (dicyano) & C–C–C (ring) bend
1082   1082 1135 981 s C–C–C (ring) stretch
1187     1181 1206 as ν[C–C–C (dicyano) and C–C–C (ring)]
1283   1288 1319 1404 as ν[C–C–C (ring) stretch and C–C–C (dicyano)]
1486 1486 1487 1456 1526 s C[double bond, length as m-dash]N stretch
1512b   1508 1465 1492 as C[double bond, length as m-dash]N stretch
1525 1525 1522 1567 1596 s C[double bond, length as m-dash]C stretch
2090     2144 2160 as C–(C[triple bond, length as m-dash]N)2 stretch
2226   2216 2148 2163 s C–(C[triple bond, length as m-dash]N)2 stretch


2.4. Structural considerations

The above analysis of the resonance Raman spectra points to distinct differences and similarities in the structure of the three thiadiazines as evidenced by key vibrational modes. The C[double bond, length as m-dash]N symmetric stretching modes appear systematically at higher frequencies with an increase in the electronegativity of the C-4 substituent cf. 1469, 1478, and 1486 cm−1 for thiadiazines 5a (X = CH2), 5b (X = O) and 5c [X = C(CN)2], respectively, signifying an increase in the C[double bond, length as m-dash]N bond strength and shortening of the bond (Table 5). An increase in frequency was also observed for the ring C–C–C symmetric mode for the most electronegatively-substituted dicyanomethylene 5c with respect to thiadiazines 5a and 5b where it stays almost identical. The latter is in agreement with the calculated frequencies, as well as the increased electron density along the C–C–C bonds seen in the HOMO orbital diagram.
Table 5 Comparison of key vibrational mode frequencies for the three compounds under consideration, both experimentally and theoretically
  Experimental ν (cm−1)
Vibrational mode 5a 5b 5c
C[double bond, length as m-dash]C 1589 1678 (C[double bond, length as m-dash]O) 1525
C[double bond, length as m-dash]N (s, as) 1469/1555 1478/1504 1486/1512
N–S–N δ 477 486 595
N–S–N (s) 825 849 812
C–C–C (s) 1062 1063 1082

  Calculated ν (cm−1) (Cl substitution)
Vibrational mode 5a 5b 5c
C[double bond, length as m-dash]C 1638 1691 1567
C[double bond, length as m-dash]N (s, as) 1550/1557 1461/1493 1456/1465
N–S–N δ 486 494 593
N–S–N (s) 846 873 823
C–C–C (s) 1077 1097 1135

  Calculated ν (cm−1) (H substitution)
Vibrational mode 5a 5b 5c
C[double bond, length as m-dash]C 1653 1689 1596
C[double bond, length as m-dash]N (s, as) 1581/1551 1519/1509 1526/1492
N–S–N δ 445 460 624
N–S–N (s) 674 701 737
C–C–C (s) 932 916 981


In the low frequency region, the N–S–N bend is one of the most prominent modes. An increasing trend was also observed for the frequency of this normal mode, with a significant increase in the case of the dicyanomethylene 5c (477, 486, and 595 cm−1, for thiadiazines 5a, 5b and 5c, respectively). In the latter case, normal mode analysis shows two N–S–N bending modes, at 597 and 625 cm−1, both coupled to the dicyanomethylene C–C–C bend but with decreased motion of the sulfur atom. Therefore, it is possible that the mode description is slightly different for the dicyanomethylene 5c. However, the overall increased strength of the C[double bond, length as m-dash]N bond with electronegativity could be responsible for the N–S–N bend frequency increase, as it can hinder the bending motion, thus driving upwards the frequency of this mode.

The N–S–N symmetric stretch depicts a different behaviour; the frequency of the mode increases on going from thiadiazines 5a to 5b, but drops significantly in the dicyano-methylene 5c. This can be tentatively attributed to the change in the ring geometry towards a boat conformation owing to steric interactions between the Cl atoms at the 3 and 5 positions and the bulky dicyanomethylene group that might result in a longer N–S bond. Support for this hypothesis arises from the calculation of the structure and frequencies of all three rings where the chlorine atoms are replaced by hydrogen (Tables 2–5). In this case, the optimized geometry of the rings of all three thiadiazines is planar, and the N–S–N symmetric stretch frequency increases with an increase in the electronegativity of the substituent.

Evidence for delocalization of electron density on going from the methylene 5a to the dicyanomethylene 5c comes from the bands corresponding to the C[double bond, length as m-dash]C symmetric stretch in the C-4 position, where a downshift from 1589 to 1526 cm−1 is observed. This delocalization was also supported from the large red shift of both the absorption and fluorescence spectra in the dicyanomethylene 5c. Interestingly, the delocalization occurs even though the dicyano-methylene 5c is not planar. The dihedral angles for both the N–S–N and the C–C–C moiety mentioned earlier are, however, shallow enough (<20°) that orbital overlap is not compromised. Similar observations were reported for deformations of the benzene ring endocyclic torsion angles, where even a 30° deformation retained the topological characteristics of the electron density distribution.27,28 Furthermore, the study by Shishkin et al.,28 estimates that a 15° deformation from planarity results in an increase in energy of less than 1.5 kcal mol−1, suggesting that aromatic rings can possess a significant degree of conformational flexibility while remaining stable. This delocalization of the electron cloud with an increase in the electronegativity of the substituent is further confirmed by the increase in the vibrational frequency of the C–C–C symmetric stretches signifying an increase in the bond order. By analogy, it is expected that the C[double bond, length as m-dash]N frequency would decrease on going towards a more aromatic system as predicted by computations. Nevertheless, the experimental spectra show a contradictory but small increase of this frequency (∼9 cm−1 increase at a time, while the difference between the methylene 5a and the other two rings is ∼90 cm−1 in the computations). The X-ray data reveal that the C[double bond, length as m-dash]N bonds are very similar in all three rings, so in the case of the C[double bond, length as m-dash]N bond the computations have overestimated the bond length. A similar trend is also found in the computation with the hydrogen atoms, with the methylene C[double bond, length as m-dash]N bond frequency found much larger than for the other two molecules. The behaviour observed for the C[double bond, length as m-dash]N mode in the experimental spectra of the rings in solution can be attributed to a balance of various forces occurring upon substitution with an electronegative group. More specifically, if a strongly electronegative substituent group is introduced to the ring, electron density will be drawn away, triggering the chlorines and sulfur to release more electron density to stabilize the ring.

The out-of-plane deformability of an aromatic ring and the out-of-plane vibrational frequencies are a sensitive measure of aromaticity in cyclic π-conjugated systems, including heterocyclic compounds such as azines.27–29 A greater conformational flexibility of a conjugated ring is associated with reduced aromaticity and, consequently, lower out-of-plane vibrational frequencies. In Table 6 the lowest calculated frequencies for a variety of out-of-plane deformation modes of the three compounds are compared, both with Cl and H substitution. On going from thiadiazine 5a to 5b the frequencies of the modes generally increase. In the case of the dicyanomethylene 5c, however, for each vibrational mode in thiadiazines 5a and 5b there are two modes in 5c that describe the same motion in the ring and which are simultaneously coupled to vibrations in the substituent. Considering the higher frequency mode in this pair, there is a general increase in the out-of-plane vibrational frequencies with an increase in the electronegativity of the substituent at the C-4 position, which can be correlated with the increase in the aromaticity of a cyclic π-conjugated system.

Table 6 MP2/6-311G(d) calculated frequencies for out-of-plane deformation normal modes of thiadiazines 5a, 5b, and 5c
Calculated ν (cm−1) Assignment
5a 5b 5c
18 54 132 op C–C–C ring bend
195 194 186/224 op C–C–C (ring)/N–S–N deformation
376 445 364/456 ring bend [op C–C–C (ring), N–S–N bend, planar → boat]

Calculated ν (cm−1) (H substitution) Assignment
60 105 60/179 op C–C–C ring bend
368 440 392/559 ring bend [op C–C–C (ring), N–S–N bend, planar → boat]
387 385 387/440 op C–C–C (ring)/N–S–N deformation


The above observations are in line with the statistical evaluation of deviations in peripheral bond orders derived from crystallographically determined bond lengths within the ring,30,31 which indicated that thiadiazine 5a has a low Bird's aromaticity index IA = 45, while those of the analogous thiadiazinone 5b and the dicyanomethylene 5c are 54 and 60,4,6 respectively [cf. furan (IA = 53) and benzene (IA = 100)].24,25 This supports an aromaticity order across the three analogues of 5a (X = CH2) < 5b (X = O) < 5c [X = C(CN)2], which is in line with the relative electron withdrawing power of the C-4 substituents and the stability of the rings. The more strongly electron withdrawing C-4 substituents [O and C(CN)2] presumably enable a greater contribution of resonance forms like I, and even II, to the overall electronic structure (Scheme 2).


image file: c4ra16144k-s2.tif
Scheme 2 Resonance structures of 3,5-dichloro-4H-1,2,6-thiadiazines 5a–c.

The influence of the electronegativity of a substituent on the structure and electronic properties of an electron-poor heterocycle is important within the organic semiconductor community that seeks new opportunities for improving the optoelectronic properties of push–pull materials employed in photovoltaic devices. Some of the most efficient polymeric materials currently under investigation include electron acceptor molecules with the N–S–N moiety.32 Therefore, a salient question would be whether the ring system investigated in this study can be useful as potential component in push–pull compounds. Introducing a strong electron withdrawing group at the C-4 position of the thiadiazine such as the dicyanomethylene improves the electron affinity of the ring system but unfavourable steric interactions of this bulky substituent with the chlorines in the 3 and 5 position leads to deformation of the ring system. Despite this ring deformation, the overall aromaticity of the dicyanomethylene 5c improves. Electrochemical studies on the three molecules investigated here showed that indeed the dicyanomethylene 5c has the best prospects as an electron acceptor owing to the low LUMO energy.19

3. Conclusion

The present study focused on the effect of C-4 substitution on the structure and electronic properties of 3,5-dichloro-4H-1,2,6-thiadiazine rings, investigated with absorption, fluorescence and Resonance Raman spectroscopy. The combined evidence suggests that increasing the electronegative nature of the substituent leads to delocalization of the electron cloud and increased aromaticity of the ring, despite the slight deviation of the dicyanomethylene 5c ring from planarity.

4. Experimental

4.1. Synthesis

4.1.1. General procedures. Et2O was distilled over CaH2. Anhydrous Na2SO4 was used for drying organic extracts and all volatiles were removed under reduced pressure. All reaction mixtures and column eluents were monitored by TLC using commercial glass backed thin layer chromatography (TLC) plates (Merck Kieselgel 60 F254). The plates were observed under UV light at 254 and 365 nm. The technique of dry flash chromatography was used throughout for all non-TLC scale chromatographic separations using Merck Silica Gel 60 (less than 0.063 mm).33 Melting points were determined using a PolyTherm-A, Wagner & Munz, Koefler-Hotstage Microscope apparatus. Solvents used for recrystallization are indicated after the melting point. Initial UV spectra were obtained using a Perkin-Elmer Lambda-25 UV/vis spectrophotometer. IR spectra were recorded on a Shimadzu FTIR-NIR Prestige-21 spectrometer with Pike Miracle Ge ATR accessory and strong, medium and weak peaks are represented by s, m and w, respectively. 1H and 13C NMR spectra were recorded on a Bruker Avance 500 machine (at 500 and 125 MHz, respectively). Deuterated solvents were used for homonuclear lock and the signals are referenced to the deuterated solvent peaks. Low resolution (EI) mass spectra were recorded on a Shimadzu Q2010 GCMS with direct inlet probe. 3,5-Dichloro-4H-1,2,6-thiadiazin-4-one (5b)3 and 2-(3,5-dichloro-4H-1,2,6-thiadiazin-4-ylidene)malononitrile (5c)8 were prepared according to literature procedures.
4.1.2. 3,5-Dichloro-4-methylene-4H-1,2,6-thiadiazine (5a). To a flask containing 3,5-dichloro-4H-1,2,6-thiadiazin-4-one (5b) (370 mg, 2.02 mmol) and dry Et2O (4 mL) under argon at −78 °C, was added MeMgBr (2.9 mL, 2 equiv.) and the mixture was stirred at this temperature until no starting material remained (TLC). The reaction mixture was then quenched with saturated NH4Cl and extracted (DCM). The organic layer was washed with brine, dried and evaporated. The resulting product (402 mg, 100%) was dissolved in PhMe (4 mL) and p-TsOH·H2O (38 mg, 0.202 mmol) was added and the mixture was heated at ca. 110 °C until no starting material remained (TLC). The reaction mixture was adsorbed onto silica and chromatography (n-hexane/DCM, 7[thin space (1/6-em)]:[thin space (1/6-em)]3) gave the title compound 5a (183 mg, 50%) as yellow needles, mp 73–75 °C (from n-pentane, 0 °C); Rf 0.48 (n-hexane/DCM, 7[thin space (1/6-em)]:[thin space (1/6-em)]3); (found: C, 26.63; H, 1.05; N, 15.40. C4H2Cl2N2S requires C, 26.54; H, 1.11; N, 15.47%); λmax(DCM)/nm 230 (log[thin space (1/6-em)]ε 3.06), 309 (3.72); vmax/cm−1 3132w, 3030w, 1838w, 1587w, 1549s, 1383w, 1290m, 1273s, 1192w, 1057w, 1040m, 980s, 916 s, 824w, 793w; δH (500 MHz; CDCl3) 6.11 (2H, s, CH2); δC (125 MHz; CDCl3) 145.3 (s), 125.3 (s), 120.1 (CH2); m/z (EI) 184 (M+ + 3, 7%), 182 (M+ + 1, 34), 180 (M+ − 1, 47), 147 (43), 145 (100), 118 (4), 109 (19), 93 (12), 84 (17), 82 (9), 67 (13), 58 (13).

4.2. Electronic spectroscopy

The absorption spectra were recorded on a JASCO V-530 UV-visible spectrophotometer and fluorescence spectra were obtained after excitation at the corresponding λabs,max on a JASCO FP-6300 spectrofluorometer. Solutions of the compounds 5a–c were prepared in dichloromethane with concentrations of the order of 10−4 M ([5a] = 6.6 × 10⁻⁴, [5b] = 5.5 × 10⁻⁴, [5c] = 3.9 × 10⁻⁴ mol L−1 for absorption and RR measurements and for fluorescent measurements [5a] = 5.5 × 10⁻⁴, [5b] = 5.5 × 10⁻⁴, [5c] = 4.3 × 10⁻⁴ mol L−1). Dichloromethane was of HPLC grade (Aldrich) and used as received.

4.3. Resonance Raman spectroscopy

RR measurements were performed using a homebuilt system described elsewhere.34 Briefly, the excitation wavelengths in the region of interest are produced via Raman shifting of the second harmonic from a Q-switched Nd:YAG laser at 532 nm and using the 2nd and 4th anti-Stokes line at 368.91 and 282.35 nm, respectively. The excitation light was focused into a spinning cell, consisting of an EPR quartz tube (diameter: 4 mm), attached to a rheostat-controlled motor for choice of rotation speed. Use of the spinning cell prolonged the lifetime of the samples, as no degradation was observed after 1 h, at which point a fresh sample was used. The Raman scattered light was collected in a backscattering geometry and delivered to a 0.75 m focal-length Czerny–Turner spectrograph, equipped with a 2400-grooves per mm UV-enhanced holographic grating. The slit width was set to 100 μm providing for 4 and 6.5 cm−1 spectral resolution at the wavelengths used in this work (λ = 368.91 and 282.35 nm, respectively). The scattered light was detected by a LN2-cooled 2048 × 512 pixel, back-illuminated UV-enhanced CCD detector (Spec10:2KBUV/LN, Princeton Instruments). Frequency calibration was accomplished with the use of toluene at 368.91 nm and cyclohexane at 282.35 nm. MATLAB was used for spectral treatment and analysis.

4.4. Computational procedures

The geometry of each system was fully optimized using the MP2/6-311G(d) methods which gave reasonable comparison of X-ray determined bond lengths and angles for all three structures. Raman frequencies were calculated at the same level of theory for each optimized structure. Time-dependent calculations were implemented using the TD-DFT/B3LYP/6-311+G(2d) method on the MP2/6-311G(d) optimized structures. All the above computations were performed using the Gaussian 03 suite of programs.24

4.5. X-ray crystallographic studies

Data were collected on an Oxford-Diffraction Supernova diffractometer, equipped with a CCD area detector utilizing Cu-Kα radiation (λ = 1.5418 Å). A suitable crystal was attached to glass fibers using paratone-N oil and transferred to a goniostat where they were cooled for data collection. Unit cell dimensions were determined and refined by using 957 (4.64 ≤ θ ≤ 66.95°) reflections. Empirical absorption corrections (multi-scan based on symmetry-related measurements) were applied using CrysAlis RED software.35 The structures were solved by direct method and refined on F36 using full-matrix least squares using SHELXL97.36 Software packages used: CrysAlis CCD35 for data collection, CrysAlis RED35 for cell refinement and data reduction, WINGX for geometric calculations,37 and DIAMOND38 for molecular graphics. The non-H atoms were treated anisotropically. The hydrogen atoms were placed in calculated, ideal positions and refined as riding on their respective carbon atoms.
4.5.1. Crystal refinement data for compound 5a. C4H2Cl2N2S, M = 181.04, monoclinic, space group P21/c, a = 3.8127(5) Å, b = 17.606(2) Å, c = 9.6396(15) Å, α = 90°, β = 99.086(14)°, γ = 90°, V = 638.96(15) Å3, Z = 4, T = 100(2) K, ρcalcd = 1.882 g cm−3, 2θmax = 67. Refinement of 82 parameters on 1129 independent reflections out of 2048 measured reflections (Rint = 0.0353) led to R1 = 0.0474 [I > 2 s(I)], wR2 = 0.1434 (all data), and S = 1.089 with the largest difference peak and hole of 0.679 and −0.414 × 10⁻³, respectively.

Acknowledgements

The authors thank the Cyprus Research Promotion Foundation [Grant nos NEKYΠ/0308/02, ΣTPATHII/0308/06, TEXNO/0104/04 and ENIΣX/0504/08], the University of Cyprus for a Medium Sized Research Grant, and the following organizations in Cyprus for generous donations of chemicals and glassware: the State General Laboratory, the Agricultural Research Institute, the Ministry of Agriculture, MedoChemie Ltd, Medisell Ltd and Biotronics Ltd. Finally, we thank the A.G. Leventis Foundation for helping to establish the NMR facility in the University of Cyprus.

References

  1. A. R. Katritzky and A. F. Pozharskii, Handbook of Heterocyclic Chemistry, Pergamon Press, Oxford, 2nd edn, 2000 Search PubMed.
  2. S. P. Economopoulos, G. Itskos, P. A. Koutentis and S. A. Choulis, Overview of Polymer and Copolymer Materials for Organic Photovoltaics, Wiley-VCH Verlag GmbH & Co. KGaA., 2nd edn, 2014 Search PubMed.
  3. J. Geevers and W. P. Trompen, Recl. Trav. Chim. Pays-Bas, 1974, 93, 270–272 CrossRef CAS.
  4. C. J. Peake, W. N. Harnish and B. L. Davidson, U.S. Patent 4,097,594, 1978.
  5. M. P. Cava, M. V. Lakshmikantham, R. Hoffmann and R. M. Williams, Tetrahedron, 2011, 67, 6771–6797 CrossRef CAS PubMed.
  6. P. A. Koutentis, C. W. Rees, A. J. P. White and D. J. Williams, Chem. Commun., 2000, 303–304 RSC.
  7. P. A. Koutentis and C. W. Rees, J. Chem. Soc., Perkin Trans. 1, 2000, 2601–2607 RSC.
  8. P. A. Koutentis and C. W. Rees, J. Chem. Soc., Perkin Trans. 1, 2000, 1089–1094 RSC.
  9. P. Flowerday and M. J. Perkins, Tetrahedron Lett., 1968, 9, 1261–1264 CrossRef.
  10. P. Flowerday, M. J. Perkins and A. R. J. Arthur, J. Chem. Soc., 1970, 290–297 CAS.
  11. R. C. Haddon, M. L. Kaplan and J. H. Marshall, J. Am. Chem. Soc., 1978, 100, 1235–1239 CrossRef CAS.
  12. S. Macho, D. Miguel, T. Gomez, T. Rodriguez and T. Torroba, J. Org. Chem., 2005, 70, 9314–9325 CrossRef CAS PubMed.
  13. S. Macho, D. Miguel, A. G. Neo, T. Rodriguez and T. Torroba, Chem. Commun., 2005, 334–336 RSC.
  14. P. A. Koutentis and C. W. Rees, J. Chem. Soc., Perkin Trans. 1, 2000, 1081–1088 RSC.
  15. A. S. Kalogirou, P. A. Koutentis and M. D. Rikkou, Tetrahedron, 2010, 66, 1817–1820 CrossRef CAS PubMed.
  16. H. A. Ioannidou, C. Kizas and P. A. Koutentis, Org. Lett., 2011, 13, 3466–3469 CrossRef CAS PubMed.
  17. H. A. Ioannidou, C. Kizas and P. A. Koutentis, Org. Lett., 2011, 13, 5886–5889 CrossRef CAS PubMed.
  18. H. A. Ioannidou and P. A. Koutentis, Tetrahedron, 2012, 68, 2590–2597 CrossRef CAS PubMed.
  19. S. P. Economopoulos, P. A. Koutentis, H. A. Ioannidou and S. A. Choulis, Electrochim. Acta, 2013, 107, 448–453 CrossRef CAS PubMed.
  20. F. Hermerschmidt, A. S. Kalogirou, J. Min, G. A. Zissimou, S. M. Tuladhar, T. Ameri, H. Faber, G. Itskos, S. A. Choulis, T. D. Anthopoulos, D. D. C. Bradley, J. Nelson, C. J. Brabec and P. A. Koutentis, J. Mater. Chem. C, 2015 10.1039/c4tc02931c.
  21. S. Harkema, Acta Crystallogr., Sect. B: Struct. Crystallogr. Cryst. Chem., 1978, 34, 2927–2928 CrossRef.
  22. R. P. Ortiz, J. Casado, V. Hernández, J. T. L. Navarrete, J. A. Letizia, M. A. Ratner, A. Facchetti and T. J. Marks, Chem.–Eur. J., 2009, 15, 5023–5039 CrossRef CAS PubMed.
  23. Personal communication with C. Walter, 2014.
  24. G. W. T. M. J. Frisch, H. B. Schlegel, G. E. Scuseria, M. A. Robb, J. R. Cheeseman, Jr. J. A. Montgomery, T. Vreven, K. N. Kudin, J. C. Burant, J. M. Millam, S. S. Iyengar, J. Tomasi, V. Barone, B. Mennucci, M. Cossi, G. Scalmani, N. Rega, G. A. Petersson, H. Nakatsuji, M. Hada, M. Ehara, K. Toyota, R. Fukuda, J. Hasegawa, M. Ishida, T. Nakajima, Y. Honda, O. Kitao, H. Nakai, M. Klene, X. Li, J. E. Knox, H. P. Hratchian, J. B. Cross, V. Bakken, C. Adamo, J. Jaramillo, R. Gomperts, R. E. Stratmann, O. Yazyev, A. J. Austin, R. Cammi, C. Pomelli, J. W. Ochterski, P. Y. Ayala, K. Morokuma, G. A. Voth, P. Salvador, J. J. Dannenberg, V. G. Zakrzewski, S. Dapprich, A. D. Daniels, M. C. Strain, O. Farkas, D. K. Malick, A. D. Rabuck, K. Raghavachari, J. B. Foresman, J. V. Ortiz, Q. Cui, A. G. Baboul, S. Clifford, J. Cioslowski, B. B. Stefanov, G. Liu, A. Liashenko, P. Piskorz, I. Komaromi, R. L. Martin, D. J. Fox, T. Keith, M. A. Al-Laham, C. Y. Peng, A. Nanayakkara, M. Challacombe, P. M. W. Gill, B. Johnson, W. Chen, M. W. Wong, C. Gonzalez and J. A. Pople, Gaussian, Inc., Wallingford CT, 2004.
  25. J. L. McHale, Molecular Spectroscopy, Prentice Hall, 1998 Search PubMed.
  26. R. M. Silverstein, F. X. Webster and D. Kiemle, Spectrometric Identification of Organic Compounds, John Wiley and Sons, New York, NY, USA, 7th edn, 2005 Search PubMed.
  27. O. V. Shishkin, I. V. Omelchenko, M. V. Krasovska, R. I. Zubatyuk, L. Gorb and J. Leszczynski, J. Mol. Struct., 2006, 791, 158–164 CrossRef CAS PubMed.
  28. O. V. Shishkin, K. Y. Pichugin, L. Gorb and J. Leszczynski, J. Mol. Struct., 2002, 616, 159–166 CrossRef CAS.
  29. I. V. Omelchenko, O. V. Shishkin, L. Gorb, J. Leszczynski, S. Fias and P. Bultinck, Phys. Chem. Chem. Phys., 2011, 13, 20536–20548 RSC.
  30. C. W. Bird, Tetrahedron, 1986, 42, 89–92 CrossRef CAS.
  31. C. W. Bird, Tetrahedron, 1992, 48, 335–340 CrossRef CAS.
  32. P. A. Koutentis, in Comprehensive Heterocyclic Chemistry III, ed. V. V. Zhdankin, 2008, vol. 5, pp. 515–565 Search PubMed.
  33. L. M. Harwood, Aldrichimica Acta, 1985, 18, 25 Search PubMed.
  34. G. K. Pieridou and S. C. Hayes, Phys. Chem. Chem. Phys., 2009, 11, 5302–5309 RSC.
  35. O. Diffraction, CrysAlis CCD and CrysAlis RED, Oxford Diffraction Ltd, Abingdon, Oxford, England, 2008 Search PubMed.
  36. G. M. Sheldrick, SHELXL97dA Program for the Refinement of Crystal Structure, University of Göttingen, Germany, 1997 Search PubMed.
  37. L. Farrugia, J. Appl. Crystallogr., 1999, 32, 837–838 CrossRef CAS.
  38. K. Brandenburg, Diamond, Crystal Impact GbR, Bonn, Germany, 2006 Search PubMed.

Footnote

Electronic supplementary information (ESI) available: Comparison of IR and resonance Raman spectra of thiadiazines 5a–c (Fig. S1). Atomic coordinates of the geometry-optimized structures of thiadiazines 5a–c and their H analogues using MP2/6-311G(d). Comparison of bond lengths and angles of thiadiazines 5a–c from single crystal X-ray structures and geometry optimizations. CCDC 1038262. For ESI and crystallographic data in CIF or other electronic format see DOI: 10.1039/c4ra16144k

This journal is © The Royal Society of Chemistry 2015
Click here to see how this site uses Cookies. View our privacy policy here.