One-pot synthesis of chitosan–dehydropregnenolone acetate ketimine nanoparticles and their antifungal bioevaluation†
Archana M. Das*a,
Raju Khanb,
Manash P. Hazarikaa,
Debjani Baruaha and
Purnajyoti D. Bhuyanc
aNatural Products Chemistry Division, CSIR-North East Institute of Science & Technology, Jorhat – 785 006, Assam, India. E-mail: archanads2@gmail.com; Tel: +91 9435489369
bAnalytical Chemistry Division, CSIR-North East Institute of Science & Technology, Jorhat – 785 006, Assam, India
cMedicinal and Aromatic Plant Division, CSIR-North East Institute of Science & Technology, Jorhat – 785 006, Assam, India
First published on 2nd January 2015
Abstract
This paper presents a new method for fabricating biodegradable bio-polymeric nanoparticles via a convenient one-pot strategy at room temperature under stirring conditions for application to communicable diseases. The simultaneous synthesis and assembly of chitosan–16-dehydropregnenolone acetate (CHDPA) nanoparticles were characterized using Fourier transform infrared (FT-IR) spectroscopy, and 1H NMR and UV vis analyses and the morphology along-with the particle size were identified using scanning electron microscopy (SEM) and transmission electron microscopy (TEM). In this study, the antifungal properties of the CHDPA nanoparticles were tested by measuring their antifungal activity against the fungus Colletotrichum gloeosporioides. The drug loading capacity (LC), encapsulation efficiency (EE) and drug release were investigated using UV spectrophotometry.
1. Introduction
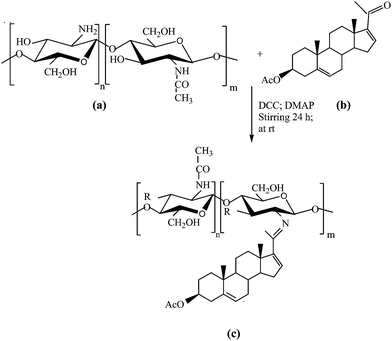
Nanostructured materials have recently gained much attention in many biology related applications and advanced nanodevices in the field of bio-nanotechnology. The assembly of nanostructures across several length-scales is of paramount importance in the synthesis of organized materials with advanced functions. Chitosan, a natural-based polymer obtained by alkaline deacetylation of chitin, is nontoxic, biocompatible, and biodegradable. Owing to its properties, chitosan can be used in medicine, pharmacy, biotechnology, agriculture, the food industry as well as for biodegradable and biocompatible materials, and antimicrobial compounds.1–4 The polycationic biopolymer receives a great deal of attention for biosensing, medical, and pharmaceutical applications5–7 and it is the most commonly used natural polymer in regenerative medicine and tissue engineering.8 Chitosan micro- or nanofibers have been widely accepted as biomedical scaffolding materials to restore, maintain, or improve the functions of various tissues.9,10 Therefore, the development of chitosan nanostructures with controllable morphologies is highly desirable, but has had limited success as yet. However, one elegant method, electrospinning, has been reported for producing chitosan nanofibers. Because of their biocompatibility and biodegradability, the resulting chitosan nanostructures can potentially be tailored to mimic a natural extracellular matrix, achieve controlled drug delivery, and develop tissue-compatible scaffolds for tissue cultures. Thus, chitosan derivatives possess many useful biological properties such as biocompatibility, biodegradation, wound healing and anti-bacterial action.1,11–13 Therefore, much attention has been paid to developing chitosan-based biomedical materials. Chemical modifications of chitosan are useful for the association of bioactive molecules to the polymer and for controlling the drug release profile.In this study, the nanostructural mechanical properties and biocompatibility of novel chitosan–16-DPA particles were evaluated. They have been widely used in pharmaceutical research and industry as a carrier for drug delivery and as a biomedical material.14 Chitosan was selected for the nanoparticles because of its recognized mucoadhesivity and ability to enhance the penetration of large molecules across mucosal surfaces.15
Our efforts have been concentrated on synthesizing hybrid nanoparticles using a convenient one-pot method and a literature survey showed that no work has been reported on this topic, particularly using 16-dehydropregnenolone acetate. Significantly, our results show that a polymer of single composition and short length could contribute to the growth of highly anisotropic structures. Such an anisotropic aggregation is most likely due to the nonuniform distribution of the capping agents on the amorphous steroid nanoparticle surfaces. The aim of the present investigation is the synthesis and characterization of novel biodegradable nanoparticles based on chitosan for the encapsulation of 16-DPA, and the product has been screened for antifungal activity against the fungus Colletotrichum gloeosporioides. The drug loading capacity (LC), encapsulation efficiency (EE) and drug release were investigated using UV spectrophotometry.
2. Materials and methods
2.1. Materials and chemicals
Chitosan (CH) (MW 2.4 × 10⁶), 16-dehydropregnenolone acetate (16-DPA), N,N-dicyclohexylcarbodiimide (DCC) and 4-dimethylaminopyridine (DMAP) were purchased from Sigma-Aldrich and used directly without purification. Acetonitrile, ethyl acetate, methanol, NaCl, Na2HPO4 and KH2PO4 were purchased from CDH with analytical grade and only distilled solvents were used for the reactions. Triple distilled H2O was used for the preparation of the solutions.2.2. Methodology
2.2.3.1. Fungus and media. The antifungal activity of the new modified chitosan (CHDPA) was studied against the fungus Colletotrichum gloeosporioides.
The inhibitory effects of the samples were tested in vitro on the mycelia growth of Alternaria alternata. The poisoned food technique17,18 was used to test the antifungal activities of the samples. Samples at concentrations of 100, 200, 300, 400 and 500 ppm were used. Petri plates (90 mm dia.), each containing 20 ml of potato dextrose agar (PDA) medium amended to the desired concentrations of the samples, were inoculated with test fungus. A 5 mm diameter disc of the test fungus, cut with a cork borer from the periphery of an actively growing 8 days old culture on a PDA plate, was placed at the center of each treated PDA Petri plate, containing 100, 200, 300, 400 and 500 ppm of the solvent, while a plate without any sample served as a control. The experiments were conducted with three replications. Then, the plates were kept in an incubator at a temperature of 25 ± 1 °C. Fungal growth was observed at every 24 h interval. At the end of the incubation period after 72 h, the minimum inhibitory concentration (MIC) that caused complete inhibition of the mycelia growth was measured. The percentage inhibition of the mycelial growth was calculated from mean values of the colony diameters in the treated and control Petri dishes using the following formula:18
Inhibition% = 100(control − treatment)/control.
The recovery of the product (final product amount) was defined as the weight ratio of the dried product to the initial loadings of polymer and drug. The dried product was dissolved in acetonitrile and sonicated for 5 min, and then distilled water was added to precipitate the polymer preferentially. The drug content in the supernatant after centrifugation (15![[thin space (1/6-em)]](https://www.rsc.org/images/entities/char_2009.gif) 000 for 15 min) was measured spectrophotometrically at the particular λ max for each drug using Ultraviolet spectroscopy (UV). The product recovery, drug loading capacity and encapsulation in the product were calculated using the following equations.19
000 for 15 min) was measured spectrophotometrically at the particular λ max for each drug using Ultraviolet spectroscopy (UV). The product recovery, drug loading capacity and encapsulation in the product were calculated using the following equations.19
3. Results and discussion
3.1. Chemistry
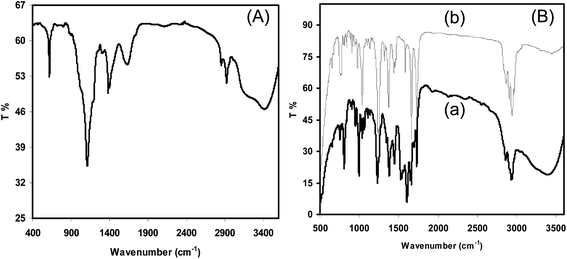
![[double bond, length as m-dash]](https://www.rsc.org/images/entities/char_e001.gif) O in carboxylic acid), 1612 cm−1 appears due to the amide I group (C–O stretching along with N–H deformation mode), the peak at 1560 cm−1 is attributed to the NH2 group due to N–H deformation, 1460 cm−1 is assigned to the symmetrical deformation of CH3 and CH2 group, the peak at 1425 cm−1 is due to C–N axial deformation (amine group band), the peak at 1384 cm−1 is due to the COO– groups in the carboxylic acid salt, 1196 cm−1 is assigned to the special broad peak of the β(1–4) glycoside band in the polysaccharide units, 1108 cm−1 is attributed to the stretching vibration mode of the hydroxyl group, 1020 cm−1 is assigned to the stretching vibration of C–O–C in the glucose ring and the bands at 1060–1015 cm−1 correspond to CH–OH in the cyclic compounds.20,21 The band between 590 and 770 cm−1 appears due to O–C
O in carboxylic acid), 1612 cm−1 appears due to the amide I group (C–O stretching along with N–H deformation mode), the peak at 1560 cm−1 is attributed to the NH2 group due to N–H deformation, 1460 cm−1 is assigned to the symmetrical deformation of CH3 and CH2 group, the peak at 1425 cm−1 is due to C–N axial deformation (amine group band), the peak at 1384 cm−1 is due to the COO– groups in the carboxylic acid salt, 1196 cm−1 is assigned to the special broad peak of the β(1–4) glycoside band in the polysaccharide units, 1108 cm−1 is attributed to the stretching vibration mode of the hydroxyl group, 1020 cm−1 is assigned to the stretching vibration of C–O–C in the glucose ring and the bands at 1060–1015 cm−1 correspond to CH–OH in the cyclic compounds.20,21 The band between 590 and 770 cm−1 appears due to O–C![[double bond, length as m-dash]](https://www.rsc.org/images/entities/char_e001.gif) O in the carboxylic acids because of the preparation of the CH solution using acetate buffer solution. The absorption band at 1650 cm−1 was attributed to the carbonyl groups O
O in the carboxylic acids because of the preparation of the CH solution using acetate buffer solution. The absorption band at 1650 cm−1 was attributed to the carbonyl groups O![[double bond, length as m-dash]](https://www.rsc.org/images/entities/char_e001.gif) C–NHR of chitosan22 and the absorption band at 1599 cm−1 was assigned to the amino groups of chitosan with a high deacetylation degree. This signal shifted to 1528 cm−1 after the conjugation reaction, indicating the formation of imine bonds by condensation of the ketone of 16-DPA with the amino groups of chitosan. A weak shoulder peak occurred at 1738 cm−1 which was assigned to the carbonyl group of the ester bond of CH, as shown in Fig. 2.
C–NHR of chitosan22 and the absorption band at 1599 cm−1 was assigned to the amino groups of chitosan with a high deacetylation degree. This signal shifted to 1528 cm−1 after the conjugation reaction, indicating the formation of imine bonds by condensation of the ketone of 16-DPA with the amino groups of chitosan. A weak shoulder peak occurred at 1738 cm−1 which was assigned to the carbonyl group of the ester bond of CH, as shown in Fig. 2.
The 1H NMR spectrum of chitosan shows chemical shifts of the protons appearing at 4.58 ppm for the acetal proton (–CH) of the glucosamine, 3.01 ppm for –CH–NH2, 3.75 ppm for –CH–OH, 3.59 ppm for –CH2–OH and 1.94 ppm for the acetamido protons (–NH–CO–CH3).
The 13C NMR spectrum of chitosan shows the following chemical shifts: δ (ppm) = 98.3 (C-1), 56.9 (C-2), 70.9 (C-3), 78.0 (C-4), 75.7 (C-5) and 61.4 (C-6).
![[double bond, length as m-dash]](https://www.rsc.org/images/entities/char_e001.gif) O); IR (CHCl3): 2933, 2851, 1732, 1666, 1435, 1245 cm−1.23
O); IR (CHCl3): 2933, 2851, 1732, 1666, 1435, 1245 cm−1.23![[double bond, length as m-dash]](https://www.rsc.org/images/entities/char_e001.gif) N stretching (ketimine); the N–H deformation (NH2) peak is shifted to 1564 cm−1, 1406 cm−1 is assigned to the asymmetric C–H bending of the CH2 groups and 1605 cm−1 is attributed to the CO-bridge stretching of the glucosamine residues.
N stretching (ketimine); the N–H deformation (NH2) peak is shifted to 1564 cm−1, 1406 cm−1 is assigned to the asymmetric C–H bending of the CH2 groups and 1605 cm−1 is attributed to the CO-bridge stretching of the glucosamine residues.The 1H NMR spectrum revealed signals at δ = 3.2 ppm for the –NHCO– groups, at 1.1 ppm for the –NH– groups, 4.6 ppm (s-br, for H-1) for the acetal proton of chitosan and 3.2–3.5 ppm (s-sh, br, H-2, H-3, H-4, H-5 & 6) for the CH2OH groups as well as peaks at 2.4 (s-sh), 1.0 (s, 3H, H-18), 1.3 (s, 3H, H-19), 7.2 (16-vinyl hydrogen), and 4.5 ppm (s, 3H, methyl ketone).
The 13C NMR spectrum of the product shows some new peaks at δ 49.8 (C–N–C), 176.5 (–C![[double bond, length as m-dash]](https://www.rsc.org/images/entities/char_e001.gif) N–, ketimine) and 71.4 ppm (CH2OH) along with the other peaks of the steroid and chitosan parts.
N–, ketimine) and 71.4 ppm (CH2OH) along with the other peaks of the steroid and chitosan parts.
The detailed microstructure of the product CHDPA nanorods was further investigated using TEM. The examination of the amorphous products shows that a great part of the material is in the form of random aggregates24 and the structure, self-aggregation behavior, etc., of CHDPA are shown in the TEM images in Fig. 4a and b. The shapes of CHDPA nanoparticles observed were mostly spherical and cubical. The diameters of the nanoparticles were 300–500 nm.
Nevertheless, abundant intergrowth was observed in the products and the number of isolated well-shaped amorphous particles was limited. The most likely origin of the abundant intergrowth is the presence of nanoparticles, which govern the growth in the system. The TEM images in Fig. 4a and b represent the two types of particles. The domination of the aggregates in the product is in good agreement with the above suggestion. The mass of the aggregated nanoparticles growing into amorphous particles is much higher than that of single bred nuclei. The low number of single isolated structures can be explained by either limited breeding or by the close proximity of the released bred nuclei to the parent aggregate, and thus their development into amorphous particles resulting in complex aggregates. Therefore, the formation of nanoparticles with narrow particle size distribution cannot be expected if the growth in the system is promoted by complex aggregates, even being of nanometric size.
3.2. Biology
The synthesized compound showed a good antifungal activity in general. The data and the experimental photographs are given in Table 1 and Fig. 5(E1)–(E5).| Samples | Concentrations (ppm) | ||||
|---|---|---|---|---|---|
| 100 | 200 | 300 | 400 | 500 | |
| mean ± SD | mean ± SD | mean ± SD | mean ± SD | mean ± SD | |
| CHDPA | 74.7 ± 0.98 | 75.8 ± 0.51 | 78.4 ± 1.57 | 81.0 ± 0.65 | 83.6 ± 0.86 |
| Control | Full growth of the fungus | ||||
 | ||
| Fig. 5 Antifungal activity: C = control, E1–E5 = experimental concentrations of 100, 200, 300, 400 & 500 ppm. | ||
The antifungal activity of the new modified chitosan (CHDPA) was studied against the fungus Colletotrichum gloeosporioides. The inhibitory effects of the samples were tested in vitro on mycelia growth of Colletotrichum gloeosporioides using the poisoned food technique with the five concentrations of 100, 200, 300, 400 and 500 ppm. The data reveal that with increasing the concentration, the inhibition percentage also increases.
3.3. DPA loading capacity (LC), encapsulation efficiency (EE) and DPA release study
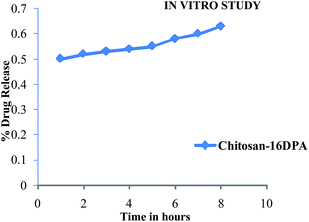
The synthesized product showed a good drug loading capacity (LC), i.e. 23.2%, and encapsulation efficiency (EE), 20.9%, which are given in Table 2. The product also showed a good release behavior, as shown in Fig. 6.| Samples | % | |
|---|---|---|
| Drug loading capacity (LC) | Encapsulation efficiency (EE) | |
| CHDPA | 23.2 | 20.9 |
4. Conclusion
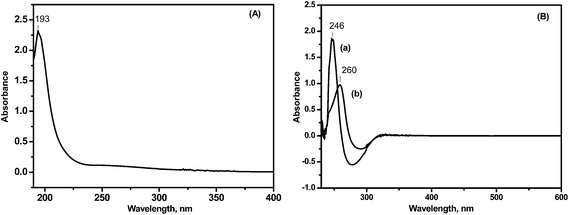
In this contribution, we successfully utilized chitosan, a biocompatible polymer, and a steroid to synthesize linear chitosan–16-DPA nanoparticle aggregates. The chitosan employed herein not only served as the reducing agent and stabilizer, but also led to the assembly of the chitosan–16-DPA nanoparticles. TEM images and UV spectra confirmed the existence of the linear nanoparticle aggregates in solution. One could obtain highly branched long chains and isolated short chains by adjusting the molar ratio of the chitosan repeat unit to 16-DPA. Moreover, the process of growth and assembly for the chitosan–16-DPA nanoparticles was studied using SEM. This method provides a novel way to fabricate linear chitosan–16-DPA nanoparticle aggregates by virtue of its simple one-pot procedure and chain-length tunability. From the analysis results, the compound was found to show a most promising antifungal activity against the fungus Colletotrichum gloeosporioides. The drug loading capacity (LC) was found to be 23.2% and the encapsulation efficiency (EE) was 20.9%. The drug release was investigated using UV spectrophotometry and the study showed good results.Acknowledgements
The authors thank the Director CSIR-North East Institute of Science & Technology, Jorhat, Assam, for providing the facilities and valuable advice, and also gratefully acknowledge the financial support by DST, New Delhi and CSIR, New Delhi, India.References
- N. Liu, X. G. Chen, H. J. Park, C. G. Liu, C. S. Liu and X. H. Meng, Carbohydr. Polym., 2006, 64, 60–65 CrossRef CAS PubMed.
- S. P. Chen, G. Z. Wu and H. Y. Zeng, Carbohydr. Polym., 2005, 60, 33–38 CrossRef CAS PubMed.
- W. L. Du, S. S. Niu, Y. L. Xu, Z. R. Xu and C. L. Fan, Carbohydr. Polym., 2009, 75, 385–389 CrossRef CAS PubMed.
- J. Knapczyk,L. Krowczynski, J. Krzck, M. Brzeski, E. Nirnberg, D. Schenk and H. Struszcyk, Requirements of chitosan for pharmaceutical and biomedical applications, in Chitin and chitosan: sources, chemistry, biochemistry, physical properties and applications, ed. G. Skak-Braek, T. Anthonsen and P. Sandford, Elsevier, London, 1989, pp. 657–663 Search PubMed.
- M. Prabaharan and J. F. Mano, Macromol. Biosci., 2006, 6, 991–1008 CrossRef CAS PubMed.
- M. Prabaharan, M. A. Rodriguez-Perez, J. A. de Saja and J. F. Mano, J. Biomed. Mater. Res., Part B, 2007, 81, 427–434 CrossRef CAS PubMed.
- J. Gong, X. Hu, K. W. Wong, Z. Zheng, L. Yang, W. M. Lau and R. Du, Adv. Mater., 2008, 20, 2111–2115 CrossRef CAS.
- J.-K. F. Suh and H. W. T. Matthew, Biomaterials, 2000, 21, 2589–2598 CrossRef CAS.
- X. Jia, X. Chen, Y. Xu, X. Han and Z. Xu, Carbohydr. Polym., 2009, 78, 323–329 CrossRef CAS PubMed.
- M. N. V. R. Kumar, R. A. A. Muzzarelli, C. Muzzarelli, H. Sahiwa and A. J. Domb, Chem. Rev., 2004, 104, 6017–6084 CrossRef PubMed.
- H. Q. Mao, K. Roy, V. L. Troung-Le, K. A. Janes, K. Y. Lin and Y. Wang, J. Controlled Release, 2001, 70, 399–421 CrossRef CAS.
- W. L. Du, Z. R. Xu, X. Y. Han, Y. L. Xu and Z. G. Miao, J. Hazard. Mater., 2008, 153, 152–156 CrossRef CAS PubMed.
- L. Qi, Z. Xu and M. Chen, Eur. J. Cancer, 2007, 43(1), 184–193 CrossRef CAS PubMed.
- P. J. Chien, F. Seu and F. H. Yang, J. Food Eng., 2007, 78, 225–229 CrossRef CAS PubMed.
- Y. Xu and Y. Du, Int. J. Pharm., 2003, 250, 215–226 CrossRef CAS.
- W. Z. Yang, Q. Q. Zhang, H. L. Chen, X. M. Li, Q. Jiang, M. M. Chen, F. P. Gao, H. Z. Zhang, P. Yi and W. Xiaohong, 7th APCMBE 2008 Proceedings, vol. 19, p. 13 Search PubMed.
- R. K. Grover and J. D. Moore, Sclerotinia fructicola and S. Laxa, Phytopathology, 1962, 52, 876–880 CAS.
- O. N. Ogbebor and A. T. Adekunle, Afr. J. Agric. Res., 2008, 4(1), 19–26 Search PubMed.
- U. M. Dhana lekshmi, G. Poovi, K. Narra and P. Neelakanta Reddy, Int. J. Pharm., 2010, 396, 194–203 CrossRef CAS PubMed.
- K. Biemann, Spectral Data for Structure Determination of Organic Compounds, Springer-Verlag, New York, 2nd edn, 1983 Search PubMed.
- F. Tian, Y. Liu, K. Hu and B. Zhao, J. Mater. Sci., 2003, 38, 4709–4712 CrossRef CAS.
- Z. Osman and A. K. Arof, Electrochim. Acta, 2003, 48, 993–999 CrossRef CAS.
- P. K. Chowdhury, J. M. Borah, P. Goswami and A. M. Das, Steroids, 2011, 76, 497–501 CrossRef CAS PubMed.
- B. Leng, X. Chen, Z. Z. Shao and W. Ming, Small, 2008, 4, 755–758 CrossRef CAS PubMed.
Footnote |
| † Electronic supplementary information (ESI) available. See DOI: 10.1039/c4ra16093b |
| This journal is © The Royal Society of Chemistry 2015 |


