DOI:
10.1039/C4RA16040A
(Paper)
RSC Adv., 2015,
5, 13192-13199
Fluorous solid-phase extraction (F-SPE) as a pilot tool for quantitative determination of perfluorochemicals in water samples coupled with liquid chromatography-tandem mass spectrometry
Received
9th December 2014
, Accepted 9th January 2015
First published on 9th January 2015
Abstract
As a large group of stable existing organofluorine compounds widely present in the environment, perfluorochemicals (PFCs) could pose potential adverse effects on human health. In this study, a selective and sensitive fluorous solid-phase extraction (F-SPE) method coupled with liquid chromatography-tandem mass spectrometry (LC-MS/MS) was developed and validated for quantitative analysis of PFCs. The novel fluorous solid-phase cartridges used in the present work were synthesized, which have a fluorous solid phase being typically silica gel with a fluorocarbon bonded phase (–SiMe2(CH2)2C8F17). As a result of the fluorous–fluorous interaction, F-SPE displayed excellent extraction efficiency for the PFCs, including perfluorohexanoic acid (PFHxA), perfluorooctanoic acid (PFOA), perfluorononanoic acid (PFNA), and perfluorodecanoic acid (PFDA). The method contains 4 steps: preconditioning, sample loading, fluorophobic washing and fluorophilic elution. Meanwhile, the cartridges could be regenerated by thorough washing with tetrahydrofuran (THF) and reused multiple times. The analytes collected from F-SPE were redissolved and injected into the LC-MS/MS system for quantitation afterwards. The separation was performed in negative ion mode using multiple reaction monitoring mode on a Shiseido C18 column (150 × 4.6 mm, 5.0 μm) using methanol and buffer (2 mM ammonium acetate, 0.05% HAc) as mobile phases with a gradient of 80/20 (v/v). The four kinds of PFCs could be eluted within 13 min with analytical recoveries being in the range of 95.3–102.8%. The developed method was applied to determine the concentration of PFCs in tap/river/waste samples collected in Shanghai, China which indicates the prospective value of F-SPE for environmental monitoring and protection.
1. Introduction
Perfluorochemicals (PFCs), represented by perfluorohexanoic acid (PFHxA), perfluorooctanoic acid (PFOA), perfluorononanoic acid (PFNA), and perfluorodecanoic acid (PFDA), are a large series of artificial chemicals manufactured since the 1950s and are widely used in consumer and industrial products nowadays. As a class of emerging persistent organic pollutants (POPs) with strong chemical bond of C–F, perfluorochemicals are employed as surfactants during manufacturing processes and resistant surface protectors for plenty of products such as paper, food containers, leather, carpets, upholstery and fabric because of their water and oil repellency.1–3 Besides, PFCs exhibit unique properties including high surface activity, thermal and chemical stability, photolysis resistance, weak hydrolysis and biodegradability, which may result in their environmental persistence and bio accumulative potential.4–6 With the development of manufacturing industry, PFCs were applied in a worldwide scale and had been detected not only in natural environment samples (air, sediment, drinking water, sea and oceanic water) but in wildlife (fishes, birds and marine mammals) and human (organs and fluids) tissues as well in both industrialized and developing countries.7–11 However, a series of animal trails and epidemiological studies demonstrated that PFCs induce peroxisomal proliferation, hepatomegaly, altered steroidogenesis, developmental and reproductive toxicity, immunotoxicity, body weight loss associated with a wasting syndrome. Furthermore, latest pharmacological research indicated that the immune system is a sensitive target of PFC toxicity and it's also carcinogenic. More recent investigations further suggested that PFOA might suppress antibody production, cause thymic and splenic atrophy, and alter T-cell populations.12 Due to their accumulation toxicity in human tissues, PFCs have also caused wide concern. Consequently, the U.S. Environmental Protection Agency (EPA) formulated guidance levels pertaining to drinking water, which is 0.2 μg L−1 for PFOA; while the European Food Safety Authority (EFSA) set tolerable daily intake (TDI) of PFOA at 1500 ng kg−1 (of body weight) a day.6 So far, there were no legal limits for PFCs in China up to now, to the best of our knowledge. Considering the potential hazards of PFCs to the environment and human health, it is at high priority to develop simple, efficient, and sensitive analytical strategies to monitor trace-level PFCs in different matrices. Pre-concentration is indispensably essential to meet the two important challenges for quantitation of PFCs: multiple interferences from matrices and trace-level concentration of target analytes. Thus, pre-concentration is indispensable essential.
Compared to other main-stream pretreatments such as liquid–liquid extraction (LLE) and liquid–liqiud microextraction (LLME), solid-phase extraction (SPE) is a sample enrichment and purification technology which takes advantage of the affinity of solutes dissolved or suspended in a liquid (mobile phase) for a solid (stationary phase) through which the sample is passed to separate a mixture into desired and undesired components.13–16 For various analytes, different stationary phase materials could be employed according to their physical and chemical properties.
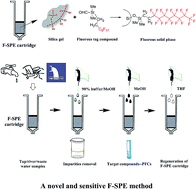
As to PFCs, it is mentioned above that they are organofluorine compounds containing only C–F and C–C bonds with no C–H bonds.17,18 Thus, a creative fluorous solid-phase extraction (F-SPE) cartridge, which is made up of open SPE tubes filled with fluorous sorbents, were produced and investigated in view of the unique properties PFCs may possess. The special sorbents are packed with silica gel containing a perfluorooctylethylsilyl (Si(CH2)2C8F17) bonded phase, which separates compounds based primarily on fluorine content.19–22 Fluorous molecules can be selectively retained while non-fluorous organic compounds will be eluted because of the F–F interactions generated between fluorous silica and PFCs, as illustrated in Scheme 1. The extractive procedure called ‘fluorophobic pass’ contains 4 steps: preconditioning, sample loading, fluorophobic washing and fluorophilic elution. When the crude mixture containing both fluorous and non-fluorous reaction components is charged onto F-SPE cartridges, the sorbent is firstly eluted with a fluorophobic solvent, for example, MeOH–H2O, CH3CN–H2O, DMF–H2O, or DMSO. In this step, non-fluorous compounds typically move at or near the solvent front and elute immediately, while fluorous compounds (like PFCs) are retained on the sorbent. Elution with one of the organic solvents (water-free MeOH or CH3CN) then provides a fluorous fraction containing those compounds bearing the fluorous tag. The eluted analytes could be further enriched and dissolved prior to chromatography analysis.23–27
 |
| Scheme 1 (a) Synthesis route of fluorous sorbent. (b) Extraction and enrichment of PFCs from tap/river/waste water samples employing F-SPE. | |
In this work, a fluorous solid-phase extraction technology was proposed for analyzing four species of PFCs:PFHxA, PFOA, PFNA and PFDA. Meanwhile, for the sake of trace-level quantitation in real samples (typical concentration values are ng mL−1), liquid chromatography coupled with tandem mass spectrometry (LC-MS/MS) with negative electrospray ionization interfaces (ESI(−)) was applied for quantitative determination coupled with F-SPE due to its high detection resolution and sensitivity in complex matrices including plants, fishes, blood, human serum and so on. The procedure of F-SPE was investigated and optimized for diverse parameters, including the category and volume of fluorophobic wash and fluorophilic elution solvents, the volume of loading sample. Simulation and river samples were detected under the selected condition afterwards.
The advantages of F-SPE—high selectivity and sensitivity for fluorine compounds as the special structure of its bonded phase shows high affinity to PFCs—were united with the merits of conventional SPE like rapidness, good recovery, and high enrichment factor to form this proposed technique in this work, which proves to be effective, accurate, easy to operate, general and reliable, and environmental friendly.
In order to explore the feasibility of the developed F-SPE-LC-MS/MS method, it was further applied to the analysis of PFHxA, PFOA, PFNA, and PFDA in real water samples collected in Pudong District, Shanghai, China. Moreover, the novel technique could be further investigated and applied to PFCs' monitoring existed in other complex matrixes or environment.
2. Materials and methods
2.1 Chemicals and reagents
The perfluorohexanoic acid (PFHxA, C6), perfluorooctanoic acid (PFOA, C8), perfluorononanoic acid (PFNA, C9), perfluorodecanoic acid (PFDA, C10) and potassium perfluorooctanesulfonate (PFOS) (internal standard, I.S.) were of analytical grade and supplied by J&K Chemical (Beijing, China). Structures shown in Fig. 1. Purities of all the analytical standards were ≥98.0%. HPLC-grade acetonitrile and methanol were obtained from TEDIA (OH, USA). Glacial acetic acid and ammonium acetate, both in analytical reagent grade, were purchased from Sinopharm Chemical Reagent (Shanghai, China). Water used for HPLC was purified with a Milli-Q plus system (Millipore, Bedford, MA, USA).
 |
| Fig. 1 Structures of PFCs (1: PFHxA; 2: PFOA; 3: PFNA; 4: PFDA; 5: PFOS (internal standard, I.S.)). | |
2.2 Sample collection and preparation
River water, tap water and waste water samples were collected from Sanxing River, domestic water and a manufacturing industry in Zhangjiang High Technology Park (Pudong district, Shanghai) in March 2014, respectively. After being centrifuged (4000 rpm) for 30 min, all water samples were collected into analyte-free glass bottles and filtered through 0.22 μm nylon membranes (Shanghai Institute of Pharmaceutical Industry, China) before F-SPE procedure in order to remove suspended solids. The filtered samples were stored at 4 °C in refrigerator until further extraction.
2.3 Synthesis of fluorous sorbent
The facile synthesis route of fluorous sorbent (fluorous solid phase) is illustrated in Scheme 1(a). Standard silica gel was soaked in 3 mol L−1 HCl solution for 24 h, followed by water-washing until the mixture pH reached 7.0. After dried at 160 °C for 6 h, the gel was stored in dryer. The mixture of activated silica gel, anhydrous methylbenzene and fluorous tag compound (3,3,4,4,5,5,6,6,7,7,8,8,9,9,10,10,10-heptadecafluorodecyldimethylmethoxysilane) was heated and back-flowed at 100–120 °C for 12 h under the protection of nitrogen. Soxhlet extraction method was performed afterwards with methylbenzene as the extraction solvent for another 12 h. The extracts were washed by methylbenzene, acetone, methanol, and acetone in sequence, and dried at 80 °C in vacuum for future use. Technical support of the whole synthesis process was provided by Fluorous Technologies Incorporated.23,26
2.4 Extraction procedure of F-SPE
The F-SPE method consists of 4 steps: preconditioning, sample loading, fluorophobic washing and fluorophilic elution.
500 μL of clear river/tap/waste water samples were spiked with internal standard, PFOS. 1 mL of buffer (2 mM ammonium acetate, 0.05% HAc) was employed to precondition F-SPE cartridges (FluoroFlash® cartridges, 100 mg, 1 mL) with an automatic SPE system (Agilent, USA). After sample loading, F-SPE columns were washed with 1 mL of a mixture of 90% buffer (2 mM ammonium acetate, 0.05% HAc) and 10% methanol by volume, followed by 1 mL methanol to elute the target analytes. The collected eluates were evaporated to nearly dryness under a steady stream of nitrogen at 40 °C. The concentrates were redissolved with 100 μL buffer (2 mM ammonium acetate, 0.05% HAc) and vortexed before analysis. The used cartridges were regenerated by adding 1 mL THF into it for 3 times and could be reused for multiple times (Scheme 1(b)).
2.5 Extraction procedure of conventional SPE
By comparison to the developed F-SPE method for analysis of PFCs, the following conventional SPE method based on the research reported before with few modifications might be less sensitive with unsatisfactory recoveries.15 Water samples were processed according to the SPE procedure described below. The Bond Elut® C18 cartridges (Agilent Technologies) were conditioned with 1 mL of methanol and 1 mL of deionized water. After 500 μL of the water samples loaded on the cartridges and completely drawn through under vacuum, the loaded cartridges were washed with 1 mL of 40% methanol and PFCs were eluted twice with 1 mL methanol. The eluted solutions were evaporated under a nitrogen stream at 40 °C. 50 μL of 50% methanol in aqua was added to reconstitute the samples.
2.6 HPLC-MS/MS analysis
An Agilent 1200 HPLC interfaced with an AB SCIEX 5500 triple-quadruple mass spectrometer was applied to separate the analytes obtained from F-SPE. The separation was performed on a Shiseido C18 column (150 × 4.6 mm, 5.0 μm, Shiseido, Tokyo, Japan) with a Dikma C18 guard cartridge (10 × 4.6 mm, 5.0 μm, Dikma Technologies, Beijing, China) using methanol and buffer (2 mM ammonium acetate, 0.05% HAc) as mobile phases with a gradient of 80/20 (v/v). All separations were performed at a flow rate of 0.5 mL min−1 and a column temperature of 25 °C, resulting in PFCs eluting between 3 and 13 min.
The mass spectrometer was equipped with an electrospray ionization (ESI) source, operating in negative ion mode with a capillary voltage of 1000 eV, 30 psi N2 sheath gas, and capillary temperature of 500 °C. The preferred mass transitions of the four analytes were monitored using multiple reaction monitoring (MRM). Analytes were quantified using the transition listed in Table 1. The method was validated for parameters including linearity, analytical limits, accuracy and recovery.
Table 1 MS/MS quantitative transitions and collision energies for PFCs
PFCs |
Retention time (min) |
Parent ion Q1 |
Daughter ion Q3 |
Declustering potential (V) |
Collision energy (V) |
IS used |
PFHxA |
4.34 |
313.1 |
269.1 |
−50 |
−15 |
PFOS |
PFOA |
5.97 |
413.0 |
369.2 |
−60 |
−15 |
PFOS |
PFNA |
7.47 |
463.0 |
219.0 |
−50 |
−15 |
PFOS |
PFDA |
9.77 |
513.2 |
469.2 |
−50 |
−18 |
PFOS |
PFOS |
7.18 |
499.6 |
99.0 |
−65 |
−90 |
— |
2.7 Calibration standards and quantification
A 10 μg mL−1 stock solution of four kinds of PFCs was prepared in buffer (2 mM ammonium acetate, 0.05% HAc). Utilizing this stock solution, calibration standards were produced (2.0, 5.0, 10.0, 20.0, and 50.0 ng mL−1), adding internal standard (to reach 1 μg mL−1 in the final solution), and then were processing through the sample cleanup and concentration procedure.
Calibration standards (2.0–50.0 ng mL−1) were analyzed daily prior to and throughout analysis of sample sets. Calibration curves were prepared by plotting the nonweighted simple linear regression of the area ratio (analyte: internal standard) versus analyte concentration (R2 values of 0.99 for all analytes). All of the peak integration and mass spectrometry data processing was performed with AB SCIEX Analyst Software (Version 1.6, AB SCIEX). PFC concentration in each test portion was calculated from the equation of the line of the standard curves analyzed with the set. Microsoft Office 2013(Microsoft Corp., Redmond, WA) was used for all additional data processing.
3. Results and discussion
3.1 Validation of F-SPE cartridges
In this part, four aspects: maximum loading volume, repeatability and stability, recycle use and sensitivity of enrichment, had been validated for the performance testing of the as-made F-SPE cartridges before putting into use.
Maximum loading volume was first to be investigated. Water samples with different volume were loaded onto the cartridge followed by the remaining steps in Section 2.4. As shown in Fig. 2A, the curve of sample concentration to solvent volume trended to get smooth with the increase of loading volume, which implied the fluorous sorbents packed on cartridge were saturated when the loading volume of sample reached 500 μL.
 |
| Fig. 2 Parameters influence extraction efficiency. (A) Maximum loading sample volume experiment. (B) Preconditioning solvents (MeOH, 80% MeOH, ACN, water and buffer). (C) Fluorophobic wash solvents (MeOH, ACN, buffer/MeOH = 9/1, 1/4 and 3/1, v/v). (D) Fluorophilic elution solvents (THF, ACN and MeOH). | |
Ten F-SPE cartridges were applied to verify repeatability and stability. Following the procedure in Scheme 1(b), relative standard deviations (RSDs) for these 10 cartridges were below 3.4%, suggesting desired repeatability of this fluorous sorbent was achieved.
To investigate whether F-SPE cartridges could be recycled and reused for PFCs enrichment, the used cartridges were regenerated by washing with THF three times. The same regenerated F-SPE cartridge was reused to enrich a simulation sample of PFOA (100 pg mL−1) for another three times. The peak areas of PFOA achieved were almost the same to that of the first time with ultra-low RSD (≤2.8%), which proved that the fluorous sorbent could be recycled and reused for PFCs enrichment. At the same time, THF may be a good choice for regeneration of F-SPE cartridges.
To evaluate the sensitivity of enrichment of PFCs with F-SPE, a simulation sample of PFOA with a low concentration (100 pg mL−1) was measured. After enrichment by F-SPE method, the S/N ratio of PFOA was significantly improved (S/N = 15), leading to a sensitive detection of PFOA with an interference-low background. The high selectivity and sensitivity of this method may probably be attributed to the F–F interactions generated between fluorous silica and PFCs, despite whether the polarity of molecules is strong or weak.
3.2 F-SPE procedure optimization
3.2.1 Preparation work before extraction procedure. Taken the wide applications of PFCs in various industrial products as surfactants into consideration, the experimental apparatus involved in this work such as sample bottles, glassware, solvents may probably contain PFCs at a low level. To avoid these contaminations and interferences, plastic products were forbidden throughout the experiment and all glassware employed in this study was extensively cleaned using solvents in sequence, i.e. water, methanol, tetrahydrofuran and then again methanol. Also frits and F-SPE cartridges were pre-cleaned by sonication with methanol in an ultrasonic bath twice for 5 min each. Moreover, all the solvents were carefully checked to be analyte-free before being utilized.
3.2.2 Extraction technique. There were 4 steps in the utilized F-SPE procedure: preconditioning, sample loading, fluorophobic washing and fluorophilic elution. Different solvents were optimized in each step for specific purpose according to the characteristics of F-SPE cartridges and the properties of the analytes.
3.2.2.1 Selection of preconditioning solvent. As for preconditioning, methanol, 80% methanol with water, acetonitrile, pure water and buffer (2 mM ammonium acetate with 0.05% HAc) were investigated, and it turned out that the buffer had fewer interfaces to the analysis with much higher extraction efficiency (Fig. 2B), which was selected in the following experiments.
3.2.2.2 Investigation of fluorophobic wash solvent. Different solvents, such as MeOH, ACN, and mixed solvents with water for fluorophobic wash were studied for the sake of reducing distractions of non-fluorous compounds. Remaining solutions of each were collected and analyzed by LC-MS/MS. Fig. 2C showed that a mixture of 90% buffer (2 mM ammonium acetate, 0.05% HAc) and 10% methanol by volume was finally chosen as it performed fewer PFCs being detected than the others.
3.2.2.3 Study of fluorophilic elution solvent. It is extremely important for the selection of fluorophilic elution solvent in this SPE procedure. Three organic solvents including methanol, acetonitrile and tetrahydrofuran were tried for improving the extraction efficiency of PFCs. As depicted in Fig. 2D, MeOH was optimized as the fluorophilic wash solvent for its low cost and toxicity compared with acetonitrile or THF. The influence of elution times was studied as well; 1000 μL MeOH by one time, 500 μL MeOH by 2 times and 200 μL MeOH by 5 times had been tested. The results indicated that when the elution times added, the extraction efficiency would increase as well. Therefore, 200 μL MeOH by 5 times was chosen as the final elution solvent.
3.3 LC-MS/MS analysis
3.3.1 Method optimization. As seen from the structures shown in Fig. 1, the five analytes have similar polarity. Considering the previous research, gradient elution was utilized, and different compositions of the mobile phase were also investigated. Mobile phase A consisting of 2 mM ammonium acetate with 0.05% v/v HAc and mobile phase B consisting of 100% methanol was finally selected as the preferred mobile phase with a gradient of 80/20 (v/v), which produced the desired separation and acceptable tailing factors within the 13 min running time. Fig. 3 showed a typical total ion current chromatogram for a spiked PFCs sample (50 ng mL−1).
 |
| Fig. 3 F-SPE-LC-MS/MS chromatograms spiked with 50 ng mL−1 PFCs. | |
In consideration of the physicochemical properties of PFHxA, PFOA, PFNA and PFDA together with the internal standard, PFOS including acidity, polarity and electronegativity, negative ESI interface was preferentially chosen as the ion source for ionization. The deprotonated molecules of 4 analytes and PFOS were selected as the precursor ions. Table 1 showed the MRM transitions used for the quantification of the analytes. The daughter ion of PFHxA, PFOA, PFNA and PFDA with the m/z value of 269.1, 369.2, 219.0 and 469.2 were generated via the decarboxylation process of the parent ion of PFHxA, PFOA, PFNA and PFDA, respectively. The probable fragmental pathways for these four perfluorinated carboxylates in mass spectrometry are [M − H]− → [M − CO2 − H]− while [C8F17SO3]− → [FSO3]− (m/z 499.6 → 99.0) for the internal standard, PFOS.
3.3.2 Method validation. Matrix effect, the possible suppression or enhancement of ionization induced by the endogenous substances, was assessed by comparing the peak areas of standards spiked after post-extraction matrix with standards in the pure solution. Recovery and matrix effect results were shown in Table 2, which indicated the selective extraction using F-SPE was satisfactory. The proposed method was able to reduce the matrix effect and achieve good LOD and LOQ signal intensity.
Table 2 Validation parameters of the determination of PFCs
PFCs |
PFOA |
PFDA |
PFNA |
PFHxA |
Linear range (ng mL−1) |
2–50 |
2–50 |
2–50 |
2–50 |
Calibration curve (n = 5) |
Y = 0.0519X − 0.1305 |
Y = 0.0029X − 0.0054 |
Y = 0.0092X − 0.0372 |
Y = 1.3247X − 0.0902 |
Coefficient of determination (r2) |
0.9987 |
0.9934 |
0.9916 |
0.9987 |
LOD (ng mL−1) |
0.31 |
1.67 |
0.16 |
0.02 |
LOQ (ng mL−1) |
1.03 |
5.56 |
0.52 |
0.05 |
Matrix effect (%) |
Low |
96.9 |
96.7 |
99.0 |
92.0 |
Medium |
101.8 |
97.5 |
96.2 |
92.0 |
High |
95.4 |
103.8 |
99.6 |
98.9 |
Recovery (%) |
Low |
99.4 |
102.8 |
96.3 |
100.7 |
Medium |
102.0 |
100.8 |
102.6 |
95.3 |
High |
100.6 |
96.6 |
99.0 |
95.6 |
RSD (%) (n = 3) |
4.7 |
9.2 |
6.3 |
4.8 |
The LC-MS/MS chromatograms (MRM mode) of the spiked PFCs samples were shown in Fig. 3. Under the extracting conditions, a series of experiments with regard to the linearity, limit of detection (LOD), and precision were performed to validate the proposed method. (Table 2) The calibration curves were linear over one order of magnitude for all analytes, with coefficient of determination (r2) ranging from 0.9916 to 0.9987. The limit of detection (LOD) and the limit of quantification (LOQ) are calculated as the concentrations of the analytes at a signal-to-noise ratio (S/N) of 3 and 10, respectively. The results showed that the LOD and LOQ values of the PFCs range from 0.02 to 1.67 ng mL−1 and 0.05 to 5.56 ng mL−1, respectively. The relative standard deviations (RSDs) for the PFCs were below 9.2%, illustrating the good repeatability achieved by the suggested procedure. These results implied that the proposed method could be applied to the analysis of real samples containing PFCs at trace level.
3.4 Application of the proposed F-SPE method to the real water samples
The F-SPE method was applied to analyze tap water, river water and waste water samples under optimized conditions. Only 1.30 ng PFOA was detected in the river samples, while none of the other three kinds of PFCs were detected in river water samples. Waste water samples contained all kinds of these four analyzed PFCs (Table 3). It turned out to be no PFC contained in tap water samples as expected. Trace PFOA being detected in river water samples may origin from the manufacturing industries around the river on both sides. As far as we know, these industries, including the one where we get waste water samples, all own factories producing food containers or medicine packages, which could be one of these broad applications of perfluorochemicals. The existence of PFCs in waste water samples and river water samples implies that these potential organic pollutants are widespread in people's daily life, and will endanger the environment and human health. Further research should be carried on and the established F-SPE method posts a vast development prospect in the analysis of PFCs at trace level in real samples.
Table 3 Detected concentrations (ng mL−1) in analysis of PFCs in real water samples obtained by the proposed F-SPE method and the traditional SPE method (n = 3)
Samples |
Tap water |
River water |
Waste water |
Tap water |
River water |
Waste water |
F-SPE |
Conventional SPE |
ND: Not detected. |
PFOA |
NDa |
1.30 ± 0.21 |
344.87 ± 3.67 |
ND |
ND |
316.30 ± 4.32 |
PFDA |
ND |
ND |
123.83 ± 2.39 |
ND |
ND |
108.57 ± 1.98 |
PFNA |
ND |
ND |
7.89 ± 0.65 |
ND |
ND |
9.08 ± 0.44 |
PFHxA |
ND |
ND |
22.64 ± 1.20 |
ND |
ND |
14.36 ± 0.89 |
3.5 Comparison with other methods
To illustrate the advantages of F-SPE as a novel extraction tool, the comparison of our developed method with other reported sample preparation procedures is performed. As presented in Table 2, the recoveries of the proposed method were ranged from 95.3% to 102.8% with RSD between 4% and 10%. These values, which reflect the good sensitivity and precision, are substantially superior to those achieved with the commercial Waters Oasis HLB SPE extraction columns and mixed hemimicelle-based SPE method reported in other papers, which range from 73% to 88%, 57% to 105% with RSD between 8% and 12%, 2% and 8%, respectively.15,22
Besides the comparisons with references, conventional SPE method was also developed in this work. Followed by the extraction steps stated in section 2.5, tap water, river water and waste water samples were analyzed under optimized conditions (see Table 3). For tap water and river water samples, it's obvious to discover that F-SPE share similar results with conventional SPE in the determination of these three types of water samples, except no PFOA was found in river water samples via conventional SPE, while F-SPE method detected PFOA at nanogram levels. But in waste water samples, it showed significant differences between these two methods. The concentrations of PFOA, PFDA and PFHxA treated via F-SPE raised about 10–50% compared to those extracted by conventional SPE.
This may possibly due to the sorbent of conventional SPE cartridges is octadecyl bonded-silica gel (C18), which separates compounds mainly according to their polarity. During the procedure of SPE, interactions between non-polar forces play a key role between C18 sorbent and the analytes, which means the weaker the polarity of the analytes shows, the firmer the non-polar force it forms. PFOA and PFHxA are PFCs with short carbon chains, that is to say, they are compounds with strong polarity which are very difficult to be retained on the C18 cartridges, compared with PFNA and PFDA. Thus, applying F-SPE method—which separates compounds based primarily on fluorine content—may likely be much more sensitive, selective, effective and reliable in the analysis of PFCs in water samples.
4. Conclusion
In this study, a new type of fluorous sorbent with both good extraction efficiency and high affinity were synthesized through a facile one-step strategy and were successfully applied in the extraction and determination of perfluorochemicals in tap water, river water and waste water samples, coupled with LC-MS/MS detection. The developed analytical F-SPE-LC-MS/MS method was proven suitable for determination of four perfluorochemicals in water samples. Thanks to the optimized operation, less solvent consumption and the high extraction efficiency, the process of F-SPE extraction could be accomplished within 13 min. Moreover, cartridges could be regenerated through thorough wash of THF. Compared with conventional SPE method, F-SPE technique with high sensitivity and selectivity is much more adaptable for fishing fluorous molecules out of the pool of predominantly non-fluorous organic compounds in the analysis of real water samples. The results indicated that the pilot technique can be further developed and applied to many other complicated matrixes which may also contain perfluorochemicals and other similar structure compounds.
References
- M. D. Malinsky, C. B. Jacoby and W. K. Reagen, Anal. Chim. Acta, 2011, 683, 248–257 CrossRef CAS PubMed.
- W. M. Young, P. South, T. H. Begley and G. O. Noonan, J. Agric. Food Chem., 2013, 61, 11166–11172 CrossRef CAS PubMed.
- D. O'Hagan, J. Fluorine Chem., 2010, 131, 1071–1081 CrossRef PubMed.
- K. Wille, J. Vanden Bussche, H. Noppe, E. De Wulf, P. Van Caeter, C. R. Janssen, H. F. De Brabander and L. Vanhaecke, J. Chromatogr. A, 2010, 1217, 6616–6622 CrossRef CAS PubMed.
- N. Luque, A. Ballesteros-Gomez, S. van Leeuwen and S. Rubio, J. Chromatogr. A, 2010, 1217, 3774–3782 CrossRef CAS PubMed.
- A. L. Capriotti, C. Cavaliere, A. Cavazzini, P. Foglia, A. Lagana, S. Piovesana and R. Samperi, J. Chromatogr. A, 2013, 1319, 72–79 CrossRef CAS PubMed.
- G. Lindstrom, A. Karrman and B. van Bavel, J. Chromatogr. A, 2009, 1216, 394–400 CrossRef PubMed.
- C. L. Tseng, L. L. Liu, C. M. Chen and W. H. Ding, J. Chromatogr. A, 2006, 1105, 119–126 CrossRef CAS PubMed.
- A. D. Delinsky, M. J. Strynar, S. F. Nakayama, J. L. Varns, X. Ye, P. J. McCann and A. B. Lindstrom, Environ. Res., 2009, 109, 975–984 CrossRef CAS PubMed.
- S. P. van Leeuwen, C. P. Swart, I. van der Veen and J. de Boer, J. Chromatogr. A, 2009, 1216, 401–409 CrossRef CAS PubMed.
- L. S. Haug, C. Thomsen and G. Becher, J. Chromatogr. A, 2009, 1216, 385–393 CrossRef CAS PubMed.
- E. Corsini, E. Sangiovanni, A. Avogadro, V. Galbiati, B. Viviani, M. Marinovich, C. L. Galli, M. Dell'Agli and D. R. Germolec, Toxicol. Appl. Pharmacol., 2012, 258, 248–255 CrossRef CAS PubMed.
- I. Zabaleta, E. Bizkarguenaga, A. Iparragirre, P. Navarro, A. Prieto, L. A. Fernandez and O. Zuloaga, J. Chromatogr. A, 2014, 1331, 27–37 CrossRef CAS PubMed.
- C. Tang, J. Tan, C. Wang and X. Peng, J. Chromatogr. A, 2014, 1341, 50–56 CrossRef CAS PubMed.
- J. Teng, S. Tang and S. Ou, Microchem. J., 2009, 93, 55–59 CrossRef CAS PubMed.
- M. Llorca, M. Farre, Y. Pico and D. Barcelo, J. Chromatogr. A, 2009, 1216, 7195–7204 CrossRef CAS PubMed.
- L. W. Yeung, Y. Miyake, Y. Wang, S. Taniyasu, N. Yamashita and P. K. Lam, Environ. Pollut., 2009, 157, 17–23 CrossRef CAS PubMed.
- Y. Miyake, N. Yamashita, P. Rostkowski, M. K. So, S. Taniyasu, P. K. Lam and K. Kannan, J. Chromatogr. A, 2007, 1143, 98–104 CrossRef CAS PubMed.
- B. Gourdet, K. Singh, A. M. Stuart and J. A. Vidal, J. Fluorine Chem., 2010, 131, 1133–1143 CrossRef CAS PubMed.
- G. Hu, J. S. Lee and D. Li, J. Colloid Interface Sci., 2006, 301, 697–702 CrossRef CAS PubMed.
- V. A. Bailey, D. Clarke and A. Routledge, J. Fluorine Chem., 2010, 131, 691–697 CrossRef CAS PubMed.
- X. Zhao, J. Li, Y. Shi, Y. Cai, S. Mou and G. Jiang, J. Chromatogr. A, 2007, 1154, 52–59 CrossRef CAS PubMed.
- D. P. Curran, J. Fluorine Chem., 2008, 129, 898–902 CrossRef CAS PubMed.
- X. Liu, Y. Yu, Y. Li, S. Ning, T. Liu, F. Li and G. Duan, Talanta, 2013, 106, 321–327 CrossRef CAS PubMed.
- X. Liu, Y. Yu, M. Zhao, H. Zhang, Y. Li and G. Duan, Food Chem., 2014, 150, 206–212 CrossRef CAS PubMed.
- W. Zhang and D. P. Curran, Tetrahedron, 2006, 62, 11837–11865 CrossRef CAS PubMed.
- X. Zhao, Y. Cai, F. Wu, Y. Pan, H. Liao and B. Xu, Microchem. J., 2011, 98, 207–214 CrossRef CAS PubMed.
Footnote |
† These two authors contributed equally to this work. |
|
This journal is © The Royal Society of Chemistry 2015 |
Click here to see how this site uses Cookies. View our privacy policy here.