DOI:
10.1039/C4RA16017G
(Paper)
RSC Adv., 2015,
5, 19844-19852
Interspecies prediction of oral pharmacokinetics of different lacidipine formulations from dogs to human: physiologically based pharmacokinetic modelling combined with biorelevant dissolution
Received
9th December 2014
, Accepted 11th February 2015
First published on 12th February 2015
Abstract
The aim of the present study was to use physiologically based pharmacokinetic (PBPK) modelling combined with biorelevant dissolution to quantitatively predict dog oral drug pharmacokinetic (PK) of different formulations, and to make an interspecies extrapolation to human. Lacidipine, a typical BCS class II drug, was chosen as a model drug. The three lacidipine formulations involved were immediate release tablets including two commercial products and one self-made micronized tablets. First of all, the PBPK models in rat and dog after intravenous administration of lacidipine solutions and oral administration of lacidipine suspensions were developed and validated based on physicochemical properties and the literature data, which were used to verify the accuracy of the PBPK model in prediction drug PK in animals. The solubility and dissolution behaviour of lacidipine formulations were determined in the media simulating the fasted state intestinal fluid of human (FaSSIF/FaSSIF-V2). Then the Z-factor values obtained by fitting the dissolution profiles of the three formulations were utilized to evaluate the effect of in vitro dissolution behaviours on PK performance. At last, the verified PBPK model in dog was extrapolated to predict human PK of the three formulations. The results showed that PBPK models from dog to human were successfully developed. By integrating biorelevant dissolution with PBPK model, it is achievable to quantitatively and accurately predict the plasma concentration–time profiles for various formulations after oral administration.
1. Introduction
The Biopharmaceutical Classification System (BCS) categorizes drugs into 4 groups based on their solubility and intestinal membrane permeability.1 For BCS class II drugs with low solubility and high permeability, the absorption is limited by in vivo dissolution behaviour.2 Therefore, in vitro dissolution condition which can simulate in vivo dissolution circumstance is critical to predict in vivo pharmacokinetic (PK) performance for oral formulations of BCS class II drugs.3 Biorelevant media, which are adapted to simulate gastrointestinal (GI) fluids in terms of pH, buffer capacity, osmolality as well as bile salt and phospholipid concentration,4,5 have been proven to provide improvement in the establishment of in vitro–in vivo correlation (IVIVC) for BCS class II drugs and play an important role in the formulation development.6
However, the in vitro dissolution tests can provide qualitative PK information of drug products instead of quantitative prediction, since lots of biological or physiological factors have a significant impact on drug bioavailability.7 Thus the combination of the properties of drug products and physiological model will be desirable. Physiologically based pharmacokinetic (PBPK) modelling is such a widely used mechanistic tool to predict the PK of drug products.
PBPK model is a mathematical model that integrates anatomical and physiological parameters of the body, physicochemical properties of drug and formulation properties of drug products to predict in vivo absorption, distribution, metabolism and excretion (ADME).8–10 Physiologically based absorption models, which emphasize understanding and predicting the drug fate in the GI tract, can be connected to the distribution and clearance model to predict in vivo PK profiles.11 A semi-physiological absorption model, the Advanced Compartmental Absorption and Transit (ACAT) model, has been widely used to predict the rate and extent of oral absorption.12 For the disposition model, the drug-independent physiological data and the drug-specific biochemical parameters (e.g., clearance and distribution volume) are needed. ACAT model serves as a time-dependent input function to the disposition model.13 Then the overall in vivo fate of drugs can thereby be simulated and the accurate prediction of PK is achievable.
To optimize the formulation screening, there has been a growing demand to predict human PK. Accurate prediction of human PK would effectively reduce clinical failure of drug formulations.14 It would be desirable if in vitro results and pre-clinical animal studies can be utilized to extrapolate to human based on the properties of drug formulations and the biological systems.15 It is reported that PBPK model is superior to other empirical methods for interspecies scaling and prediction of human PK.16,17 Thus, a typical BCS class II drug, lacidipine, was chosen as a model drug in this study. PBPK modelling combined with biorelevant dissolution was exploited to quantitatively predict dog in vivo plasma concentration–time curves of three lacidipine formulations, and to make an interspecies extrapolation to human.
2. Experiment
2.1 Materials
Lacidipine was obtained from Kangya of NingXia Pharmaceuticals Co. Ltd. (Ningxia, China). Sodium taurocholate was purchased from Beijing Aoboxing Biotech Co. Ltd. (Beijing, China). Egg phosphatidylcholine was purchased from Lipoid GmbH (Germany). Tween 20, sodium hydroxide pellets, hydrochloric acid, sodium chloride, sodium dihydrogen phosphate monohydrate, and maleic acid were all of analytical grade and purchased from Tianjin Bodi Chemical Holding Co. Ltd. (Tianjin, China). Methanol was of chromatographic grade. Deionized-distilled water was used throughout the study.
2.2 Formulations
Three formulations of lacidipine were involved in this study. The two commercial formulations of lacidipine were formulation A LACIPIL® 4 mg tablet (GlaxoSmithKline, England) and formulation B Sileping™ 4 mg tablet (Harbin Pharmaceutical Group Sanchine Corporation, Harbin, China). Formulation C was lacidipine micronized tablet which was prepared by a wet granulation compression method after micronizing the APIs with air-flow crushing by jet mill.
2.3 Media preparation
The 1% Tween 20 solution, which is specified in the British Pharmacopoeia (BP 2012), was prepared by mixing 100 mL of water with 10 mL of Tween 20 and then shaking gently and diluting to 1000 mL. The compositions of blank FaSSIF, FaSSIF4 and the updated versions of FaSSIF (FaSSIF-V2)18 were summarized in Table 1. The preparation procedures of the biorelevant media were performed as the literatures described. These biorelevant media were prepared before use.
Table 1 Compositions of blank FaSSIF, FaSSIF and FaSSIF-V2
| Composition |
Blank FaSSIF |
FaSSIF |
FaSSIF-V2 |
| Sodium taurocholate (mM) |
— |
3 |
3 |
| Lecithin (mM) |
— |
0.75 |
0.2 |
| Maleic acid (mM) |
— |
— |
19.12 |
| NaH2PO4 (mM) |
14.33 |
14.33 |
— |
| NaCl (mM) |
52.87 |
52.87 |
68.62 |
| NaOH (mM) |
4.35 |
4.35 |
34.8 |
| pH |
6.5 |
6.5 |
6.5 |
2.4 Determination of equilibrium solubility
The equilibrium solubility of lacidipine was determined in pH 6.5 blank FaSSIF, FaSSIF, and FaSSIF-V2 by shake-flask method. Excess amount of drug powder (n = 3) was added into the conical flasks containing 20 mL of different media and shaken at 100 rpm for 24 h at 37 °C. The supernatant was filtered through a 0.22 μm filter. The withdrawn samples were filtered, diluted properly and assayed by HPLC.
2.5 In vitro dissolution tests
Dissolution tests were carried out using the USP Apparatus 2 (Paddle) setup (ZRS-8G; TIANDA TIANFA Technology Co., Ltd, Tianjin, China) with rotational speed of 50 rpm. Dissolution media were degassed before the dissolution tests proceeded and equilibrated at 37 °C. Each vessel was filled with 500 mL of media. Samples were withdrawn at 5, 10, 20, 30, 45, and 60 min. Dissolution in each medium was carried out in triplicate (n = 3). At predetermined time intervals, 10 mL of samples were withdrawn and immediately filtered through 0.45 μm filters, and 10 mL of fresh medium were replaced. Withdrawn samples were analyzed by the HPLC method.
2.6 Z-factor dissolution modelling
The Nernst–Brunner model (eqn (1)) is a classical dissolution model and can adequately model the dissolution of drug particles in the aqueous solution. However, the surfactants which are often added to the dissolution media for poorly water-soluble drugs, have an impact on the diffusion coefficient. To incorporate this effect, this model is modified as the Z-factor dissolution model (eqn (2)).19 Here, the Z-factor is defined as eqn (3). It is a formulation-dependent parameter and the value is obtained by fitting to the in vitro dissolution profiles. The Z-factor model was selected to correlate the dissolution profiles to in vivo PK for different formulations.| |
 | (1) |
| |
 | (2) |
| |
 | (3) |
where Dw is the diffusion coefficient, S(t) the surface area at time t, h(t) the apparent diffusion layer thickness at time t, Cs is the solubility in the lumen compartment, Cl is the drug concentration in the lumen compartment, ρ is the density of the dissolving drug particles, rt is the spherical particle radius of particles in the compartment, and Mu and MD are the undissolved and dissolved amount of drug, respectively.
2.7 Data collection and in vivo dog PK study
The dog in vivo data of formulation A has been reported by two literature references.20,21 Comparing two sets of data, there is almost 1.6 fold difference in the values of Cmax and AUC. To incorporate the individual difference, the average of two sets of data was used as the observed in vivo values of formulation A. The observed in vivo data of formulation B was also collected from literature reference.20 In this study, the dog PK study for formulation C was performed. The in vivo study was conducted with ethical permission which was permitted by Ethical Committee in China and was processed in accordance with the Guide for the Care and Use of Laboratory Animals. These beagle dogs weighing about 10 kg were fasted for about 12 h prior to experiments, and were given water freely. The detection method of ultra performance liquid chromatography-dual mass spectrometry (UPLC-MS/MS) for lacidipine plasma concentrations was the same as the literature reported.20
2.8 PBPK modelling
2.8.1 ACAT model to predict the rate and extent of oral absorption. ACAT model is a physiologically based transit and absorption model consisting of nine compartments corresponding to the segments of the GI tract from the stomach to colon. This model uses a series of differential equations to model the kinetic processes of dissolution, degradation, metabolism, and absorption as the drug transits through the different segments of the GI tract.22
2.8.2 Clearance (CL). An important drug-specific parameter required for PBPK modelling is CL. Lacidipine is mainly eliminated by hepatic metabolism, and renal clearance can be negligible.23 In this study, the rate of hepatic metabolism in rat and dog is taken from publications,24 and human CL (CLhuman) is predicted by allometric scaling equation as below:| |
 | (4) |
where CLdog is the clearance of dog, Weightdog and Weighthuman are the body weights of dog and human, respectively.
2.8.3 The volume of distribution at steady state (Vss). The development of tissue composition equations for the prediction of tissue to plasma coefficients (Kp) and distribution in animal and human facilitates the application of PBPK models.25–30 The main drug-specific input parameters are the pKa, log![[thin space (1/6-em)]](https://www.rsc.org/images/entities/char_2009.gif) P/log
P/log![[thin space (1/6-em)]](https://www.rsc.org/images/entities/char_2009.gif) D, blood to plasma partitioning and unbound percent in plasma Fup (Table 2) to mechanically predict in vivo distribution. The volume of distribution at steady state (Vss) in different species (rat, dog and human) is calculated by GastroPlus defaulted equations, according to drug's biopharmaceutical parameters and PBPK model.
D, blood to plasma partitioning and unbound percent in plasma Fup (Table 2) to mechanically predict in vivo distribution. The volume of distribution at steady state (Vss) in different species (rat, dog and human) is calculated by GastroPlus defaulted equations, according to drug's biopharmaceutical parameters and PBPK model.| | |
Vss = Vp + Ve × E/P + ∑Vt × Kpt × (1 − ERt)
| (5) |
where Vp is the volume of plasma, Ve is the erythrocyte volume, E/P is the erythrocyte to plasma concentration ratio (calculated from blood/plasma concentration ratio and hematocrit), Vt is tissue volume, Kpt is the tissue to plasma partition coefficient, and ERt is the extraction ratio for a given tissue.
Table 2 The basic modelling parameters of lacidipine
| Parameters |
Value |
| Predicted by ADMET Predictor (Version 7.1.0003, Simulations Plus, Inc., Lancaster, CA, USA). Experimental value. Default GastroPlus™. Calculated by GastroPlus™. Literature value.24,31,32 |
| Molecular weight (g mol−1) |
455.55 |
log![[thin space (1/6-em)]](https://www.rsc.org/images/entities/char_2009.gif) P P |
5.51a |
| pKa |
2.5a |
| Solubility (mg mL−1) |
5.0 × 10⁻⁵ in pH 6.5 blank FaSSIF;b 4.56 × 10⁻³ in FaSSIF;b 2.0 × 10⁻³ in FaSSIF-V2b |
| Human permeability (Peff, cm s−1 × 10⁴) |
2.45a |
| Mean precipitation time (s) |
900c |
| Particle density (g mL−1) |
1.2c |
| Diffusion coefficient (cm2 s−1 × 10⁵) |
0.56d |
| Particle size (μm) |
8.7 μm for the micronized formulation;b 25 μm for the commercial formulationsc |
| Clearance (CL, L h−1) |
Rat: 0.38;e dog: 9.6;e human: 46.5d |
| Volume of distribution at steady state (Vss, L) |
Rat: 1.87;d dog: 159.45;d human: 1176.55d |
| T1/2 (h) |
Rat: 3.45;d dog: 11.5;d human: 17.5d |
| Blood/plasma concentration ratio |
0.63a |
| Unbound percent in plasma (Fup, %) |
5e |
2.8.4 PBPK modelling in rat and dog based on the literature data. All the in vivo PK simulations were carried out on the PBPK modelling commercial software GastroPlus (Version 8.6.0003, Simulations Plus, Inc., Lancaster, CA, USA). The parameters needed to import into the PBPK model include formulation properties (such as drug particle size distribution), physicochemical properties (such as solubility, pKa, log![[thin space (1/6-em)]](https://www.rsc.org/images/entities/char_2009.gif) P, and permeability), and PK parameters (such as elimination half-life, clearance, volume of distribution). All these parameters (Table 2) for the simulation are experimentally determined, in silico predicted or collected from the literature. The human effective permeability (Peff) was estimated by GastroPlus model on the basis of lacidipine structure. With this software, human Peff can be converted to an estimated Peff in rat and dog based on defaulted equations. The rat and dog in vivo data of lacidipine after intravenous bolus administration of lacidipine solution and oral administration of lacidipine suspension were collected from literature reference.24 With the drug physicochemical properties and PK parameters predicted or collected from literature references, the PK profiles for lacidipine after intravenous and oral administration in rat and dog were obtained and then were used to validate the built base PBPK model by comparing with the observed.
P, and permeability), and PK parameters (such as elimination half-life, clearance, volume of distribution). All these parameters (Table 2) for the simulation are experimentally determined, in silico predicted or collected from the literature. The human effective permeability (Peff) was estimated by GastroPlus model on the basis of lacidipine structure. With this software, human Peff can be converted to an estimated Peff in rat and dog based on defaulted equations. The rat and dog in vivo data of lacidipine after intravenous bolus administration of lacidipine solution and oral administration of lacidipine suspension were collected from literature reference.24 With the drug physicochemical properties and PK parameters predicted or collected from literature references, the PK profiles for lacidipine after intravenous and oral administration in rat and dog were obtained and then were used to validate the built base PBPK model by comparing with the observed.
2.8.5 PK simulation for three lacidipine formulations in dog and extrapolation to human. After the base model was built successfully, the dissolution profiles of the three formulations in biorelevant dissolution media were loaded and the Z-factor dissolution model was implemented to measure the effect of formulations and dissolution conditions on the PK profiles. By the comparison of the predicted and observed plasma-time–concentration curves, the combined models were verified to be able to simulate dog PK for these three formulations. Then the dog PK profiles were extrapolated to human. The predicted data were compared with the observed ones reported in the literature. Gastrointestinal simulation for lacidipine tablets was performed with the GastroPlus Single Simulation Mode under dog or human fasted state.
3. Results and discussion
3.1 In vitro solubility and dissolution
The solubility data of lacidipine in pH 6.5 buffer solution and the biorelevant media simulating the fasted state small intestinal fluids of human are shown in Table 2. Lacidipine was highly lipophilic (log![[thin space (1/6-em)]](https://www.rsc.org/images/entities/char_2009.gif) P5.51) and exhibited a very poor aqueous solubility of 0.05 μg mL−1 in pH 6.5 buffer solution. In the biorelevant media, its solubility was increased remarkably to 4.56 μg mL−1 and 2.0 μg mL−1 for FaSSIF and FaSSIF-V2, respectively. The hydrophobic drugs are generally well solubilized by bile salt-phospholipid mixed micelles in the small intestine.33 Thus the solubility of lacidipine was increased by tens-fold to hundreds-fold in the biorelevant media. Nevertheless, its dose number (Do) was calculated to be 3.5–8.0 in the biorelevant media, suggesting that lacidipine is still insoluble in the fasted GI tract.
P5.51) and exhibited a very poor aqueous solubility of 0.05 μg mL−1 in pH 6.5 buffer solution. In the biorelevant media, its solubility was increased remarkably to 4.56 μg mL−1 and 2.0 μg mL−1 for FaSSIF and FaSSIF-V2, respectively. The hydrophobic drugs are generally well solubilized by bile salt-phospholipid mixed micelles in the small intestine.33 Thus the solubility of lacidipine was increased by tens-fold to hundreds-fold in the biorelevant media. Nevertheless, its dose number (Do) was calculated to be 3.5–8.0 in the biorelevant media, suggesting that lacidipine is still insoluble in the fasted GI tract.
Dissolution profiles of the three lacidipine formulations in biorelevant media are presented in Fig. 1. In the biorelevant media, the three formulations showed notably different dissolution performances. The dissolution of formulation A was nearly complete (>85%) in the biorelevant media after 30–45 min. By contrast, formulation B and C exhibited incomplete dissolution behaviours (about 20–30%) in biorelevant media after 1 h. But two commercial tablets of lacidipine were both completely dissolved in the dissolution medium specified in the pharmacopeia (Fig. 2). Compared to the dissolution condition of high level surfactants, the biorelevant media were more sensitive to the difference in the intrinsic quality of formulations.
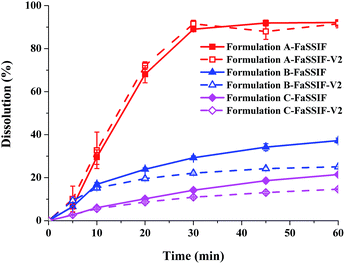 |
| | Fig. 1 Dissolution profiles of three lacidipine formulations in biorelevant dissolution media (data are mean ± S.D., n = 3). | |
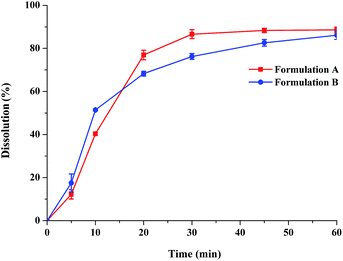 |
| | Fig. 2 Dissolution profiles of two commercial lacidipine formulations in 1% Tween 20 solution adopted as the compendial dissolution medium in the BP 2012 (data are mean ± S.D., n = 3). | |
3.2 Z-factor dissolution modelling for lacidipine formulations
The Z-factor is a formulation-dependent parameter. Through fitting the dissolution profiles, the Z-factor values for different lacidipine formulations in biorelevant media were obtained (Table 3). For poorly water-soluble drugs, formulation strategies were applied to enhance drug solubility and dissolution rate. To reflect the formulation effect, the Z-factor was introduced in this study. For a specific formulation, the solubility in the lumen compartment (Cs) was certain. Thus, the dissolution rate was reflected by the Z-factor value (eqn (2)). Meanwhile the fitted value of Z-factor for a specific formulation was also affected by the dissolution condition. Therefore, only the fitted value was close to the actual in vivo value can the simulated agree with the observed. The obtained Z-factor values were utilized to consider the impact of dissolution profiles on in vivo PK of different formulations.
Table 3 The Z-factor values in different dissolution media for the three lacidipine formulations (unit: mL mg−1 s−1)
| |
Formulation A |
Formulation B |
Formulation C |
| FaSSIF |
0.010 |
0.059 |
0.021 |
| FaSSIF-V2 |
0.012 |
0.199 |
0.045 |
3.3 PBPK modelling for prediction of rat PK
The physicochemical and PK parameters of lacidipine are listed in Table 2. The rat in vivo disposition parameters CL and Vss were reported to be 0.38 L h−1 (ref. 24) and predicted by the software to be 1.87 L, respectively. Fig. 3A showed the predicted and observed rat plasma concentration–time profiles after intravenous bolus administration of lacidipine solution (0.05 mg kg−1). The simulated plasma concentration–time profile was in a good agreement with the observed in vivo curve (data collected from literature24), proving the reliability of the disposition model in rats. Fig. 3B showed that the predicted plasma concentration–time curve after oral administration of 2.5 mg kg−1 lacidipine suspension agreed well with the observed curve, proving that the absorption process could be also well simulated. The results demonstrated that the PBPK model can be successfully used to predict rat PK.
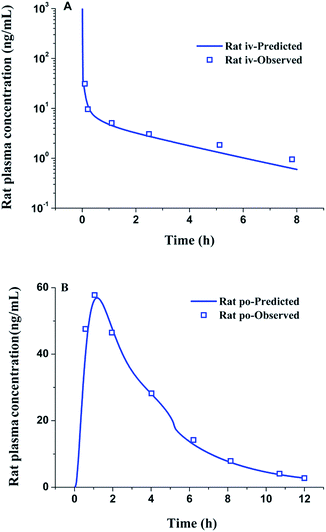 |
| | Fig. 3 Simulated and observed (N = 4) rat plasma concentration–time profiles after iv bolus administration of a 0.05 mg kg−1 dose of lacidipine (A) and oral administration of a 2.5 mg kg−1 dose of lacidipine suspension (B) (the observed data were collected form literature24). | |
3.4 PBPK modelling for prediction of dog PK
The CL was reported to be 9.6 L h−1 (ref. 24) and the value of Vss was predicted to be 159.5 L for beagle dogs, which were used as in vivo disposition parameters. As like rat PK prediction, the predicted and observed dog plasma concentration–time profiles were both in a good agreement, after intravenous bolus administration of 0.5 mg kg−1 lacidipine solution and oral administration of 2 mg kg−1 suspension, respectively (Fig. 4). The result demonstrated the reliability of the base dog model and indicated that the PBPK model was also successfully established to simulate lacidipine PK behaviour in dogs.
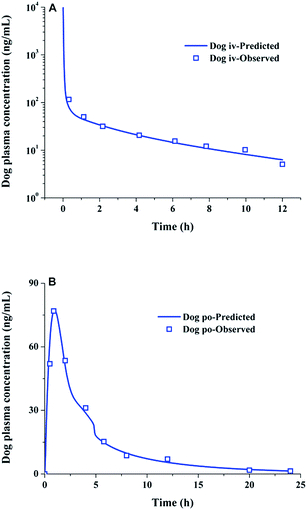 |
| | Fig. 4 Simulated and observed (N = 4) dog plasma concentration–time profiles after iv bolus administration of a 0.5 mg kg−1 dose of lacidipine (A) and oral administration of a 2 mg kg−1 dose of lacidipine suspension (B) (the observed data were collected form literature24). | |
The Z-factor values in Table 3 were used as the input function to evaluate the effect of dissolution behaviours on in vivo PK profiles. The simulated plasma concentration–time profile and the comparison of the predicted and the observed pharmacokinetic parameters are summarized in Fig. 5 and Table 4, respectively. The three lacidipine formulations exhibited distinct absorption rates and exposure extents in vivo. Formulation A showed the best in vivo performance with the highest Cmax and AUC, which was in line with its fast and complete dissolution in biorelevant media. The predicted PK profiles were quite similar based on dissolution data from FaSSIF and FaSSIF-V2 and both agreed well with the observed curves, although the prediction error for Cmax was a little higher in FaSSIF-V2 compared with FaSSIF. For formulation B, it showed a relatively lower Cmax and AUC compared with formulation A. And a good agreement of Cmax and AUC (PE < 10%) between the predicted and the observed profiles was achieved in FaSSIF-V2, and FaSSIF provided a considerable underestimation in terms of Cmax. Formulation C showed the worst absorption with the lowest Cmax and AUC. The value of Cmax was under-predicted by FaSSIF, and the elimination phase of the predicted profile from FaSSIF-V2 was slower than the observed, resulting in an overestimation of AUC0–t. In summary, the predicted PK performances of the three lacidipine formulations corresponded well to the observed values.
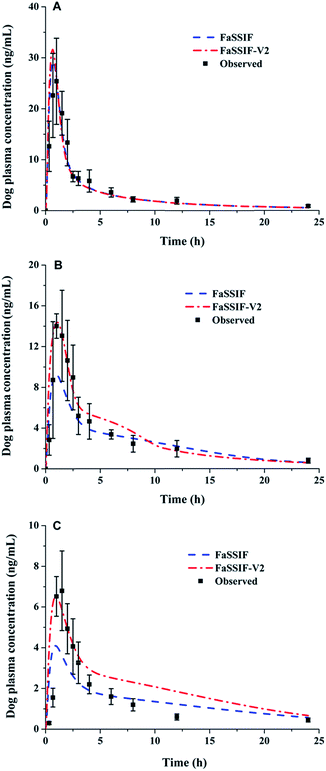 |
| | Fig. 5 Predicted and observed plasma concentration–time profiles of the three lacidipine formulations (A for formulation A; B for formulation B; C for formulation C) following oral administration at a single 4 mg dose of lacidipine tablet in beagle dogs (data are mean ± SE). | |
Table 4 The observed and predicted pharmacokinetic parameters for lacidipine formulations based on Z-factor values obtained from biorelevant mediaa
| |
Formulation A |
Formulation B |
Formulation C |
| Observed |
FaSSIF |
% PE |
FaSSIF-V2 |
% PE |
Observed |
FaSSIF |
% PE |
FaSSIF-V2 |
% PE |
Observed |
FaSSIF |
% PE |
FaSSIF-V2 |
% PE |
| PE (%) = (predicted − observed)/observed × 100. |
| Cmax (ng mL−1) |
25.39 |
29.38 |
15.7 |
31.62 |
−33.8 |
14.01 |
9.28 |
−33.8 |
14.39 |
2.7 |
6.8 |
4.10 |
−39.8 |
6.54 |
−3.8 |
| AUC0–t (ng h mL−1) |
89.68 |
81.35 |
−9.3 |
81.43 |
−11.4 |
81.83 |
70.29 |
−14.1 |
76.83 |
−7.0 |
31.27 |
33.70 |
7.8 |
50.84 |
62.6 |
| AUC0–∞ (ng h mL−1) |
102.7 |
88.48 |
−13.8 |
88.54 |
−14.1 |
81.83 |
70.29 |
−14.1 |
84.83 |
3.7 |
50.04 |
41.47 |
−17.1 |
57.45 |
14.8 |
The in vivo dissolution profiles of the three formulations are shown in Fig. 6. In the first hour, the three formulations displayed a similar in vivo dissolution to the in vitro condition (Fig. 6A). Formulation A with high dissolution rate could be dissolved completely both in vitro and in vivo within 1 h. For the formulations with low dissolution rate, the in vivo dissolution would perform slowly and continuously along with the transit and absorption in the GI tract, and thus the in vivo dissolution for formulation B and C was much higher than the in vitro dissolution (Fig. 6B).
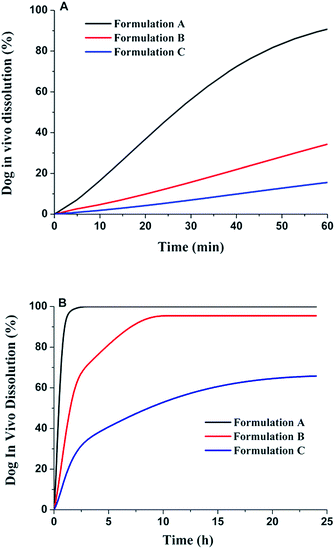 |
| | Fig. 6 Dog in vivo dissolution profiles of the three lacidipine formulations (A for 1 h; B for 24 h). | |
The different dissolution rates of the three formulations were attributed to the difference in the regional absorption of the intestinal tract (Fig. 7). Formulation A, which showed a fast dissolution, was mainly absorbed in the upper small intestine with more than 50% absorption occurring in the duodenum. Formulation B dissolved slower and it was mainly absorbed not only in the upper small intestine but also in the caecum and colon. The compartmental absorption of formulation C was similar to formulation B, but the absorption in the upper small intestine was much less due to a slower dissolution rate of formulation C, resulting in an incomplete absorption (nearly 70%). The slower the formulation dissolves, the less the absorption occurs in the small intestine where is the major site of absorption for most of drugs.
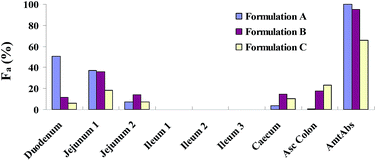 |
| | Fig. 7 Compartmental absorption of three lacidipine formulations in dogs. | |
3.5 PBPK modelling for prediction of human PK
The above results turned out that PBPK modelling combined with the biorelevant dissolution can provide good prediction of rat and dog PK behaviours for the three lacidipine formulations. Then the same method and the Z-factor data from dissolution medium FaSSIF-V2 were used to simulate human plasma profiles of the three formulations.
The CL of human was calculated to be 46.5 L h−1 based on eqn (4) and the literature-reported CL value of dog, and the Vss value of human was predicted to be 17.5 L. The predicted human plasma profiles of the three formulations are shown in Fig. 8. The predicted plasma curve of formulation A was in a good agreement with the literature data,23 demonstrating the reliability of the PBPK model in human for lacidipine formulations. And as the literature stated, for the compounds like lacidipine which were mainly cleared by hepatic metabolism or renal excretion and whose absorption and distribution were governed by passive processes, PBPK methods could achieve a good prediction.17
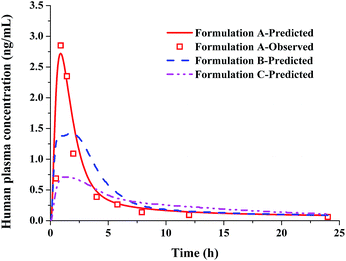 |
| | Fig. 8 The simulated and observed human in vivo PK profiles for the three lacidipine formulations using the Z-factor form FaSSIF-V2 dissolution media. | |
The predicted PK parameters for three formulations are shown in Table 5. The predicted Cmax of formulation A was almost twice as high as that of formulation B. But their absorption performances were both complete and the in vivo exposures were almost the same for the two formulations. For formulation C, the values of Cmax and AUC were much lower with Fa being 81.7% than formulation A and B.
Table 5 Predicted pharmacokinetic parameters of three formulations in human
| |
Formulation A |
Formulation B |
Formulation C |
| Cmax (ng mL−1) |
2.72 |
1.42 |
0.71 |
| Tmax (h) |
0.88 |
1.84 |
1.28 |
| AUC0–t (ng h mL−1) |
8.80 |
8.69 |
6.78 |
| AUC0–inf (ng h mL−1) |
12.00 |
11.8 |
8.47 |
| Fa (%) |
99.8 |
99.5 |
81.7 |
The human in vivo dissolution behaviours and the regional absorption in the GI tract of the three formulations were similar to those in dogs (Fig. 9 and 10). Formulation A and B both had complete dissolution in human GI tract, but the slower dissolution of formulation B during the small intestine transit time resulted in a slower absorption (lower Cmax and high Tmax). For the most slowly dissolved formulation C, it exhibited an incomplete dissolution/absorption and the absorption fraction occurring in the caecum and ascending colon almost reached up to 42%, due to the long colonic residence time.
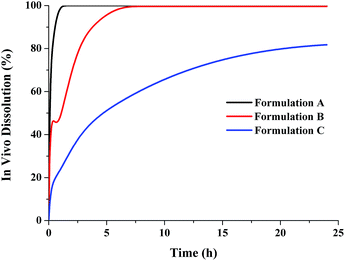 |
| | Fig. 9 Human in vivo dissolution profiles of the three lacidipine formulations. | |
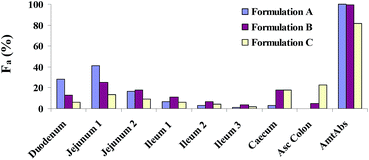 |
| | Fig. 10 Human compartmental absorption of the three lacidipine tablets. | |
4. Conclusions
The PBPK models in rat, dog and human are successfully constructed for lacidipine. By integrating biorelevant dissolution with PBPK modelling, it is achievable to quantitatively and accurately predict human the plasma profiles of various formulations after oral administration based on reasonable modelling and simulation of preclinical species. Predictive models of drug PK profiles and the relationship between in vitro dissolution and in vivo performance can help the choice of candidate formulations for clinical trial and improve formulation strategy.
Acknowledgements
We thank financial support from the National Natural Science Foundation of China (no. 81173009) and Technology bureau in Shenyang (no. ZCJJ2013402). We also thank financial support from Project for New Century Excellent Talents of Ministry of Education (no. NCET-12-1015).
Notes and references
- G. Amidon, H. Lennernäs, V. Shah and J. Crison, Pharm. Res., 1995, 12, 413–420 CrossRef CAS.
- J. B. Dressman and C. Reppas, Eur. J. Pharm. Sci., 2000, 11(suppl. 2), S73–S80 CrossRef CAS.
- Y. Tsume, D. M. Mudie, P. Langguth, G. E. Amidon and G. L. Amidon, Eur. J. Pharm. Sci., 2014, 57, 152–163 CrossRef CAS PubMed.
- J. B. Dressman, G. L. Amidon, C. Reppas and V. P. Shah, Pharm. Res., 1998, 15, 11–22 CrossRef CAS.
- E. Galia, E. Nicolaides, D. Hörter, R. Löbenberg, C. Reppas and J. Dressman, Pharm. Res., 1998, 15, 698–705 CrossRef CAS.
- B.-M. Lue, F. S. Nielsen, T. Magnussen, H. M. Schou, K. Kristensen, L. O. Jacobsen and A. Müllertz, Eur. J. Pharm. Biopharm., 2008, 69, 648–657 CrossRef CAS PubMed.
- K. Otsuka, Y. Shono and J. Dressman, J. Pharm. Pharmacol., 2013, 65, 937–952 CrossRef CAS PubMed.
- H. M. Jones, I. B. Gardner and K. J. Watson, AAPS J., 2009, 11, 155–166 CrossRef CAS PubMed.
- B. Benjamin, T. K. Barman, T. Chaira and J. K. Paliwal, Curr. Drug Discovery Technol., 2010, 7, 143–153 CAS.
- W. Jiang, S. Kim, X. Zhang, R. A. Lionberger, B. M. Davit, D. P. Conner and L. X. Yu, Int. J. Pharm., 2011, 418, 151–160 CrossRef CAS PubMed.
- X. Zhang, R. A. Lionberger, B. M. Davit and L. X. Yu, AAPS J., 2011, 13, 59–71 CrossRef PubMed.
- L. X. Yu and G. L. Amidon, Int. J. Pharm., 1999, 186, 119–125 CrossRef CAS.
- S. S. De Buck, V. K. Sinha, L. A. Fenu, M. J. Nijsen, C. E. Mackie and R. A. Gilissen, Drug Metab. Dispos., 2007, 35, 1766–1780 CrossRef CAS PubMed.
- B. J. Smith, Biopharm. Drug Dispos., 2012, 33, 53–54 CrossRef CAS PubMed.
- M. D. Harwood, S. Neuhoff, G. L. Carlson, G. Warhurst and A. Rostami-Hodjegan, Biopharm. Drug Dispos., 2013, 34, 2–28 CrossRef CAS PubMed.
- N. Parrott, H. Jones, N. Paquereau and T. Lave, Basic Clin. Pharmacol. Toxicol., 2005, 96, 193–199 CrossRef CAS PubMed.
- H. M. Jones, N. Parrott, K. Jorga and T. Lave, Clin. Pharmacokinet., 2006, 45, 511–542 CrossRef CAS PubMed.
- E. Jantratid, N. Janssen, C. Reppas and J. B. Dressman, Pharm. Res., 2008, 25, 1663–1676 CrossRef CAS PubMed.
- R. Takano, K. Sugano, A. Higashida, Y. Hayashi, M. Machida, Y. Aso and S. Yamashita, Pharm. Res., 2006, 23, 1144–1156 CrossRef CAS PubMed.
- M. Sun, J. Sun, S. He, Y. Wang, Y. Sun, X. Liu and Z. He, Drug Dev. Ind. Pharm., 2012, 38, 1099–1106 CrossRef CAS PubMed.
- Y. Geng, L. Zhao, J. Zhao, B. Guo, P. Ma, Y. Li and T. Zhang, J. Chromatogr. B: Anal. Technol. Biomed. Life Sci., 2014, 945–946, 121–126 CrossRef CAS PubMed.
- B. Agoram, W. S. Woltosz and M. B. Bolger, Adv. Drug Delivery Rev., 2001, 50(suppl. 1), S41–S67 CrossRef CAS.
- L. Da Ros, L. Squassante and S. Milleri, Clin. Pharmacokinet., 2003, 42, 99–106 CrossRef CAS PubMed.
- M. Pellegatti, P. Grossi, J. Ayrton, G. L. Evans and A. J. Harker, Xenobiotica, 1990, 20, 765–777 CrossRef CAS PubMed.
- P. Poulin and F. P. Theil, J. Pharm. Sci., 2000, 89, 16–35 CrossRef CAS.
- P. Poulin, K. Schoenlein and F. P. Theil, J. Pharm. Sci., 2001, 90, 436–447 CrossRef CAS.
- P. Poulin and F. P. Theil, J. Pharm. Sci., 2002, 91, 129–156 CrossRef CAS PubMed.
- L. M. Berezhkovskiy, J. Pharm. Sci., 2004, 93, 1628–1640 CrossRef CAS PubMed.
- T. Rodgers, D. Leahy and M. Rowland, J. Pharm. Sci., 2005, 94, 1259–1276 CrossRef CAS PubMed.
- T. Rodgers and M. Rowland, J. Pharm. Sci., 2006, 95, 1238–1257 CrossRef CAS PubMed.
- L. Squassante, E. Caveggion, S. Braggio, M. Pellegatti and P. Baroldi, J. Cardiovasc. Pharmacol., 1994, 23(suppl. 5), S94–S97 CrossRef CAS PubMed.
- S. T. Hall, S. M. Harding, G. L. Evans, M. Pellegatti and P. Rizzini, J. Cardiovasc. Pharmacol., 1991, 17(suppl. 4), S9–S13 CrossRef CAS PubMed.
- R. Holm, A. Müllertz and H. Mu, Int. J. Pharm., 2013, 453, 44–55 CrossRef CAS PubMed.
|
| This journal is © The Royal Society of Chemistry 2015 |


![[thin space (1/6-em)]](https://www.rsc.org/images/entities/char_2009.gif) P/log
P/log![[thin space (1/6-em)]](https://www.rsc.org/images/entities/char_2009.gif) D, blood to plasma partitioning and unbound percent in plasma Fup (Table 2) to mechanically predict in vivo distribution. The volume of distribution at steady state (Vss) in different species (rat, dog and human) is calculated by GastroPlus defaulted equations, according to drug's biopharmaceutical parameters and PBPK model.
D, blood to plasma partitioning and unbound percent in plasma Fup (Table 2) to mechanically predict in vivo distribution. The volume of distribution at steady state (Vss) in different species (rat, dog and human) is calculated by GastroPlus defaulted equations, according to drug's biopharmaceutical parameters and PBPK model.![[thin space (1/6-em)]](https://www.rsc.org/images/entities/char_2009.gif) P
P![[thin space (1/6-em)]](https://www.rsc.org/images/entities/char_2009.gif) P, and permeability), and PK parameters (such as elimination half-life, clearance, volume of distribution). All these parameters (Table 2) for the simulation are experimentally determined, in silico predicted or collected from the literature. The human effective permeability (Peff) was estimated by GastroPlus model on the basis of lacidipine structure. With this software, human Peff can be converted to an estimated Peff in rat and dog based on defaulted equations. The rat and dog in vivo data of lacidipine after intravenous bolus administration of lacidipine solution and oral administration of lacidipine suspension were collected from literature reference.24 With the drug physicochemical properties and PK parameters predicted or collected from literature references, the PK profiles for lacidipine after intravenous and oral administration in rat and dog were obtained and then were used to validate the built base PBPK model by comparing with the observed.
P, and permeability), and PK parameters (such as elimination half-life, clearance, volume of distribution). All these parameters (Table 2) for the simulation are experimentally determined, in silico predicted or collected from the literature. The human effective permeability (Peff) was estimated by GastroPlus model on the basis of lacidipine structure. With this software, human Peff can be converted to an estimated Peff in rat and dog based on defaulted equations. The rat and dog in vivo data of lacidipine after intravenous bolus administration of lacidipine solution and oral administration of lacidipine suspension were collected from literature reference.24 With the drug physicochemical properties and PK parameters predicted or collected from literature references, the PK profiles for lacidipine after intravenous and oral administration in rat and dog were obtained and then were used to validate the built base PBPK model by comparing with the observed.![[thin space (1/6-em)]](https://www.rsc.org/images/entities/char_2009.gif) P5.51) and exhibited a very poor aqueous solubility of 0.05 μg mL−1 in pH 6.5 buffer solution. In the biorelevant media, its solubility was increased remarkably to 4.56 μg mL−1 and 2.0 μg mL−1 for FaSSIF and FaSSIF-V2, respectively. The hydrophobic drugs are generally well solubilized by bile salt-phospholipid mixed micelles in the small intestine.33 Thus the solubility of lacidipine was increased by tens-fold to hundreds-fold in the biorelevant media. Nevertheless, its dose number (Do) was calculated to be 3.5–8.0 in the biorelevant media, suggesting that lacidipine is still insoluble in the fasted GI tract.
P5.51) and exhibited a very poor aqueous solubility of 0.05 μg mL−1 in pH 6.5 buffer solution. In the biorelevant media, its solubility was increased remarkably to 4.56 μg mL−1 and 2.0 μg mL−1 for FaSSIF and FaSSIF-V2, respectively. The hydrophobic drugs are generally well solubilized by bile salt-phospholipid mixed micelles in the small intestine.33 Thus the solubility of lacidipine was increased by tens-fold to hundreds-fold in the biorelevant media. Nevertheless, its dose number (Do) was calculated to be 3.5–8.0 in the biorelevant media, suggesting that lacidipine is still insoluble in the fasted GI tract.


