Two-phase mixture model for substrate degradation and photo-hydrogen production in an entrapped-cell photobioreactor under various light intensities

Cheng-Long Guo*a, Hong-Xia Caob, Hong-Shan Peia, Fei-Qiang Guoa and Da-Meng Liucd
aSchool of Electric Power Engineering, China University of Mining and Technology, Xuzhou 221116, China. E-mail: clguo@cumt.edu.cn
bLow Carbon Energy Institute, China University of Mining and Technology, Xuzhou 221008, China
cGuizhou Electric Power Test and Research Institute, Guiyang 550002, China
dInstitute of Engineering Thermophysics, Chongqing University, Chongqing 400030, China

Received 8th December 2014 , Accepted 19th January 2015

First published on 19th January 2015


Abstract

A two-phase mixture model was developed for revealing the interaction between substrate degradation and photo-hydrogen production in an entrapped-cell photobioreactor under various light intensities. The effects of the porosity of the packed bed and the height of the photobioreactor on the substrate degradation rate (SDR) and hydrogen production rate (HPR) were also predicted at different light intensities.

1. Introduction

Photosynthetic bacteria (PSB) is the most promising microorganism for biological hydrogen production because it not only possesses a high theoretical conversion yield, but also converts light energy to produce hydrogen using simple organic compounds as hydrogen sources.1–4 Currently, many studies on photo-hydrogen production are conducted using cell immobilization techniques because of their advantages of enhanced biomass retention and improved stability.5–8 Among these cell immobilization techniques, the entrapment of cells in porous gels is regarded as a desirable method due to the higher biomass content and local anaerobic environment created, as well as the stable operation characteristics at low hydraulic retention times.9–11 Unfortunately, entrapped-cell photobioreactors are still in an early stage of laboratory study owing to the lower photo-hydrogen production performance caused by the limitations of mass transfer and photo-biochemical reactions.12 Therefore, understanding their complicated mass transfer processes and photo-biochemical reactions is conducive for promoting the applicability of entrapped-cell photobioreactors in the bioconversion of organics for photo-hydrogen production. However, experimental measurements of the complex mass transfer processes and photo-biochemical reactions are very difficult due to the restrictions of the measuring instruments.

At present, it is interesting to note that mathematical modeling as a powerful tool is used to investigate the mass transfer processes and photo-biochemical reactions.13–17 Moreover, photo-hydrogen production is usually predicted under various light intensities to be one of the important factors affecting photo-biochemical reactions.13,18 Zhang et al. utilized a two-dimensional mass transfer model to study the effects of light intensity on the coupled processes of substrate transfer and degradation in an annular fiber-illuminating bioreactor.13 Liao et al. simulated the effects of light intensity on the flow and mass transfer process using a lattice Boltzmann model coupled with a multi-block strategy.14 In addition, the effects of light intensity on glucose consumption efficiency and photo-hydrogen production rate were investigated using a one-dimensional two-phase flow and transport model.15 However, to date, few models have focused on the interaction between substrate degradation and photo-hydrogen production under various light intensities.

In this work, a two-phase mixture model is developed to predict photo-hydrogen production performance and substrate concentration distribution characteristics under various light intensities, and the numerical simulation results are validated using the experimental data reported in ref. 11. In addition, the effects of the porosity of the packed bed and the height of the photobioreactor are also predicted at different light intensities.

2. Model development

The entrapped-cell photobioreactor had a working volume of 100 × 40 × 200 mm3 and was packed with gel granules (4 mm in diameter). The substrate flow direction in the mainstream channel and the product transfer direction inside the gel granules were defined as the h-direction and the r-direction, respectively. The illumination conditions were provided using LED lamps with a main light wavelength of 590 nm; the operation temperature was set at 30 °C, and the pH value of the influent medium was adjusted to 7.0. The glucose used as the sole carbon source was fed by a peristaltic pump, and was then degraded by the entrapped cells after being diffused into the gel granules from the mainstream channel. Finally, the products diffused out of the gel granules were then discharged out of the entrapped-cell photobioreactor. Obviously, the photo-biochemical reactions, as well as the two-phase flow and mass transfer, occurred in the entrapped-cell photobioreactor. In this work, following assumptions were utilized to establish the two-phase mixture model: (1) this work is performed under steady-state operating conditions; (2) the substrate and product transfer processes in the mainstream channel have a one-dimensional flow along the h-direction; (3) the thermal and physical properties of the fluids are constant, and the transfer processes can be described by Darcy's law; (4) the photo-biochemical reactions only occur inside the gel granules; (5) the distribution and activity of PSB are uniform inside the gel granules; (6) hydrogen and carbon dioxide, as the only gaseous products, are generated by the degradation of glucose, and their mole ratio is 2[thin space (1/6-em)]:[thin space (1/6-em)]1 according to ref. 19.

Governing equations

Mass conservation in the liquid and gas phases, as well as the two-phase mixture:20,21
 
∇·(ρlul) = l (1)
 
∇·(ρgug) = g (2)
 
∇·(ρu) = l + g (3)
where the subscripts ‘l’ and ‘g’ refer to the liquid and gas phases, respectively. ρ represents the density, kg m−3; u the vector velocity, m s−1; and the mass source, kg m−3 s−1.

Momentum conservation in the liquid and gas phases, as well as the two-phase mixture:

 
image file: c4ra15988h-t1.tif(4)
 
image file: c4ra15988h-t2.tif(5)
 
image file: c4ra15988h-t3.tif(6)
where kr is the relative permeability and g is the gravitational acceleration, m s−2. K denotes the absolute permeability, m2; v the kinematic viscosity, m2 s−1; and γρ the density correlation factor, which can be given as follows:22
 
image file: c4ra15988h-t4.tif(7)
 
image file: c4ra15988h-t5.tif(8)
 
image file: c4ra15988h-t6.tif(9)
where ε is the porosity of the packed bed; dgr is the diameter of the gel granule, m; and s is the saturation. Moreover, λ denotes the mobility, and can be calculated as follows:
 
image file: c4ra15988h-t7.tif(10)
 
image file: c4ra15988h-t8.tif(11)
 
λl + λg = 1 (12)

Substrate balance equation in the two-phase mixture:

 
∇·(ερDsωs) + ∇·{ε[ρlslDsl(∇ωsl − ∇ωs) + ρgsgDsg(∇ωsg − ∇ωs)]} − ∇·(ωsljl + ωsgjg) − ϕs = ∇·(γsρuωs) (13)
where the superscript ‘s’ refers to the substrate. ϕs is the substrate degradation rate, kg m−3 s−1; γs the advection correction factor; ω the mass fraction; D the effective diffusion coefficient, m2 s−1; and j the diffusive flux, kg m−2 s−1, which can be calculated as follows:
 
image file: c4ra15988h-t9.tif(14)
 
ρωs = ρlslωsl + ρgsgωsg (15)
 
ρDs = ρlslDsl + ρgsgDsg (16)
 
image file: c4ra15988h-t10.tif(17)
 
jl + jg = 0 (18)

In addition, the relative permeability of the gas and liquid phases, as well as the capillary pressure can be given as follows:23,24

 
krl = sl3 (19)
 
krg = (1 − sl)3 (20)
 
image file: c4ra15988h-t11.tif(21)
where σ is the liquid–gas interfacial tension, N m−1. The Leverett function J(s1) can be calculated as follows:25
 
J(sl) = 1.417(1 − sl) − 2.12(1 − sl)2 + 1.263(1 − sl)3 (22)

The substrate transfer in the gas phase can be neglected. That is,

 
ωsg = 0, Dsg = 0 (23)

The local substrate concentration in the two-phase mixture and the liquid phase are defined as follows:

 
Cs = ρωs = slCsl = slρlωsl (24)

The boundary conditions can be obtained as follows:

At the inlet of the entrapped-cell photobioreactor:

 
Cs = Csin, sl = 1 (25)
 
ρlul = ρlul,in, ρgug = 0 (26)

At the outlet of the entrapped-cell photobioreactor:

 
image file: c4ra15988h-t12.tif(27)

Mass transfer inside the gel granules

The substrate transfer is dominated by diffusion inside the gel granules, and the substrate transfer processes can be modelled by Fick's law. Therefore, the substrate transfer can be obtained as follows:26,27
 
image file: c4ra15988h-t13.tif(28)
where the subscript ‘gr’ refers to the gel granule. Yx/s is the cell yield; ψ the cell density increasing coefficient; Cc the cell density, kg m−3; M the molecular weight, kg mol−1; and μ and m denote the specific growth rate and maintenance coefficient, respectively, which can be described as follows:15,16
 
m = 0.562137[thin space (1/6-em)]exp(−2.8(I01.031/10.8 − 1)2) (29)
 
image file: c4ra15988h-t14.tif(30)
where I0 denotes the light intensity, W m−2, and Ks is the Monod constant, mM. μmax is the maximum specific growth rate and can be calculated as follows:15,16
 
μmax = 0.25986[thin space (1/6-em)]exp(−1.2(I01.031/10.8 − 1)2) (31)

The corresponding boundary conditions can be obtained as follows:

 
image file: c4ra15988h-t15.tif(32)
 
r = R, Csgr = Csl (33)

The mass transfer of hydrogen produced is also dominated by diffusion in the gel granules, which can be expressed by Fick's law and the Luedeking–Piret model:27,28

 
image file: c4ra15988h-t16.tif(34)
where the superscript ‘H2’ refers to the hydrogen produced. β is the growth associated kinetic constant, s−1. α* denotes the non-growth associated kinetic constant, and can be calculated as follows:15
 
α* = 0.0192[thin space (1/6-em)]exp(−9.5(I01.031/10.8 − 1)2) (35)

The corresponding boundary conditions can be obtained as follows:

 
image file: c4ra15988h-t17.tif(36)
 
r = R, CHgr2 = CHg2 (37)

Therefore, the substrate degradation rate ϕs and the hydrogen production rate ϕH2 can be given as follows:

 
image file: c4ra15988h-t18.tif(38)
 
image file: c4ra15988h-t19.tif(39)
where α is the specific area of gel granules in the elemental volume, m−1.

Moreover, the interfacial mass transfer rates of the gas and liquid phases can be expressed as follows:

 
l = −ϕs (40)
 
g = ϕH2 + ϕCO2 (41)
where the superscript ‘CO2’ refers to the carbon dioxide produced.

The hydrogen production rate ϕH2 and the carbon dioxide production rate ϕCO2 can be calculated as follows:

 
2ϕCO2/MCO2 = ϕH2/MH2 (42)

Estimation of photo-hydrogen production

Substrate degradation and photo-hydrogen production in the entrapped-cell photobioreactor were assessed by the substrate degradation rate (SDR) and hydrogen production rate (HPR), which can be defined as follows:5,15
 
image file: c4ra15988h-t20.tif(43)
 
image file: c4ra15988h-t21.tif(44)
where ΔT is the hydrogen evolution time and ΔCSD and ΔCHP represent the increments of cumulative substrate degradation and hydrogen production, respectively.

Numerical simulation procedure

Self-written code in the FORTRAN language based on the Gauss-Seidel algorithm was used to iteratively solve the abovementioned governing equations described by the finite volume method.29 Moreover, the independence of the simulation results and the grid size was ensured by performing rigorous numerical tests. The model mentioned above was validated against the experimental data obtained from ref. 11. In addition, as shown in Table 1, the photo-biochemical and thermal physical properties were used to predict the photo-hydrogen production performance and substrate concentration distribution characteristics.11,15,26
Table 1 Parameters used in the model
Parameter Value Parameter Value
Cc (kg m−3) 0.76 α (m−1) 930
CHg2 (mM) 29.76 β (h−1) 1.5 × 10⁻³
Csin (mM) 60 ε 0.38
DHgr2 (m2 h−1) 2.29 × 10⁻⁶ νg (m3 h−1) 0.356
Dsgr (m2 h−1) 2.86 × 10⁻⁶ νl (m3 h−1) 2.88 × 10⁻³
Dsl (m2 h−1) 6.06 × 10⁻⁶ ρg (kg m−3) 0.714
Ks (mM) 28.9 σ (N m−1) 7.28 × 10⁻²
Yx/s 0.61 ψ 1.97


3. Results and discussion

Effects of light intensity

Light intensity is a critical factor affecting photo-biochemical reactions because of the sensitivity of the photosynthetic system to light intensity.11 A suitable light intensity contributes to maximize photo-hydrogen production performance by enhancing the activity of the PSB. In this work, the effects of light intensities from 6 to 14 W m−2 on substrate degradation and photo-hydrogen production were predicted to determine the optimal light intensity for the maximum SDR and HPR yielded in the entrapped-cell photobioreactor.

As shown in Fig. 1, the numerical simulation results are given for comparison with the experimental data under various light intensities obtained from ref. 11. The relative deviations between the numerical simulation results and the experimental data are within the ranges of −8.6% to +2.8% and −29.2% to +23.6% for the SDR and HPR, respectively. Obviously, the SDR and HPR initially improved with the increase of light intensity because the amount of electrons and ATP stimulated gradually increased with the enhancement of the photons captured by the photosynthetic apparatus of the PSB. However, the SDR and HPR dropped when the light intensity further increased beyond the critical threshold. This can be attributed to the fact that the higher light intensity results in a photo-inhibition phenomenon because the excessive photons captured are converted into excess heat energy, which can damage the photosynthetic apparatus of the PSB.30 Therefore, maintaining the proper light intensity is critically significant for the improvement of the photo-hydrogen production performance of the entrapped-cell photobioreactor.


image file: c4ra15988h-f1.tif
Fig. 1 Effect of light intensity on the SDR and HPR values.

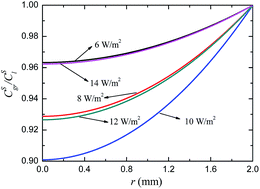
To understand the influence of light intensity on the substrate concentration distribution characteristics, as shown in Fig. 2, the Csl and Csgr/Csl values are predicted under five light intensities (6, 8, 10, 12 and 14 W m−2). It can be seen that at a specific light intensity, the substrate concentrations decrease along the h-direction and the reverse r-direction due to the degradation of the substrate by photo-biochemical reactions. Under the light intensity of 10 W m−2, the lowest substrate concentrations were achieved at the outlet of the entrapped-cell photobioreactor and the surface of the gel granules, which indicates that the substrate degradation performance has reached a maximum. These results coincide with the variation trend of the SDR mentioned above (cf. Fig. 1).


image file: c4ra15988h-f2.tif
Fig. 2 Effects of light intensity on Csl and Csgr/Csl.

Effects of the porosity of the packed bed

Varying the porosity of the packed bed can result in a change in the mass transfer processes of the substrate and products because it can significantly affect the specific area of the gel granules in the elemental volume. In this work, therefore, the effect of the porosity of the packed bed on the substrate degradation and photo-hydrogen production of the entrapped-cell photobioreactor was investigated under various light intensities, and the numerical simulation results are shown in Fig. 3.
image file: c4ra15988h-f3.tif
Fig. 3 Effect of the porosity of the packed bed on SDR and HPR values under various light intensities.

It can be seen that the SDR values decreased monotonically as the porosity of the packed bed was increased from 0.30 to 0.45, while the HPR values also decreased monotonically. This can be explained by the fact that increasing the porosity of the packed bed leads to a decrease in the specific area of the gel granules in the elemental volume, reducing the amount of substrate transferred into the gel granules and subsequently negatively affecting the photo-hydrogen production performance of the entrapped-cell photobioreactor. Based on the obtained results, it can be summarized that a higher porosity of packed bed is beneficial for improving the photo-hydrogen production performance of the entrapped-cell photobioreactor.

Effect of the height of the photobioreactor

It is known that the height of the photobioreactor is one of the key factors affecting substrate degradation and photo-hydrogen production in an entrapped-cell photobioreactor. In this section, therefore, the SDR and HPR values were studied for different heights of the photobioreactor by the two-phase mixture model, and the porosity of the packed bed was set at 0.38.

Fig. 4 shows the effect of the height of the photobioreactor on the SDR and HPR values under various light intensities. It can be seen that the SDR and HPR values decrease monotonically as the height of the photobioreactor increases from 150 to 250 mm. This behaviour can be explained by the fact that the continuous substrate degradation for producing hydrogen gradually exacerbates the insufficient substrate supplied for PSB as the height of photobioreactor is increased, which lowers the substrate degradation performance and photo-hydrogen production. Moreover, for a given height of photobioreactor, it can be found that both excessive and insufficient light intensities result in poor SDR values and lower HPR values; the highest SDR and HPR values were achieved at a light intensity of 10 W m−2 due to the combined effects of the effective absorption of light energy and the photo-inhibition of photosynthesis.


image file: c4ra15988h-f4.tif
Fig. 4 Effect of the height of the photobioreactor on SDR and HPR values under various light intensities.

4. Conclusions

In this work, a two-phase mixture model has been established to predict substrate degradation and photo-hydrogen production in an entrapped-cell photobioreactor under various light intensities based on photo-biochemical reaction kinetics and mass transfer principles. The main conclusions are summarized as follows:

(1) The predicted results of the substrate degradation rate (SDR) and hydrogen production rate (HPR) are in good agreement with the reported experimental data under various light intensities.

(2) The most suitable light intensity for substrate degradation to produce hydrogen was 10 W m−2.

(3) Increasing the porosity of the packed bed and the height of the photobioreactor lowered the photo-hydrogen production performance of the entrapped-cell photobioreactor.

Acknowledgements

The authors gratefully acknowledge financial support from the National Natural Science Foundation of China (no. 51406227) and the Fundamental Research Funds for the Central Universities (no. 2014QNB03).

References

  1. H. Y. Ren, B. F. Liu, J. Ding, G. J. Xie, L. Zhao, D. F. Xing and N. Q. Ren, RSC Adv., 2012, 2, 5531–5535 RSC.
  2. M. D. Redwood, R. L. Orozco, A. J. Majewski and L. E. Macaskie, Bioresour. Technol., 2012, 119, 384–392 CrossRef CAS PubMed.
  3. N. Basak, A. K. Jana, D. Das and D. Saikia, Int. J. Hydrogen Energy, 2014, 39, 6853–6871 CrossRef CAS PubMed.
  4. J. Cai and G. Wang, Bioresour. Technol., 2014, 154, 254–259 CrossRef CAS PubMed.
  5. C. L. Guo, X. Zhu, Q. Liao, Y. Z. Wang, R. Chen and D. J. Lee, Bioresour. Technol., 2011, 102, 8507–8513 CrossRef CAS PubMed.
  6. H. Y. Ren, B. F. Liu, G. J. Xie, L. Zhao and N. Q. Ren, GCB Bioenergy, 2013, 6, 599–605 CrossRef PubMed.
  7. G. J. Xie, B. F. Liu, D. F. Xing, J. Nan, J. Ding, H. Y. Ren and N. Q. Ren, RSC Adv., 2012, 2, 2225–2228 RSC.
  8. C. L. Guo, H. X. Cao, F. Q. Guo, C. L. Huang, H. G. Wang and Z. H. Rao, Biotechnol. Lett., 2014 DOI:10.1007/s10529-014-1677-0.
  9. Y. Z. Wang, Q. Liao, X. Zhu, R. Chen, C. L. Guo and J. Zhou, Bioresour. Technol., 2013, 135, 331–338 CrossRef CAS PubMed.
  10. X. Tian, Q. Liao, W. Liu, Y. Z. Wang, X. Zhu, J. Li and H. Wang, Int. J. Hydrogen Energy, 2009, 11, 4708–4717 CrossRef PubMed.
  11. Y. Z. Wang, Q. Liao, X. Zhu, X. Tian and C. Zhang, Bioresour. Technol., 2010, 101, 4034–4041 CrossRef CAS PubMed.
  12. M. Y. Azwar, M. A. Hussain and A. K. Abdul-Wahab, Renewable Sustainable Energy Rev., 2014, 31, 158–173 CrossRef CAS PubMed.
  13. C. Zhang, H. Zhang, Z. Zhang, Y. Jiao and Q. Zhang, J. Photochem. Photobiol., B, 2014, 131, 113–119 CrossRef CAS PubMed.
  14. Q. Liao, Y. X. Yang, X. Zhu and R. Chen, Int. J. Hydrogen Energy, 2013, 38, 15700–15709 CrossRef CAS PubMed.
  15. Q. Liao, D. M. Liu, D. D. Ye, X. Zhu and D. J. Lee, Int. J. Hydrogen Energy, 2011, 36, 13939–13948 CrossRef CAS PubMed.
  16. R. Chen, Y. K. Pu, Q. Liao, X. Zhu and Y. Z. Wang, Int. J. Hydrogen Energy, 2013, 38, 15670–15679 CrossRef CAS PubMed.
  17. C. Zhang, A. J. Wang and Q. G. Zhang, Biotechnol. Lett., 2013, 35, 1579–1587 CrossRef CAS PubMed.
  18. H. Argun and F. Kargi, Int. J. Hydrogen Energy, 2010, 4, 1595–1603 CrossRef PubMed.
  19. H. Koku, I. Eroğlu, U. Gündüz, M. Yücel and L. Türker, Int. J. Hydrogen Energy, 2002, 27, 1315–1329 CrossRef CAS.
  20. C. Y. Wang and C. Beckermann, Int. J. Heat Mass Transfer, 1993, 36, 2747–2758 CrossRef CAS.
  21. C. Y. Wang and P. Cheng, Int. J. Heat Mass Transfer, 1996, 39, 3607–3618 CrossRef CAS.
  22. M. Kaviany, Principles of heat transfer in porous media, Springer-verlag, 1995 Search PubMed.
  23. U. Pasaogullari and C. Y. Wang, Electrochim. Acta, 2004, 49, 4359–4369 CrossRef CAS PubMed.
  24. C. Y. Wang and P. Cheng, Adv. Heat Transfer, 1997, 30, 93–196 CAS.
  25. U. Pasaogullari and C. Y. Wang, J. Electrochem. Soc., 2004, 151, A399–A406 CrossRef CAS PubMed.
  26. I. Banerjee, J. M. Modak, K. Bandopadhyay, D. Das and B. R. Maiti, J. Biotechnol., 2001, 87, 211–223 CrossRef CAS.
  27. S. J. Pirt, Proc. R. Soc. London, Ser. B, 1965, 224–231 CrossRef CAS.
  28. J. Obeid, J. P. Magnin, J. M. Flaus, O. Adrot, J. C. Willison and R. Zlatev, Int. J. Hydrogen Energy, 2009, 34, 180–185 CrossRef CAS PubMed.
  29. S. Patankar, Numerical heat transfer and fluid flow, CRC Press, 1980 Search PubMed.
  30. I. Akkerman, M. Janssen, J. Rocha and R. H. Wijffels, Int. J. Hydrogen Energy, 2002, 27, 1195–1208 CrossRef CAS.

This journal is © The Royal Society of Chemistry 2015
Click here to see how this site uses Cookies. View our privacy policy here.