
Ultrafast spray pyrolysis fabrication of a nanophase ZnMn2O4 anode towards high-performance Li-ion batteries†
Longhai Zhanga,
Siqi Zhua,
Hui Caoa,
Gang Panga,
Jingdong Lin*b,
Linrui Hou*a and
Changzhou Yuan*ac
aSchool of Materials Science and Engineering, Anhui University of Technology, Ma'anshan, 243002, P. R. China. E-mail: ayuancz@163.com; Houlr619@163.com
bDepartment of Chemistry, College of Chemistry and Chemical Engineering, Xiamen University, Xiamen, 361005, P. R. China. E-mail: jdlin@xmu.edu.cn
cChinese Academy of Science (CAS) Key Laboratory of Materials for Energy Conversion, Hefei, 230026, P. R. China
First published on 21st January 2015
Abstract
In this study, a facile, ultrafast and green spray pyrolysis strategy was developed well to efficiently fabricate nanophase ZnMn2O4 (ZMO–W) with homogeneous composition from an aqueous spray solution of manganous acetate and zinc acetate. Compared with other ZMO samples prepared by utilizing absolute ethanol and ethylene glycol as solvents, the ZMO–W product displayed competitively cost-effective advantages with the comprehensive consideration of cost and performance. When evaluated as a promising anode for Li-ion batteries (LIBs), the resultant ZMO–W exhibited large initial specific capacity (∼1023 mA h g−1), good rate capability, and excellent cycling stability (average capacity degradation of only ∼4.0% per cycle) at 1 C rate. Benefiting from an ultrafast reaction process in seconds, a high yield (∼100%), environmental friendliness (no NOx emission) and simple equipment requirements (just a tubular furnace), the synthetic methodology we developed here possesses significant potential for rapid large-scale production of advanced ZMO and even other binary transition metal oxides for industrial applications of LIBs.
1. Introduction
In recent years, the ever-growing demands for high-capacity and/or high-power Li-ion batteries (LIBs) for upcoming large-scale applications, including electric vehicles (EVs), hybrid EVs, plug-in hybrid EVs, and so on, have prompted tremendous research efforts in developing high-performance electrode materials. As low-cost binary transition metal oxides (TMOs), manganites of transition and/or post-transition metals (AMn2O4, where A is Co, Ni or Zn, etc.) have sparked worldwide interest as appealing anodes for high-performance LIBs application.1–7 Among those Mn-based mixed TMOs, binary ZnMn2O4 (hereafter denoted as ZMO) with a normal spinel structure with the bivalent Zn2+ occupying the tetrahedral sites and the trivalent Mn3+ occupying the octahedral sites in the cubic spinel structure (Fig. 1a) has stood out from the attractive AMn2O4 family, as one distinguished anode for next-generation LIBs, thanks to the abundance, low price (Mn and Zn are ∼20 and 3 times less expensive than cobalt, respectively) and environmental-friendly nature of both Zn and Mn species.3,4,8–11 Also remarkably, the ZMO anode can electrochemically store Li+ ions through the well-known conversion mechanism (i.e., ZnMn2O4 + 8Li+ + 8e− = Zn + 2Mn + 4Li2O; Zn + Li2O = ZnO + 2Li+ + 2e−; and Mn + Li2O = MnO + 2Li+ + 2e−), along with the established alloying reaction between Zn and Li (i.e., Zn + Li+ + e− = LiZn). It is the synergetic effect of the two mechanisms that eventually imparts the ZMO anode large reversible theoretical capacity of ∼784 mA h g−1,3,4,8–11 much higher than the commercial graphitic anode (∼372 mA h g−1).12,13 Furthermore, the prominent ZMO possesses lower operating voltage of ∼1.5 V (vs. Li/Li+) for lithium extraction, compared to the CoOx anodes (∼2.2–∼2.4 V),3 as a result, a full Li-ion cell with the ZMO as anode would promise a larger cell voltage, thus ultimately delivering even larger specific energy density. | ||
| Fig. 1 (a) Crystal structure of ZMO unit cell with the spinel structure; (b) schematic illustration of spray pyrolysis synthesis of ZMO samples; (c) Rietveld refinement of wide-angle XRD pattern of the as-synthesized ZMO–W. | ||
Excitingly enough, striking progress in LIB technologies has greatly benefited from moving conventional to nano-architecture electrodes. As regard to the nanophase anode, several attractive features favoring for efficient electrochemical Li-storage would be highly manifested for advanced LIBs as follows:1,14 (I) even better accommodation of the strain during Li+ insertion/removal; (II) intriguing reactivity triggering new reactions that are generally impossible for bulk materials; (III) larger electrode/electrolyte sur-/interface, resulting in sufficient electroactive sites; (IV) shorter path length for electronic transport; and (V) more convenient diffusion paths for ionic transportation. With these appealing perspectives, nanoscaled ZMO would be eagerly anticipated for advanced LIBs. In the past decades, numerous spinel ZMOs with diverse nanostructures, including nanoparticles (NPs),4,5,8 nanotubes (NTs),9 nanowires (NWs),10 nano-loaf architecture,15 etc., have been extensively fabricated, and applied as excellent electrode materials for high-performance LIBs. Nevertheless, these methods developed previously are generally very time- and/or energy-consuming as they commonly require multiple steps with some days and following long-time thermal treatment.4,5,8–10,15 Moreover, rigorous reaction conditions and/or special equipments10 are particularly needed even for some cases. For broad and successful industrial applications, it is therefore of great significance to explore and develop more rapid, low-cost and environment-friendly strategies for scale-up fabrication of nanoscaled ZMO with striking electrochemical Li-storage performance for LIBs.
With these considerations in mind, herein, we put forward a facile, ultrafast spray pyrolysis strategy to efficiently prepare nanophase ZMO with homogeneous composition from an aqueous spray solution containing manganous acetate and zinc acetate. More attractively, the synthetic methodology involves versatile advantages including ultrafast reaction process (only in seconds), high yield (∼100%), environmental friendliness (without NOx emission) and simple equipment requirements (just a tubular furnace). When utilized as anodes for LIBs, the product (designed as ZMO–W hereafter) synthesized with de-ionized (DI) water as solvent exhibited competitively cost-effective advantages, compared with those by utilizing absolute ethanol (AE) and ethylene glycol (EG) as solvents. Remarkably, the as-obtained ZMO–W demonstrated large specific discharge capacity, good rate capability, and excellent cycling stability even at 1 C rate.
2. Experimental
2.1 Materials synthesis
All the chemicals used here were of analytical grade. The precursor solution was beforehand prepared by dissolving 0.49 g of manganous acetate (Mn(CH3COO)2·4H2O, designed as Mn(AC)2) and 0.219 g of zinc acetate (Zn(CH3COO)2·2H2O, marked as Zn(AC)2) in 100 mL of DI water. The precursor solution was sprayed into a tubular furnace with a high temperature of 500 °C by a syringe pump with a high speed of 1 mL per second, as schematically illustrated in Fig. 1b. The product was directly collected for following electrochemical measurement without any following treatment. The yield of the product is ∼100%. For comparison, the same amount of Mn(AC)2 and Zn(AC)2 was dissolved into 100 mL of AE and EG, respectively, while other synthetic parameters remained unchanged. The as-obtained samples were thus denoted as ZMO–AE and ZMO–EG when the AE and EG were applied, respectively.2.2 Materials characterization
Crystallographic phases of the product were investigated by powder X-ray diffraction (Bruker, D8-Advance XRD, Cu Kα, λ = 1.5406 Å) over a 2θ range of 10–80°. The XRD profile was refined by the Rietveld program RIETAN-FP. The morphologies and structures of the resultant samples were observed by field-emission scanning electron microscope (FESEM, JEOL-6300F, 15 kV), transmission electron microscope (TEM), high-resolution TEM (HRTEM), and selected area electron diffraction (SAED) (JEOL JEM 2100 system operating at 200 kV). Measurement of SSA and analysis of porosity for the ZMO products were performed through measuring N2 adsorption–desorption isotherms at 77 K with an ASAP-2010 surface area analyzer. X-ray photoelectron spectroscopy (XPS) measurements were performed on a PHi5000 X-ray photoelectron spectrometer with an Al Ka excitation source (1486.6 eV). And the spectra were fitted with the XPSPEAK41 software.2.3 Electrochemical measurements
The working electrode consisted of the electroactive ZMO–W (ZMO–AE or ZMO–EG) sample, conductive material (acetylene black, Super-P-Li), and sodium carboxymethyl cellulose (CMC, average Mw: ∼250![[thin space (1/6-em)]](https://www.rsc.org/images/entities/char_2009.gif) 000) at a weight ratio of 70:20:10 with DI water as a solvent upon the copper foil substrate. The resultant slurry was uniformly spread onto pure Cu foil using a doctor blade, and dried in a vacuum oven overnight at 120 °C overnight. CR2032-type coin cells were fabricated by sandwiching a porous Cellgard 2400 separator between the working electrode and Li metal foil (Cyprus Foote Mineral, 99.98%, USA) in a high-purity Ar-filled glove box with both the moisture and the oxygen content below 0.5 ppm. The typical loading of electrode materials per electrode is ∼1.2 mg. The electrolyte used here was 1 M LiPF6 in a mixed solvent of ethylene carbonate (EC), dimethylcarbonate (DMC) and diethyl carbonate (DEC) (1:1:1, v/v/v) as the electrolyte. Galvanostatic discharge and charge cycling of the cells were conducted by using a CT2001A tester (Wuhan, China) at several different rates as indicated between cut-off potentials of 0.01 and 3.0 V (vs. Li/Li+). Cyclic voltammogram (CV) and electrochemical impedance spectroscopy (EIS) were performed by an IVIUM electrochemical workstation (the Netherlands).
000) at a weight ratio of 70:20:10 with DI water as a solvent upon the copper foil substrate. The resultant slurry was uniformly spread onto pure Cu foil using a doctor blade, and dried in a vacuum oven overnight at 120 °C overnight. CR2032-type coin cells were fabricated by sandwiching a porous Cellgard 2400 separator between the working electrode and Li metal foil (Cyprus Foote Mineral, 99.98%, USA) in a high-purity Ar-filled glove box with both the moisture and the oxygen content below 0.5 ppm. The typical loading of electrode materials per electrode is ∼1.2 mg. The electrolyte used here was 1 M LiPF6 in a mixed solvent of ethylene carbonate (EC), dimethylcarbonate (DMC) and diethyl carbonate (DEC) (1:1:1, v/v/v) as the electrolyte. Galvanostatic discharge and charge cycling of the cells were conducted by using a CT2001A tester (Wuhan, China) at several different rates as indicated between cut-off potentials of 0.01 and 3.0 V (vs. Li/Li+). Cyclic voltammogram (CV) and electrochemical impedance spectroscopy (EIS) were performed by an IVIUM electrochemical workstation (the Netherlands).
3. Results and discussion
3.1 Physicochemical characterization
During the spay pyrolysis in a tube furnace, both of the Mn(AC)2 and Zn(AC)2 were rapid decomposed at 500 °C, and simultaneously formed ZMO in seconds with just the emission of CO2 and gaseous water. Typical crystallographic phase of the as-prepared ZMO–W was first investigated by XRD technique. Fig. 1c shows the corresponding Rietveld refinement of wide-angle diffraction pattern for the ZMO–W. As evident, all the well-defined diffraction peaks, including not only the peak position, but also their relative intensities, can be observed obviously, and successfully indexed as a body-centered-tetragonal (bct) phase (a = 5.7399 Å, c = 9.2903 Å; space group I41/amd) with a distorted spinel structure (JCPDS no. 24-1133). Moreover, all refinements give a small value of corresponding factors, including Rwp of 9.16%, Rp of 7.31% and S of 1.91, indicative of a reliable structural analysis (Table S1, ESI†). One should particularly note that no peaks from other phases, such as, ZnO, MnOx and/or ZnxMnyOz, are detected. It strongly confirms the successful fabrication of single-phase ZMO with homogeneous composition by this simple strategy, unlike ultrasonic aerosol spray and flame spray pyrolysis synthesis,16,17 where simple mixed phases are often presented, rather than single-phase product. More attractively, when AE and EG were applied as solvents in a control experiment, both of the ZMO–AE and ZMO–EG demonstrate the successful formation of phase-pure ZMO structure (JCPDS no. 24-1133) (Fig. S1, ESI†).To further examine more detailed elemental makeup and specific oxidation state of the resulting ZMO–W, XPS measurement was further carried out. The as-obtained XPS data and corresponding fitted plots by using Gaussian fitting method were depicted in Fig. 2a–d. The survey photoelectron spectrum (Fig. 2a) shows the presence of Mn, Zn, O and C, of which the C species is examined, and should be reasonably ascribed to the carbonate species from the XPS instrument. As evidence in Fig. 2b, the peaks centered at binding energies (BEs) of 653.4 and 641.6 eV can be attributed to the Mn 2p1/2 and Mn 2p3/2, respectively. It is worth mentioning that the BE separation between the two is ∼11.8 eV, which is identified well with the Mn(III) in ZMO materials, as reported previously.4,18,19 Fig. 2c illustrates the Zn 2p spectra with BEs of 1044.3 and 1021.3 eV, which can be related to the Zn 2p1/2 and Zn 2p3/2, respectively. Additionally, the energy difference between the two peaks is ∼23 eV, which is in coincide with the report before for the Zn species in the ZMO phase,4,20 revealing the Zn(II) in the present specimen. The high-resolution spectrum of the O 1s region is further depicted in Fig. 2d, and accordingly de-convoluted into two peaks. More specifically, the fitted peak at a BE of 529.9 eV is typical of metal (Mn, Zn)–oxygen bond.4,21 And the well-resolved one sitting at 531.5 eV corresponds to a large number of defect sites with low oxygen coordination in the ZMO species with the nanoscaled dimension.4,22,23 The ratio of Mn to Zn is observed as ∼2.0 in the ZMO–W product, very closed to the designed ratio of Mn to Zn in the precursor solution.
 | ||
| Fig. 2 XPS spectra and fitted data of the as-obtained ZMO–W sample: (a) full scan, (b) Mn 2p, (c) Zn 2p and (d) O 1s. | ||
The low-magnification FESEM images of the as-obtained ZMO–W sample (Fig. S2a–c, ESI†) reveal that the as-prepared product is composed of loose micro-sized aggregation with a size of ∼30 μm, which are constructed by numerous NP subunits. When focused on the surface of the micro-aggregation (Fig. S2a–c†), porous structure can be observed evidently. Furthermore, closer inspection reveals the size of the NP building block is ranged in nanoscale of ∼20–30 nm, as seen in Fig. 3a. The specific micro-structure of as-synthesized ZMO–W is further elucidated by (HR)TEM examination. In good agreement with the above FESEM finding, nanoscaled and delicate NPs with rich inter-particle mesopores can be observed from the image displayed in Fig. 3b. Further HRTEM observation (Fig. 3c) evidences the clear resolved lattice fringes, which are calculated to be ∼0.48 and ∼0.25 nm, respectively, corresponding to the (101) and (211) crystalline planes of spinel ZMO, respectively. The SAED pattern (Fig. 3e) shows well-defined diffraction rings, suggesting its typical polycrystalline characteristics. Interestingly, as for the ZMO–AE (Fig. S3a and b†) and ZMO–EG (Fig. S3c and d†) products, both of the two also display similar morphologies with porous micrometer-sized aggregation of ∼18–20 μm in size.
 | ||
| Fig. 3 (a) FESEM, (b) TEM, (c) HRTEM images and (d) SAED pattern of the resultant ZMO–W product. | ||
To describe the porous feature and textural properties of the resultant ZMO products more clearly, N2 adsorption–desorption measurement was performed accordingly. The adsorption isotherms of the unique ZMO–W are demonstrated in Fig. 4a. The isotherm can be classified as the type IV according to the International Union of Pure and Applied Chemistry (IUPAC) classification. Notably, a distinct hysteresis loop is presented in the larger range of ∼0.55–1.0 P/P0, suggesting typical mesoporous structure of the ZMO–W in nature, which can be further supported by the Barrett–Joyner–Halenda (BJH) pore size distribution (PSD) in Fig. 4b. Apparently, the pore distribution is relatively narrow, and mainly ranged from 2 to 50 nm. Moreover, the BET SSA, average pore size and mesopore volume of the ZMO–W are quantitatively summarized as ∼13.4 m2 g−1, ∼18.7 nm and ∼0.08 cm3 g−1, respectively. According to the N2 sorption and PSD data of the ZMO–AE (Fig. S4, ESI†) and ZMO–EG (Fig. S5, ESI†), SSA and pore parameters of the two are also collected. In specific, the ZMO–AE sample owns BET SSA of ∼13.8 m2 g−1, average pore size of 18.6 nm and mesopore volume of ∼0.09 cm3 g−1, respectively, which are close to those for the ZMO–W. While as for the ZMO–EG, its SSA and pore volume increase up to ∼34.4 m2 g−1 and ∼0.2 cm3 g−1, respectively, and its average pore size is down to ∼16.6 nm meanwhile. As discussed above, it is easy to conclude that the utilization of AE has no obviously positive influence on the SSA and pore parameters of the as-prepared ZMO products, while the EG significantly enhances the SSA and pore volume of the ZMO sample. Anyway, the porous feature of the three would offer a sufficient sur-/interface to facilitate the electrochemical uptake and release of Li+ ions in contrast to the bulk materials, and also efficiently help for buffering the volume expansion/contraction over continuously cycling.
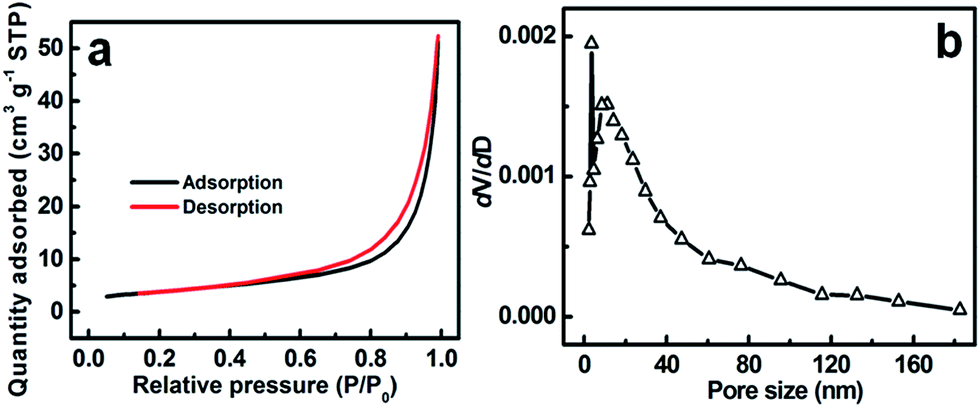 | ||
| Fig. 4 (a) N2 adsorption–desorption isotherms and (b) corresponding PSD data of the ZMO–W sample. | ||
3.2 Electrochemical performance
For the sake of confirming the potential application of the as-fabricated ZMO–W as anode for high-performance LIBs, the product was nextly configured as an anode in a half-cell to evaluate their electrochemical Li-storage properties, where lithium metal was used as counter and reference electrode. Potential sweep CV measurement was employed to characterize the electrochemical process of the ZMO–W, and corresponding E–I responses are depicted in Fig. 5a. The voltage was swept between 0.01 and 3.00 V (vs. Li/Li+) at a scanning rate of 0.01 mV s−1 for three cycles. In the first cathodic cycle, the CV curve shows a broad peak at approximately 1.2 V, which should be attributed to the reduction of Mn3+ to Mn2+, and the irreversible decomposition of the electrolyte solvent to form the solid electrolyte interphase (SEI) layers.7 Also of note, the strong peak sitting at ∼0.25 V is contributed by the reduction processes of Mn2+ and Zn2+ to metallic Mn0 and Zn0, respectively. And the broad and relative weak peaks observed below ∼0.25 V correspond to the formation of a ZnLi alloy. As a consequence, the first cathodic process can be thus summarized as the equation: ZnMn2O4 + 9Li+ + 9e− → ZnLi + 2Mn + 4Li2O. Over the following first anodic sweep, the wide oxidation peak at ∼0.5 V is attributed to the Li+ de-alloying from the ZnLi formed in the reductive sweep (i.e., ZnLi ↔ Zn + Li+ + e−). The peak centered at ∼1.2 V can be assigned to the oxidation of the metallic Mn0 to Mn2+ (that is, 2Mn + Li2O ↔ MnO + 2Li+ + 4e−), and the other one at ∼1.5 V can be ascribed to the oxidation of metallic Zn0 to Zn2+ (i.e., Zn + Li2O ↔ ZnO + 2Li+ + 2e−), coupled with the decomposition of the Li2O matrix.4,5,9,10,24,25 The anodic potential sweep is stopped at 3.00 V, which does not allow the further oxidation of Mn2+ to Mn3+ in the case of ZMO.26 It is noteworthy that the first CV profile presented here is apparently distinct from the subsequent two cycles. This is an unambiguous indication that a wholly distinct Li-storage mechanism is involved in the first cycle form the following ones. As seen in Fig. 5a, the cathodic peak shifts from 0.25 to 0.5 V, which is associated with the structural rearrangement.9,11,18,27 Since the nano-domains of ZnLi, Mn, and Li2O are obtained after the first lithiation, the oxidation potential does not change significantly between the first and second delithiation (oxidation) any more.24 Accordingly, the following anodic peaks are similar to what is observed in the first scan, revealing identical electrochemical reactions for the subsequent anodic scans.15,26,28 Also, no noticeable change in the oxidation and reduction currents between the 2nd and 3rd cycles, indicating high reversibility and good structural durability of the anode after the 1st one.29 | ||
| Fig. 5 Electrochemical characterizations of the resultant ZMO–W anode: (a) CV curves between 3.00 and 0.01 V (vs. Li/Li+) at a scan rate of 0.01 mV s−1; (b) charge–discharge profiles at a rate of 0.1 C; (c) rate performance; (d) long-term capacity vs. cycle number at 1.0 C rate. | ||
Fig. 5b shows the typical charge–discharge profiles of the ZMO–W electrode for the 1st, 2nd, 5th and 10th cycles with a current rate of 0.1 C (assumed 1.0 C = 784 mA g−1) over a potential cut-off of 0.01–3.00 V (vs. Li/Li+), respectively. The first voltage–capacity profiles of the ZMO–W electrode present two apparent voltage plateaus in applied potential range. The first voltage plateau at ∼1.29 V is related to the reducing of Mn3+ to Mn2+, the second plateau at ∼0.45 V is ascribed to the formation of Mn0, Zn0 and Li–Zn alloy. It is the three electrochemical processes including intercalation, conversion reaction and alloy reaction of Li and Zn that deliver a large initial specific capacity of 1276 mA h g−1 (∼11.2 molar of Li+ per mole ZMO), which is much higher than those of the reported ZMO NTs (∼1198 mA h g−1),9 hollow ZMO spheres (1261 mA h g−1),19 ZMO NPs (∼1200–1230 mA h g−1),26,30 and ZMO nanoflakes (1088 mA h g−1).11 One also note that the first discharge capacity is totally larger than the predicted theoretical capacity, which corresponds to 9 Li+ per formula, and the extra capacity should be partially attributed to a contribution from the interfacial storage among the metal and/or metal oxide NPs, and the SEI formation owing to the nanophase nature of the ZMO–W.4,31 The first charge (i.e., de-lithiation process) curve illustrates a stead and smooth voltage increase from 0.01 to 3.00 V (vs. Li/Li+), and the overall charging capacity is calculated as ∼817 mA h g−1. Thus, there is an irreversible capacity loss of ∼459 mA h g−1 between the first discharge and charge cycles, as a consequence, the initial Coulombic efficiency (CE) is ∼64%, which is somewhat higher than ZMO NRs (∼61.8%),15 NPs (∼60% (ref. 4) or 43% (ref. 26)), NTs (∼59.5%),9 etc. Appealingly, the 2nd discharge profile shows a specific capacity of ∼815 mA h g−1 (∼7.1 molar of Li+ per ZMO formula), and the second-charge curve resembles the first-charge one but shows slightly low capacity value and a higher plateau voltage. The subsequent discharge–charge profiles exhibit qualitative resemblance to that of the 2nd cycle curve except for the gradually decreasing capacities. Even after cycling up to 10th cycle, the discharge and charge capacities still remain as high as ∼765 and ∼754 mA h g−1, respectively, and the CE of the ZMO–W anode increases up to 98.6% meantime.
The high-rate electrochemical performance of the obtained ZMO–W was also explored. Fig. 5c displays the corresponding rate capacity of the anode at 0.1 C, 0.2 C, 0.4 C, 0.7 C and 1.0 C, respectively. Clearly, after initial 20 cycles at 0.1 C rate, the discharge capacity is rapidly down to ∼767 mA h g−1, and then, the average specific capacities are stably maintained as ∼730.3, ∼723.5, ∼687.2 and ∼683.1 mA h g−1 at the current rates of 0.2 C, 0.4 C, 0.7 C and 1.0 C, respectively. More remarkably, the capacity retention of the ZMO–W at 1.0 C is ∼89.1% of the specific capacity at the 20th cycle with 0.1 C, suggesting its appealing rate performance, which is of great significance to its practical applications for high-power LIBs as a promising anode material.
Fig. 5d illustrates the capacity vs. cycle number curves of the resulting ZMO–W anode between 0.01 and 3.00 V at 1.0 C rate for 100 cycles. Of note, the discharge capacity first decreases rapidly during the first ∼20 cycles from ∼1024 to ∼540 mA h g−1. Hereafter, the discharge capacity exhibits a relatively stable cycling performance, and maintains at ∼500 mA h g−1. Interestingly, after cycling for 70 cycles, the capacity begins to gradually grow again. Such phenomenon is commonly observed for TMOs-based anodes, and generally ascribed to the reversible formation of a polymeric gel-like film originating from kinetic activation in the electrode.4,13,15,25,32 More impressively, after cycling for 100 times, the ZMO–W electrode still can deliver a discharge capacity as large as ∼610 mA h g−1, that is, an average capacity degradation of only ∼4.0% per cycle. Furthermore, corresponding CE variation over continuous cycling is also shown in Fig. 5d. Strikingly, the CE of the ZMO–W anode is ∼60% in the first cycle at 1.0 C rate, while it quickly increases up to ∼95% for the 2nd cycle, and then basically kept >99.2% over the following consecutive cycles. Electrochemical impedance measurements were further performed, and the ZMO–W cell is hold at 3.00 V (vs. Li/Li+, charged state) for 2 h before recording the EIS data. Fig. 6 shows typical impedance spectra of the bare electrode, as well as the charged electrode at the 1st, 2nd, 5th and 50th cycles, respectively, in the form of Nyquist plots (Z′ vs. −Z′′, where Z′ and Z′′ are the real and imaginary parts of the complex impedance, respectively). All the diameters of the semicircle in the high-medium frequency region for the cycled electrodes are even smaller than that of the fresh electrode, as seen in Fig. 6a, indicating that the cycled electrodes possess faster charge transfer than that of the fresh electrode. Also, with cycling, the intersections of these EIS plots with the X-axis are basically ranged from ∼5 to 9 Ohm irrespective of cycle number, as demonstrated in Fig. 6b, which implies that the electrode integrity can be maintained well upon cycling. Therefore, the EIS data mentioned here can be well responsible for the excellent cycling stability and appealing rate capability of the ZMO–W anode above.
 | ||
| Fig. 6 EIS data (a) of the ZMO–W sample. The (b) is the enlarged one for the red circle region in panel (a). | ||
Cycling performance of the obtained ZMO–AE and ZMO–EG anodes was further investigated between 0.01 and 3.00 V at 1.0 C rate for 100 cycles (Fig. S6, ESI†). A similar case to that of ZMO–W occurs with the ZMO–AE electrode (Fig. S6a, ESI†). The 1st discharge capacity of the ZMO–AE is ∼1021 mA h g−1, very close to that for the ZMO–W anode, while the capacity just can maintain as ∼582 mA h g−1 after continuously cycling for 100 times. Remarkably, the ZMO–EG anode (Fig. S6b, ESI†) delivers a large initial capacity of ∼1100 mA h g−1, and maintains it as high as ∼608 mA g−1 after 100 cycles at 1.0 C rate. Additionally, the initial CEs of the ZMO–AE and ZMO–EG are observed as ∼59.8% and ∼59%, respectively. As discussed above, the ZMO–EG product exhibits the largest initial discharge capacity of the three ZMO samples, maybe owing to its highest SSA, and similar changing tendency of capacity with cycle number meanwhile. Nevertheless, taking the high cost of AE and EG, and the electrochemical performance of the three into account, one easily draws a conclusion that the ZMO–W is a promising alternative anode with competitively cost-effective advantages for advanced next-generation LIBs once again.
4. Conclusions
In conclusion, we developed a facile, ultrafast yet green spray pyrolysis strategy to elegantly fabricate nanophase ZMO with homogeneous composition from a spray solution containing manganous acetate and zinc acetate. The ZMO–W sample exhibited intriguing cost-effective advantages, when compared to ZMO–AE and ZMO–EG. Furthermore, the resultant ZMO–W displayed high initial discharge capacity of ∼1023 mA h g−1, good rate capability, and excellent cycling stability with average capacity degradation of only ∼4.0% per cycle at 1.0 C rate. More significantly, our work opens up the great possibility for low-cost, large-scale and rapid fabrication of advanced ZMO and even other binary TMO products for practical industrial applications, benefiting from the appealing advantages involved in the synthetic methodology we put forward here, including ultrafast reaction process, high reaction yield, environmental friendliness and simple equipment requirements.Acknowledgements
The authors acknowledge the financial support from National Natural Science Foundation of China (no. 51202004). Anhui Province Funds for Distinguished Young Scientists (no. 1508085J09), the Natural Science Foundation of Anhui Province (no. KJ2013A051), the Foundation for Young Talents in College of Anhui Province, and the Opening Project of CAS Key Laboratory of Materials for Energy Conversion (no. 2014001).Notes and references
- C. Z. Yuan, H. B. Wu, Y. Xie and X. W. Lou, Angew. Chem., Int. Ed., 2014, 53, 1488 CrossRef CAS PubMed.
- L. Zhou, D. Y. Zhao and X. W. Lou, Adv. Mater., 2012, 24, 745 CrossRef CAS PubMed.
- F. M. Courte, H. Duncan, Y. Abu-Lebdeh and I. J. Davidson, J. Mater. Chem., 2011, 21, 10206 RSC.
- C. Z. Yuan, L. H. Zhang, L. R. Hou, G. Pang and L. Lian, Chem.–Eur. J., 2014, 21, 1262 CrossRef PubMed.
- L. W. Yin, Z. W. Zhang, Z. Q. Li, F. B. Hao, Q. Li, C. X. Wang, R. H. Fan and Y. X. Qi, Adv. Funct. Mater., 2014, 24, 4176 CrossRef CAS.
- W. Luo, X. L. Hu, Y. M. Sun and Y. H. Huang, J. Mater. Chem., 2012, 22, 8916 RSC.
- W. Luo, X. L. Hu, Y. M. Sun and Y. H. Huang, ACS Appl. Mater. Interfaces, 2013, 5, 1997 CAS.
- Y. Y. Yang, Y. Q. Zhao, L. F. Xiao and L. Z. Zhang, Electrochem. Commun., 2008, 10, 1117 CrossRef CAS PubMed.
- J. G. Kim, S. H. Lee, Y. M. Kim and W. B. Kim, ACS Appl. Mater. Interfaces, 2013, 5, 11321 CAS.
- P. F. The, Y. Sharma, Y. W. Ko, S. S. Snellius and M. Srinivasan, RSC Adv., 2013, 3, 2812 RSC.
- Y. Deng, S. D. Tang, Q. M. Zhang, Z. Shi, L. Zhang, S. Zhang and G. H. Chen, J. Mater. Chem., 2011, 21, 11987 RSC.
- Z. Q. Li, B. Li, L. W. Yin and Y. X. Qi, ACS Appl. Mater. Interfaces, 2014, 6, 8098 CAS.
- L. R. Hou, L. Lian, L. H. Zhang, G. Pang, C. Z. Yuan and X. G. Zhang, Adv. Funct. Mater., 2014, 25, 238 CrossRef.
- A. S. Arico, P. Bruce, B. Scrosati, J. M. Tarascon and W. Van Schalkwijk, Nat. Mater., 2005, 4, 366 CrossRef CAS PubMed.
- Z. C. Bai, N. Fan, C. H. Sun, Z. C. Ju, C. L. Guo, J. Yang and Y. T. Qian, Nanoscale, 2013, 5, 2442 RSC.
- C. H. Li, T. Ming, J. X. Wang, J. F. Wang, J. C. Yu and S. H. Yu, J. Catal., 2014, 310, 84 CrossRef CAS PubMed.
- Y. F. Li, Y. J. Hu, J. C. Huo, H. Jiang, C. Z. Li and G. J. Huang, Ind. Eng. Chem. Res., 2012, 51, 11157 CrossRef CAS.
- S. W. Kim, H. W. Lee, P. Muralidharan, D. H. Seo, W. S. Yoon, D. K. Kim and K. Kang, Nano Res., 2011, 4, 505 CrossRef CAS PubMed.
- X. F. Chen, L. Qie, L. L. Zhang, W. X. Zhang and Y. H. Huang, J. Alloys Compd., 2013, 559, 5 CrossRef CAS PubMed.
- H. Lv, L. Ma, P. Zeng, D. Ke and T. Peng, J. Mater. Chem., 2010, 20, 3665 RSC.
- C. Z. Yuan, J. Y. Li, L. R. Hou, J. D. Lin, X. G. Zhang and S. L. Xiong, J. Mater. Chem. A, 2013, 1, 11145 CAS.
- V. M. Jimenez, A. Fernandez, J. P. Espinos and A. R. Gonzalez-Elipe, J. Electron Spectrosc. Relat. Phenom., 1995, 71, 61 CrossRef CAS.
- C. Z. Yuan, J. Y. Li, L. R. Hou, X. G. Zhang, L. F. Shen and X. W. Lou, Adv. Funct. Mater., 2012, 22, 4592 CrossRef CAS.
- L. Zhou, H. B. Wu, T. Zhu and X. W. Lou, J. Mater. Chem., 2012, 22, 827 RSC.
- C. Z. Yuan, J. Y. Li, L. R. Hou, L. H. Zhang and X. G. Zhang, Part. Part. Syst. Charact., 2014, 31, 657 CrossRef CAS.
- F. M. Courtel, Y. Abu-Lebdeh and I. J. Davidson, Electrochim. Acta, 2012, 71, 123 CrossRef CAS PubMed.
- L. Xiao, Y. Yang, J. Yin, Q. Li and L. Zhang, J. Power Sources, 2009, 194, 1089 CrossRef CAS PubMed.
- J. Zhao, F. Wang, P. Su, M. Li, J. Chen, Q. Yang and C. Li, J. Mater. Chem., 2012, 22, 13328 RSC.
- J. Liu, Y. Li, H. Fan, Z. Zhu, J. Jiang, R. Ding, Y. Hu and X. Huang, Chem. Mater., 2010, 22, 212 CrossRef CAS.
- S. H. Choi and Y. C. Kang, Int. J. Electrochem. Sci., 2013, 8, 6281 CAS.
- P. F. The, Y. Sharma, S. S. Pramana and M. Srinivasan, J. Mater. Chem., 2011, 21, 14999 RSC.
- G. Q. Zhang, L. Yu, H. B. Wu, H. E. Hoster and X. W. Lou, Adv. Mater., 2012, 24, 4609 CrossRef CAS PubMed.
Footnote |
| † Electronic supplementary information (ESI) available: FESEM image, XRD patterns, N2 sorption data and electrochemical performance of the controlled experiments. See DOI: 10.1039/c4ra15898a |
| This journal is © The Royal Society of Chemistry 2015 |