Effect of oxidants on photoelectrocatalytic decolourization using α-Fe2O3/TiO2/activated charcoal plate nanocomposite under visible light
Baharak Ayoubi-Feiza,
Soheil Aber*a and
Mohsen Sheydaeib
aResearch Laboratory of Environment Protection Technology, Department of Applied Chemistry, Faculty of Chemistry, University of Tabriz, Tabriz, Iran. E-mail: soheil_aber@yahoo.com; Fax: +98 41 33340191; Tel: +98 41 33393153
bFaculty of Chemistry, Kharazmi (Tarbiat Moallem) University, Tehran, Iran
First published on 9th February 2015
Abstract
The present study is to investigate the effect of oxidants H2O2, S2O82−, BrO3−, ClO3− and IO4− with different concentrations on photoelectrocatalytic decolourization of Lanasol yellow 4G (LY4G) as a model contaminant using α-Fe2O3/TiO2/activated charcoal plate (ACP) nanocomposite under visible light. In this system, the decolourization efficiency increased with increasing BrO3−, ClO3− and IO4− doses but reached an optimum amount with H2O2 and S2O82− at 1 mM. Experimental data revealed that the decolourization rate of LY4G in all of the processes obeyed pseudo-first-order kinetics. Total organic carbon (TOC) results indicated that 21% and 100% of organic substrate were mineralized respectively after 80 min and 8 h. The gas chromatography-mass spectrometry (GC-MS) analysis was employed to identify the intermediate products. Also, a plausible degradation pathway was proposed. Finally, the real wastewater treatment was investigated by chemical oxygen demand (COD) measurements.
1. Introduction
Advanced oxidation processes (AOPs) are a group of available and promising processes for the removal of almost all organic pollutants in water and wastewater.1 AOPs are processes in which reactive radicals are produced under different sources of energy such as electrical2 or chemical3 energy. These radicals are involved in effective removal of persistent hazardous organic pollutants or changing the pollutants into less toxic intermediates.4 The rate constants of the oxidative reactions between these radicals and organic compounds are approximately 106 to 109 M−1 S−1. This high reaction rate has been attributed to their high oxidative power (1.90 V versus normal hydrogen electrode (NHE)).5,6Heterogeneous photocatalytic degradation process via photoactivation of semiconductors such as TiO2, ZnO and ZnS is considered as one of the most promising AOPs for destruction of water-soluble, non-biodegradable organic pollutants. UV light has been normally used as an energy source in this process. During photocatalytic degradation process, the photocatalyst absorbs energy from irradiated light. This energy leads to the excitation of electrons (e−) from valence band (VB) of photocatalyst into the conduction band (CB) and development of holes (h+) in the VB. The reaction of h+ with H2O and/or OH− causes to generate reactive radicals.7
Among various photocatalysts, there is meaningful attention on using TiO2 as an effective and suitable photocatalyst for the degradation of organic pollutants because of its particular properties including: low toxicity, chemical stability, insolubility and low price.8,9 However, some problems are associated with photocatalytic degradation process in the presence of TiO2. The basic problem is higher tendency of photogenerated e−/h+ to recombine rather than contribution in the formation of reactive radicals which imposes low efficiency of photocatalytic degradation.10 The second problem is the wide band gap of TiO2 (3.2 eV), so only UV light can be utilized to promote the e− from the CB to the VB of this semiconductor.11 The third problem is separation of TiO2 powders from batch slurry photoreactor after photocatalytic process.12 Numerous efforts have been made to overcome the problems and promote the efficiency of photocatalytic degradation process.
The aim of this work is to enhance photocatalytic performance of TiO2 nanoparticles by solving all of the mentioned problems simultaneously through: (1) impregnating TiO2 nanoparticles with hematite (α-Fe2O3). This iron oxide has a band gap of 2.2 eV, therefore it is an appropriate sensitizer for TiO2 to improve the photocatalytic properties under visible light irradiation in addition to its ability to inhibit the recombination of the photogenerated e−/h+ (ref. 13) (2) immobilization of these nanoparticles on the surface of activated charcoal plate (ACP) as a conductive support material and applying an anodic bias to drive away photogenerated electrons from the surface of TiO2 and inhibit the e−/h+ recombination, (3) using inorganic oxidants with efficient electron accepting properties to trap the promoted e− from VB of TiO2, avoid e−/h+ recombination, generate more reactive radicals and other oxidizing species, and consequently enhance the photocatalytic degradation efficiency.14
With this background, in the present study α-Fe2O3 and TiO2 nanoparticles were immobilized on the surface of the ACP (denoted as α-Fe2O3/TiO2/ACP). The photoelectrocatalytic performance of the α-Fe2O3/TiO2/ACP nanocomposite in decolourization of Lanasol yellow 4G (LY4G) solution in the presence of H2O2, S2O82−, BrO3−, IO4−, and ClO3− was evaluated under visible light irradiation. Mineralization of dye and the produced intermediates were studied by total organic carbon (TOC) removal and gas chromatography-mass spectrometry (GC-MS), respectively. Finally, chemical oxygen demand (COD) analysis was employed to investigate the mineralization of real textile wastewater contains LY4G.
2. Experimental
2.1. Materials
Charcoal as a cheap and easily available material was purchased from a local market in Tabriz, Iran. TiO2 P25 powder with an average size of 20–30 nm (Degussa, Germany), α-Fe2O3 powder with an average diameter of 20–40 nm (US Research Nanomaterials, Inc., USA), LY4G (Ciba-Geigy Co., Switzerland), potassium bromate, (KBrO3, 99%, Fluka), potassium peroxydisulfate, (K2S2O8, 98%, Fluka), potassium chlorate, (KClO3, 99%, Fluka), potassium periodate (KIO4, 99.8%, Fluka), and hydrogen peroxide (H2O2, 30% w/w, Merck) were used in this work. All other chemicals were of analytical reagent grade.2.2. Preparation and characterization of α-Fe2O3/TiO2/ACP nanocomposite
The ACP electrode with the dimensions of 5.7 cm × 3.1 cm × 1.1 cm was produced by physical activation of charcoal under CO2 atmosphere at 850 °C using the method described in our previous work.7 The produced ACP was soaked in 2-propanol solution before the immobilization of TiO2 and α-Fe2O3 on its surface. Simultaneously, 0.18 g of TiO2 and α-Fe2O3 powders mixture were dispersed in 60 mL of 2-propanol solution containing 0.07 g Mg(NO3)2·6H2O as electrolyte.15 The suspension was sonicated for 1 h using an ultrasonic bath (Grant, XB6, England). An electrophoretic cell was designed which consisted of a 150 mL beaker, the prepared ACP electrode as cathode and stainless steel with the dimensions of 6 cm × 4 cm as anode. The electrodes were placed horizontally with a 5 mm distance of each other. During the electrophoretic deposition, constant deposition voltage of 40 V was applied by a DC power supplier (Micro, Iran) for 7 min. Finally, the prepared nanocomposite was dried at room temperature for 24 h.Scanning electron microscopy (SEM) image and energy dispersive X-ray (EDX) analysis of α-Fe2O3/TiO2/ACP surface were performed using a MIRA3 FEG-SEM (Tescan, Czech) microscope. The compositions of the nanocomposite were detected by X-ray fluorescence (XRF) using a Philips model PW1480 (the Netherlands) instrument. The Brunauer–Emmett–Teller (BET) surface area of the ACP and α-Fe2O3/TiO2/ACP nanocomposite was determined through N2 adsorption at 77 K in the relative pressure range from 0.05 to 0.9 using a Belsorp-Mini (Japan) surface analyser. UV-visible diffuse reflectance spectra (DRS) of TiO2/ACP and α-Fe2O3/TiO2/ACP nanocomposite samples were measured by using Sinco (S4100, Korea) UV-visible spectrophotometer. Furthermore, photoluminescence emission spectra of TiO2/ACP and α-Fe2O3/TiO2/ACP nanocomposites were recorded with an excitation wavelength of 285 nm on a spectrofluorometer (Jasco, FP-6200, Japan).
2.3. Decolourization experiments
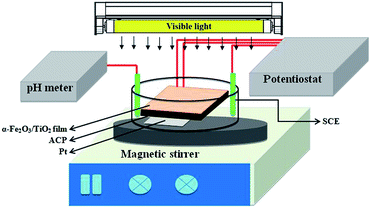
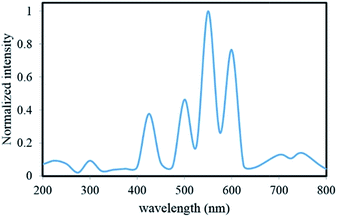
Fig. 1 shows the experimental set up of the photoreactor used for the treatment of the contaminated solution. It was composed of a round Pyrex reactor with the capacity of 150 mL, a magnetic stirrer, a pH meter (Eutech pH 510, Malaysia), a potentiostat (CV 320-xh, Hirad, Iran), a visible light lamp (9 W, Nama Noor Co., Iran) with intense emission lines at 425, 500, 550 and 600 nm (Fig. 2) on the top of the reactor, the prepared α-Fe2O3/TiO2/ACP as working electrode, Pt plate (3 cm × 3 cm) as counter electrode and a saturated calomel electrode (SCE) (+0.24 V vs. standard hydrogen electrode) as reference electrode. The working and counter electrodes were held horizontally in parallel by a 5 mm distance. All of the experiments were done with a constant α-Fe2O3/TiO2/ACP nanocomposite electrode (12.60 g). During the experiments, a constant voltage of 700 mV was applied to this electrode vs. SCE. The distance between the visible light lamp and the solution surface was 5 cm. The total solution volume was 115 mL and it consisted of 10 mg L−1 LY4G, 8 g L−1 Na2SO4 as electrolyte and different amounts of the oxidant. The initial concentration of the oxidant in the solution ranged from 0.5 to 5 mM. All over the decolourization experiments, pH of the solution was adjusted to 6 ± 0.3 by H2SO4 and NaOH solutions. 2 mL sample was withdrawn at predetermined time intervals and immediately after measuring the concentration of the residual LY4G in the solution by UV-visible spectroscopy (Perkin-Elmer 550 SE) at λmax equal to 419 nm, the sample was returned to the reactor.Decolourization efficiency (%) = [(C0 − Ct)/C0] × 100 was used to determine the percent of decolourization of LY4G, where C0 (mg L−1) is the initial concentration of LY4G and Ct (mg L−1) is its concentration after certain irradiation time.
It is noted that after each photoelectrocatalytic degradation run, the used nanocomposite was regenerated by applying reverse voltage of −240 mV in 0.01 M NaOH solution with the volume of 115 mL (electrodesorption). This process lasted for 30 min.
2.4. Characterization techniques on the solution
GC-MS was used in order to identify produced intermediates during photoelectrocatalytic process. N,O-Bis-(trimethylsilyl) acetamide was used after extraction of intermediates to obtain silylated compounds. These compounds could be detected more convenient by GC-MS method. The GC-MS equipped with an Agilent 6890 gas chromatograph with a 30 m to 0.25 mm HP-5MS capillary column and an Agilent 5973 mass spectrometer (Agilent Technologies, Palo Alto, Canada). The value of TOC in the solution was analysed with a TOC analyser (TOC, VCHS, Shimadzu, Japan). In order to check the leaching of iron during treatment process, the amount of total iron was analysed after photoelectrocatalytic experiments in the solution by colorimetric method using 1,10-phenantroline.162.5. Treatment of real textile wastewater
To compare the decolourization efficiency in the real textile wastewater with the synthetic dye solution, the photoelectrocatalytic experiment for the removal of LY4G from the real wastewater was done according to Section 2.3 without adding any electrolyte due to the wastewater conductivity. The wastewater sample containing LY4G was obtained from Farsh & Patu textile factory in Tabriz, Iran. Concentration of LY4G, COD, pH, and conductivity of filtered wastewater were 29 mg L−1, 330 mg L−1, 6.5 and 2.21 mS cm−1, respectively.3. Results and discussion
3.1. Morphology and characterization of α-Fe2O3/TiO2/ACP
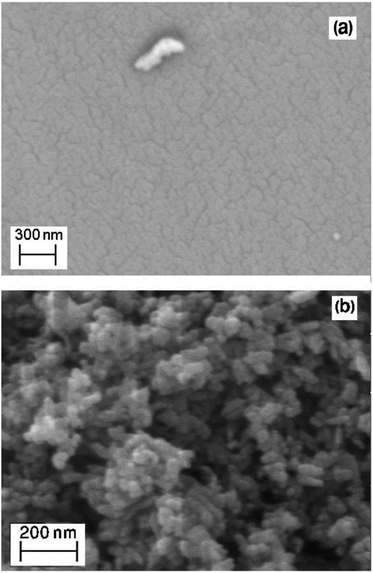
The morphology of the ACP and α-Fe2O3/TiO2/ACP nanocomposite is illustrated in Fig. 3. The SEM micrograph of α-Fe2O3/TiO2/ACP nanocomposite (Fig. 3b) showed the deposition of TiO2 and α-Fe2O3 particles on the surface of ACP compared with that of non-coated ACP (Fig. 3a). The EDX microanalyses of the α-Fe2O3/TiO2/ACP nanocomposite are listed in Table 1. It can be clearly seen that this nanocomposite was rich in carbon, oxygen, titanium and iron which approved the immobilization of TiO2 and α-Fe2O3 nanoparticles on the surface of the ACP. Furthermore, existing a low amount of Mg in EDX microanalyses may be attributed to Mg(NO3)2 salt which was used as the electrolyte in the electrophoretic deposition method.| Elements | C | O | Ti | Fe | Mg | Total (%) |
|---|---|---|---|---|---|---|
| Weight (%) | 5.11 | 38.71 | 36.84 | 17.45 | 1.89 | 100 |
| Atomic (%) | 13.37 | 59.25 | 18.83 | 7.65 | 0.90 | 100 |
Results obtained from XRF analysis indicated that chemical compositions of the prepared nanocomposite include 6.8% TiO2, 4.1% Fe2O3, 1% MgO, 86.1% C and 2% other compounds.
Specific surface area of the ACP and the α-Fe2O3/TiO2/ACP nanocomposite samples were 462 m2 g−1 and 291.4 m2 g−1, respectively. The reduced surface area of the α-Fe2O3/TiO2/ACP is mainly due to the immobilization of TiO2 and α-Fe2O3 nanoparticles within the porous structure of the ACP.17
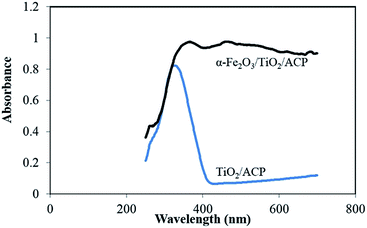
Reflectance spectra of TiO2/ACP and α-Fe2O3/TiO2/ACP nanocomposite samples are shown in Fig. 4. It can be seen that the absorption for α-Fe2O3/TiO2/ACP was higher than that of TiO2/ACP in the range of 400–700 nm. This makes it possible to use the α-Fe2O3/TiO2/ACP as a photoactive catalyst under visible light irradiation in the photoelectrocatalytic process.
As shown in Fig. 5, the photoluminescence intensity of α-Fe2O3/TiO2/ACP nanocomposite was lower than that of TiO2/ACP nanocomposite. This indicates that separation of photogenerated charge in α-Fe2O3/TiO2/ACP sample was higher than TiO2/ACP.18
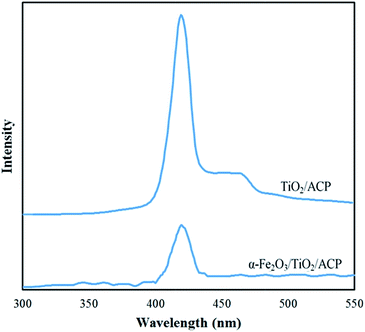 | ||
| Fig. 5 Photoluminescence spectra of TiO2/ACP and α-Fe2O3/TiO2/ACP nanocomposites excited by 285 nm irradiation. | ||
3.2. Decolourization process
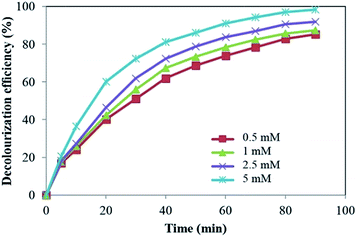
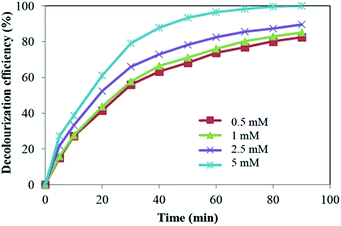
In this process, the effect of inorganic oxidants such as H2O2, S2O82−, BrO3−, ClO3− and IO4− with different dosages (0.5 to 5 mM) was investigated on the photoelectrocatalytic decolourization of LY4G by α-Fe2O3/TiO2/ACP nanocomposite under visible light.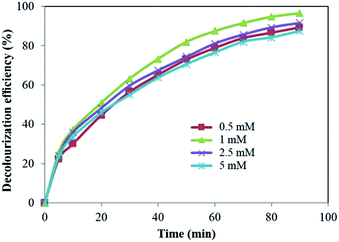 | ||
| Fig. 6 Effect of H2O2 on the decolourization efficiency of LY4G ([dye]0 = 10 mg L−1, voltage = 700 mV, pH = 6, and [Na2SO4] = 8 g L−1). | ||
H2O2 is contributed in decolourization process through three basic ways. The first is the trapping of e− in conduction band of TiO2 (eqn (1)) in order to decrease e−/h+ recombination.19 The second is the reaction of H2O2 with the superoxide radical anion forming ˙OH (eqn (2)).20 The other way is the reaction with heterogeneous Fe3+ on the surface of α-Fe2O3 to produce reactive radicals (eqn (3) and (4)).21
| H2O2 + eCB− → OH− + ˙OH | (1) |
| H2O2 + O2˙− → OH− + ˙OH + O2 | (2) |
| Feα-Fe2O33+ + H2O2 → Feα-Fe2O32+ + HO2˙ + H+ | (3) |
| Feα-Fe2O32+ + H2O2 → Feα-Fe2O33+ + HO˙ + OH− | (4) |
As can be seen in Fig. 6, further increase in the initial H2O2 concentration led to decrease in decolourization efficiency. It is well known that in the presence of excess H2O2, the amount of available ˙OH decreases due to the scavenger effect of H2O2 on ˙OH which leads to the production of other radicals with low oxidation potential such as HO2˙ (eqn (5)).22,23 In addition, H2O2 is a hole scavenger (eqn (6)) and at high concentrations suppresses the contribution of photogenerated holes in reaction with H2O and/or OH− leading to a decrease in OH free radical concentration.24
| H2O2 + ˙OH → H2O + HO2˙ | (5) |
| H2O2 + 2hVB+ → O2 + 2H+ | (6) |
Similar result has been reported by Govindan et al.25 for photocatalytic degradation of pentachlorophenol by visible light sensitive N–F-codoped TiO2 photocatalyst. They investigated the effect of H2O2 concentration from 0.02 to 0.14 mM and obtained a high degradation at 0.1 mM.
| S2O82− + eCB− → SO4˙− + SO42− | (7) |
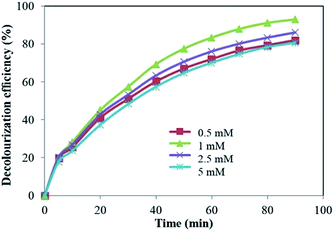 | ||
| Fig. 7 Effect of S2O82− concentration on the decolourization efficiency of LY4G ([dye]0 = 10 mg L−1, voltage = 700 mV, pH = 6, and [Na2SO4] = 8 g L−1). | ||
The SO4˙− can react with organic molecules by three different mechanisms: electron transfer, hydrogen abstraction and addition on double bond.26 This radical also convert H2O to ˙OH according to eqn (8):
| SO4˙− + H2O → SO42− + ˙OH + H+ | (8) |
As can be seen in Fig. 7, further increase in S2O82− concentration from 1 mM to 5 mM led to a decrease in decolourization efficiency. This can be attributed to more increase in concentration of SO4˙−. Excessive SO4˙− can act as HO˙ and SO4˙− scavenger, reducing the degradation efficiency (eqn (9) and (10)).27,28 Similar result has been reported for sonochemical degradation of Rhodamine B, Methylene Blue, Acid Orange II and Acid Scarlet Red 3R dyes in aqueous solution using sulphate radicals activated by immobilized cobalt ions.29
| SO4˙− + ˙OH → SO42− + 0.5O2 + H+ | (9) |
| SO4˙− + SO4˙− → S2O82− | (10) |
| IO4− + 8eCB− + 8H+ → 4H2O + I− | (11) |
| BrO3− + 6H+ + 6eCB− → Br− + 3H2O | (12) |
| BrO3− + 2H+ + eCB− → BrO2˙ + H2O | (13) |
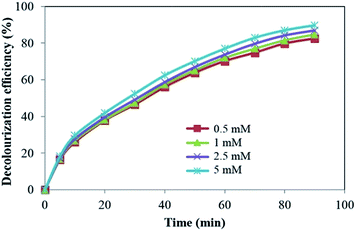 | ||
| Fig. 10 Effect of ClO3− on the decolourization efficiency of LY4G ([dye]0 = 10 mg L−1, voltage = 700 mV, pH = 6, and [Na2SO4] = 8 g L−1). | ||
As it has been indicated in Fig. 10, decolourization efficiency increased gently with increasing the initial ClO3− concentration from 0.5 to 5 mM. Like to the other investigated inorganic oxidants, ClO3− causes to separation of e−/h+ by accepting the conduction band electron through eqn (14).33 More increase in the initial ClO3− concentration led to the enhancement of reactive radicals production through the reaction of h+ with H2O and/or OH− in solution. Similar result has been reported by Seyed-Dorraji et al. in UV/ZnO/ClO3− system for the removal of diazinon.33
| ClO3− + 6H+ + 6eCB− → Cl− + 3H2O | (14) |
3.3. Kinetic study and comparing the oxidants
Pseudo-first-order kinetic equation is most widely used to describe heterogeneous photocatalysis reactions.34 Therefore, the experimental data of decolourization of LY4G in visible light/α-Fe2O3/TiO2/ACP system at different time intervals were examined to fit pseudo-first-order kinetic model. The rate constant values, k (min−1), as a function of oxidants concentration were calculated from the slopes of the straight-line portion of the pseudo-first-order plots of ln(C0/Ct) against t where, C0 (mg L−1) is the initial concentration of dye and Ct (mg L−1) is the concentration at time t. The obtained results are listed in Table 2.| Parameter | Concentration (mM) | k × 100 (min−1) | R2 |
|---|---|---|---|
| With the absence of oxidant | — | 1.72 | 0.995 |
| H2O2 | 0.5 | 2.41 | 0.997 |
| 1 | 3.57 | 0.994 | |
| 2.5 | 2.62 | 0.996 | |
| 5 | 2.19 | 0.994 | |
| S2O82− | 0.5 | 1.86 | 0.990 |
| 1 | 2.94 | 0.999 | |
| 2.5 | 2.15 | 0.995 | |
| 5 | 1.81 | 0.994 | |
| IO4− | 0.5 | 2.10 | 0.997 |
| 1 | 2.33 | 0.993 | |
| 2.5 | 2.84 | 0.996 | |
| 5 | 4.31 | 0.992 | |
| BrO3− | 0.5 | 1.91 | 0.981 |
| 1 | 2.10 | 0.984 | |
| 2.5 | 2.47 | 0.979 | |
| 5 | 7.54 | 0.932 | |
| ClO3− | 0.5 | 1.88 | 0.997 |
| 1 | 2.02 | 0.998 | |
| 2.5 | 2.20 | 0.997 | |
| 5 | 2.45 | 0.997 |
The correlation coefficients (R2) resulted from the pseudo-first-order model are high (>0.93). Therefore, the pseudo-first-order model can describe the kinetics of the photoelectrocatalytic decolourization of LY4G under visible light using α-Fe2O3/TiO2/ACP nanocomposite.
Based on the rate constant values in Table 2, it can be seen that the decolourization rate of LY4G in the presence of the oxidants is more than that in their absence. It means that presence of oxidants in all investigated concentrations had a positive effect on the decolourization process and enhanced the decolourization efficiency. In addition, the rate constant values increased with increasing the concentration of IO4−, BrO3− and ClO3−. However, H2O2 and S2O82− have the optimum amount of 1 mM in this study. These results are in agreement with the experimental data shown in Fig. 6–10.
Nezamzadeh-Ejhieh and Khorsandi20 indicated that the photocatalytic degradation of 4-nitrophenol using ZnO/nano-clinoptilolite under UV irradiation was well described by the pseudo-first-order kinetic model and the rate constants of the reaction were 0.0012, 0.0016 and 0.12 min−1 when BrO3− concentrations were 0.5, 1 and 5 mM, respectively. Furthermore, the pseudo-first-order rate constants for photocatalytic degradation of pyridine with 10 mM BrO3 under UV irradiation using TiO2 and Ag/TiO2 were 3.59 × 10⁻³ and 5.53 × 10⁻³, respectively as reported by Tian et al.35
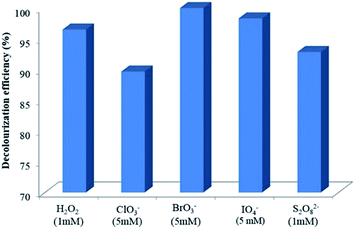
The values of decolourization efficiency in visible light/α-Fe2O3/TiO2/ACP photoelectrocatalytic process in the presence of oxidants were compared in Fig. 11. The best concentration according to the obtained results was chosen for all of the oxidants. The results show that among oxidants, the most effective one for decolourization of LY4G by α-Fe2O3/TiO2/ACP nanocomposite under visible irradiation was BrO3− with almost 100% decolourization yield in 80 min. Another effective oxidant was IO4− which had a decolourization efficiency of 98% at the same time. Application of H2O2, S2O82− and ClO3− led to 96.5%, 93%, and 89% decolourization of LY4G after 80 min, respectively. Based on the results, decolourization efficiencies of LY4G for all of the investigated oxidants used in visible light/α-Fe2O3/TiO2/ACP system were found to be in the order of BrO3− > IO4− > H2O2 > S2O82− > ClO3−.
3.4. Comparison of photoelectrocatalytic activity of α-Fe2O3/TiO2/ACP/BrO3−, α-Fe2O3/TiO2/ACP and TiO2/ACP
Fig. 12 shows decolourization efficiency of LY4G with initial concentration of 10 mg L−1 at pH of 6 in different photoelectrocatalytic degradation processes. Comparison of the results indicates that the photoelectrocatalytic performance of α-Fe2O3/TiO2/ACP sample was higher than that of the TiO2/ACP. This can be attributed to the interfacial charge transfer between α-Fe2O3 and TiO2 semiconductors. It is assumed that photon of visible irradiation excites electron from valence band of α-Fe2O3 to the conduction band, leaving holes in the valence band. Simultaneously, under this irradiation, electron in valence band of TiO2 tends to transfer to the nearest band with the lowest energy (valence band of α-Fe2O3). This transformation between semiconductors can suppress the high rate of e−/h+ recombination and consequently increase the yield of photoelectrocatalytic process.36 A possible mechanism has been proposed in Fig. 13. Furthermore, as can be seen in Fig. 12, presence of BrO3− along with α-Fe2O3/TiO2/ACP nanocomposite led to more increase in decolourization efficiency. The BrO3− as an effective electron acceptor hinders the photogenerated e−/h+ recombination which causes more increase in production of reactive radicals.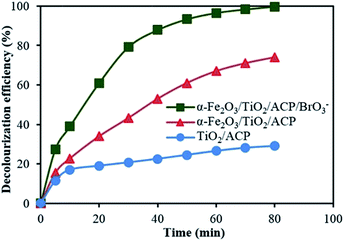 | ||
| Fig. 12 Comparison of photoelectrocatalytic decolourization efficiency of LY4G in the presence of α-Fe2O3/TiO2/ACP/BrO3−, α-Fe2O3/TiO2/ACP and TiO2/ACP. | ||
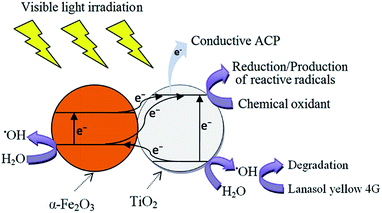 | ||
| Fig. 13 Proposed mechanism of electron–hole separation in α-Fe2O3/TiO2/ACP during photoelectrocatalysis under visible light irradiation (electron–hole recombination process is not shown here). | ||
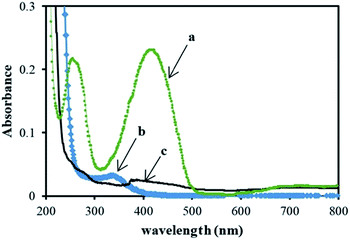
To confirm the contribution of developed reactive radicals in degradation of dye molecules, UV-visible absorbance spectra of untreated dye solution, solution treated by photoelectrocatalytic degradation process and the solution contains pollutants electrodesorbed from the surface of the used nanocomposite were recorded as can be seen in Fig. 14. The UV-visible spectrum of the treated solution by photoelectrocatalytic degradation process shows that the absorption peak around 419 nm corresponding to LY4G decreased through treatment process (Spectrum b) due to the removal of dye from the solution. Furthermore, the spectrum of solution contains pollutants electrodesorbed from the surface of the used nanocomposite (Spectrum c) shows that the concentration of dye in this solution was too low compared to its concentration in untreated dye solution (Spectrum a). This indicates that during the treatment process, most part of adsorbed dye molecules were degraded through photoelectrocatalytic degradation process.
3.5. Leaching test and reusability of α-Fe2O3/TiO2/ACP
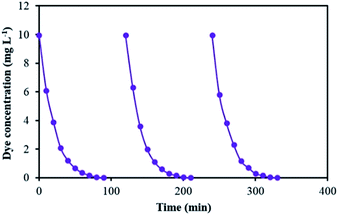
According to Pourbaix diagram,37 α-Fe2O3 is the most stable form of iron oxides and iron leaching can only occur at low pH and low potential values. Since all of the experiments in this work were carried out in approximately neutral pH (6) and potential of 700 mV, so iron leaching is impossible theoretically. However, at the end of the all experiments, the total amount of iron in solution was measured to assess the durability of α-Fe2O3/TiO2/ACP nanocomposite. No iron was detected in the solution after the experiments thus confirmed the absence of leaching.The performance of α-Fe2O3/TiO2/ACP nanocomposite was investigated in three subsequent decolourization cycles under identical conditions ([dye]0 = 10 mg L−1, voltage = 700 mV, pH = 6, [BrO3−] = 5 mM and [Na2SO4] = 8 g L−1). In order to regenerate the nanocomposite after each experiment, it was separated from treated solution and immersed in 0.01 M NaOH solution with the volume of 115 mL and the electrodesorption was conducted at voltage of −240 mV for 30 min. Then the regenerated nanocomposite electrode was washed with distilled water and used for next run. The values of decolourization efficiency in three successive cycles are shown in Fig. 15. The obtained results show that the nanocomposite can be effectively reused as a catalyst several times without significant activity loss.
3.6. Identification of intermediates of LY4G decolourization by photoelectrocatalytic process using BrO3−/visible light/α-Fe2O3/TiO2/ACP system and proposed degradation mechanism
In order to distinguish intermediates produced through decolourization of LY4G solution, 100 mL of 20 mg L−1 LY4G solution by adding 5 mM BrO3−, applied potential of 700 mV and pH of 6 was treated using α-Fe2O3/TiO2/ACP system under visible light for 4 min.Molecular structure and main fragments identified by GC-MS analysis are listed in Table 3. It should be pointed out that quick oxidation of the process prevented the detection of some intermediates with large molecular structure.
| Structure | Compound name | Retention time (min) | Main fragmentsa |
|---|---|---|---|
| a Corresponding values for the trimethylsilyl derivative. | |||
 |
Acetic acid | 4.58 | 117, 75, 45 |
 |
Acetamide | 4.59 | 116, 75 |
 |
Ethanimidic acid | 5.06 | 203, 147, 114, 73, 45 |
 |
Hydroxy acrylic acid | 5.78 | 217, 147, 73, 45 |
 |
Hydroxypyruvic acid | 5.78 | 217, 147, 73, 45 |
 |
Pyruvic acid oxime | 5.78 | 217, 147, 73, 45 |
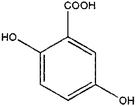 |
2,5-Dihydroxybenzoic acid | 20.43 | 355, 73 |
 |
2,4-Dihydroxybenzoic acid | 26.63 | 355, 73 |
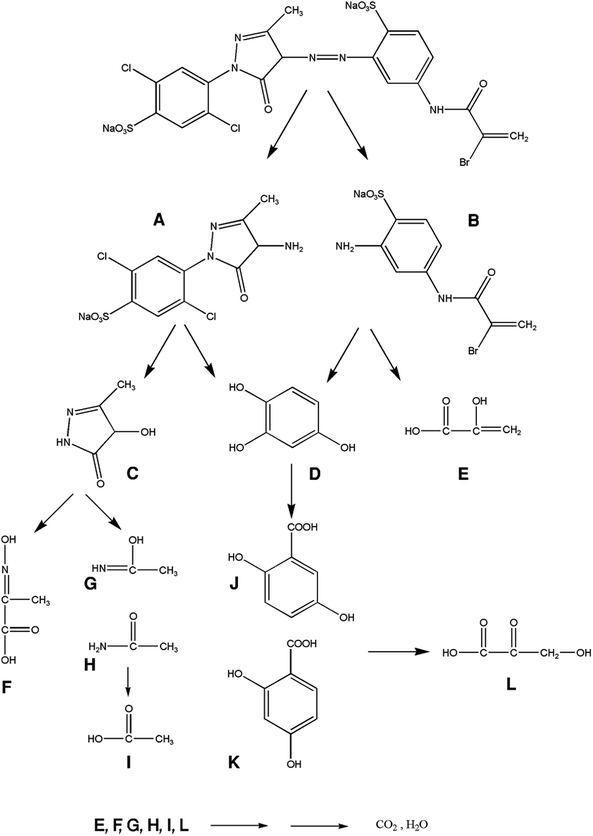
The possible reaction pathway of LY4G decolourization can be concluded by Fig. 16. Degradation could take place by cleavage of C–S, C–N, C–C or N![[double bond, length as m-dash]](https://www.rsc.org/images/entities/char_e001.gif) N bonds. Short chained compounds such as organic acids were produced after opening the aromatic rings through successive attacks by ˙OH. Finally, these intermediates could be mineralized to CO2 and H2O.
N bonds. Short chained compounds such as organic acids were produced after opening the aromatic rings through successive attacks by ˙OH. Finally, these intermediates could be mineralized to CO2 and H2O.
3.7. Mineralization analysis
One of the basic advantages of the AOPs is that these processes eventually destruct the organic compounds to CO2 and H2O. In this work, the mineralization efficiency of 10 mg L−1 LY4G at pH = 6, applied potential of 700 mV and electrolyte concentration of 8 g L−1 by adding 5 mM BrO3− during photoelectrocatalytic process using α-Fe2O3/TiO2/ACP under visible light was determined by TOC measurement analysis. Results of TOC analysis show that the TOC of LY4G was decreased from 1.793 mg L−1 to 1.411 mg L−1 after 80 min and reached to 1.335 μg L−1 after 8 h. These results indicate that approximately 21% of the carbon in LY4G was mineralized within 80 min, while this solution was completely decolourized within this reaction time. Comparison of the initial TOC value with TOC8 h indicated the complete mineralization of LY4G during photoelectrocatalytic process under visible irradiation for 8 h.3.8. Colour and COD reduction of real wastewater
Studies on real textile wastewater sample containing LY4G showed that α-Fe2O3/TiO2/ACP nanocomposite under visible light at pH = 6, applied potential of 700 mV by adding 5 mM BrO3− at contact time of 80 min removed approximately 59% of LY4G in the sample with the volume of 115 mL. Results showed that the decolourization efficiency from real wastewater was lower than that of the synthetic sample at the same conditions. This can be explained by the presence of various organic and inorganic components in real wastewater which compete with LY4G for degradation on the nanocomposite surface. Furthermore, the efficiency of α-Fe2O3/TiO2/ACP nanocomposite at mentioned conditions under visible light was evaluated by the COD. COD reduction was about 88% after 8 h. It showed that the photoelectrocatalytic process using BrO3−/visible light/α-Fe2O3/TiO2/ACP system can effectively degrade textile wastewater.4. Conclusions
The photoelectrocatalytic decolourization of LY4G using the α-Fe2O3/TiO2/ACP nanocomposite under visible light was found to be an efficient technique. The obtained results indicated that the decolourization efficiency was obviously affected by different concentrations of H2O2, S2O82−, BrO3−, ClO3− and IO4− and these oxidants improved the performance of α-Fe2O3/TiO2/ACP under visible irradiation. The TOC results proved that the designed photoelectrocatalytic system had appropriate ability for degradation and mineralization of the model contaminant. Some of the degradation intermediate compounds were identified by GC-MS technique. Eventually, COD measurement confirmed the proper treatment of real wastewater by photoelectrocatalytic process using BrO3−/visible light/α-Fe2O3/TiO2/ACP system.Acknowledgements
This paper is published as part of a research project supported by the University of Tabriz Research Affairs Office. The authors would like to express their gratitude to the University of Tabriz for financial supports and Dr I. Ahadzadeh from Research Laboratory of Electrochemical Instrumentation and Energy Systems, Faculty of Chemistry, University of Tabriz for providing emission spectrum of the visible light lamp.Notes and references
- M. Sheydaei, S. Aber and A. Khataee, J. Mol. Catal. A: Chem., 2014, 392, 229 CrossRef CAS PubMed.
- S. Aber, R. Soltani-Jigheh and A. R. Khataee, Desalin. Water Treat., 2014 DOI:10.1080/19443994.2014.922438.
- M. Sheydaei, S. Aber and A. Khataee, J. Ind. Eng. Chem., 2014, 20, 1772 CrossRef CAS PubMed.
- I. Grčić, D. Vujević and N. Koprivanac, Chem. Eng. J., 2010, 157, 35 CrossRef PubMed.
- D. Sannino, V. Vaiano, P. Ciambelli and L. A. Isupova, Catal. Today, 2011, 161, 255 CrossRef CAS PubMed.
- T. A. Gad-Allah, S. Kato, S. Satokawa and T. Kojima, Desalination, 2009, 244, 1 CrossRef CAS PubMed.
- B. Ayoubi-Feiz, S. Aber, A. Khataee and E. Alipour, Environ. Sci. Pollut. Res., 2014, 21, 8555 CrossRef CAS PubMed.
- Y. Luo, J. Luo, J. Jiang, W. Zhou, H. Yang, X. Qi, H. Zhang, H. J. Fan, D. Y. W. Yu, C. M. Li and T. Yu, Energy Environ. Sci., 2012, 5, 6559 CAS.
- M. Ghavami, R. Mohammadi, M. Koohi and M. Z. Kassaee, Mater. Sci. Semicond. Process., 2014, 26, 69 CrossRef CAS PubMed.
- K. Dai, X. Zhang, K. Fan, T. Peng and B. Wei, Appl. Surf. Sci., 2013, 270, 238 CrossRef CAS PubMed.
- A. Ajmal, I. Majeed, R. N. Malik, H. Idriss and M. A. Nadeem, RSC Adv., 2014, 4, 37003 RSC.
- H.-C. Huang, G.-L. Huang, H.-L. Chen and Y.-D. Lee, Thin Solid Films, 2006, 515, 1033 CrossRef CAS PubMed.
- M. H. Lee, J. H. Park, H. S. Han, H. J. Song, I. S. Cho, J. H. Noh and K. S. Hong, Int. J. Hydrogen Energy, 2014, 39, 17501 CrossRef CAS PubMed.
- M. Saquib and M. Muneer, Color. Technol., 2002, 118, 307 CAS.
- H. Chang, H.-T. Su, W.-A. Chen, K. D. Huang, S.-H. Chien, S.-L. Chen and C.-C. Chen, Sol. Energy, 2010, 84, 130 CrossRef CAS PubMed.
- A. P. H. Association, Standard methods for the examination of water and wastewater, Washington D.C, USA, 1989 Search PubMed.
- S. Karthikeyan, C. J. Magthalin, A. B. Mandal and G. Sekaran, RSC Adv., 2014, 4, 19183 RSC.
- A. Amarjargal, Z. Jiang, L. D. Tijing, C.-H. Park, I.-T. Im and C. S. Kim, J. Alloys Compd., 2013, 580, 143 CrossRef CAS PubMed.
- R. Daghrir, P. Drogui and M. A. El Khakani, Electrochim. Acta, 2013, 87, 18 CrossRef CAS PubMed.
- A. Nezamzadeh-Ejhieh and S. Khorsandi, J. Ind. Eng. Chem., 2014, 20, 937 CrossRef CAS PubMed.
- L. Guo, F. Chen, X. Fan, W. Cai and J. Zhang, Appl. Catal., B, 2010, 96, 162 CrossRef CAS PubMed.
- X. Wang, J. Wang, Z. Cui, S. Wang and M. Cao, RSC Adv., 2014, 4, 34387 RSC.
- N. Panda, H. Sahoo and S. Mohapatra, J. Hazard. Mater., 2011, 185, 359 CrossRef CAS PubMed.
- S. Irmak, E. Kusvuran and O. Erbatur, Appl. Catal., B, 2004, 54, 85 CrossRef CAS PubMed.
- K. Govindan, S. Murugesan and P. Maruthamuthu, Mater. Res. Bull., 2013, 48, 1913 CrossRef CAS PubMed.
- P. Neta, V. Madhavan, H. Zemel and R. W. Fessenden, J. Am. Chem. Soc., 1977, 99, 163 CrossRef CAS.
- X. Wang, L. Wang, J. Li, J. Qiu, C. Cai and H. Zhang, Sep. Purif. Technol., 2014, 122, 41 CrossRef CAS PubMed.
- W. Chu, Y. R. Wang and H. F. Leung, Chem. Eng. J., 2011, 178, 154 CrossRef CAS PubMed.
- P. Gayathri, R. Praveena Juliya Dorathi and K. Palanivelu, Ultrason. Sonochem., 2010, 17, 566 CrossRef CAS PubMed.
- C.-H. Yu, C.-H. Wu, T.-H. Ho and P. K. Andy Hong, Chem. Eng. J., 2010, 158, 578 CrossRef CAS PubMed.
- B. Gözmen, M. Turabik and A. Hesenov, J. Hazard. Mater., 2009, 164, 1487 CrossRef PubMed.
- D. Rajamanickam and M. Shanthi, Spectrochim. Acta, Part A, 2014, 128, 100 CrossRef CAS PubMed.
- M. S. Seyed-Dorraji, N. Daneshvar and S. Aber, Global NEST J., 2009, 11, 535 Search PubMed.
- M. Muruganandham, N. Shobana and M. Swaminathan, J. Mol. Catal. A: Chem., 2006, 246, 154 CrossRef CAS PubMed.
- F. Tian, R. Zhu and F. Ouyang, J. Environ. Sci., 2013, 25, 2299 CrossRef CAS.
- M. A. Mahadik, S. S. Shinde, V. S. Mohite, S. S. Kumbhar, A. V. Moholkar, K. Y. Rajpure, V. Ganesan, J. Nayak, S. R. Barman and C. H. Bhosale, J. Photochem. Photobiol., B, 2014, 133, 90 CrossRef CAS PubMed.
- M. Pourbaix, Atlas of electrochemical equilibria in aqueous solutions, National Association of Corrosion Engineers, 1974 Search PubMed.
| This journal is © The Royal Society of Chemistry 2015 |

