Influence of water vapour with non-thermal plasma jet on the apoptosis of SK-BR-3 breast cancer cells
Naresh Kumar,
Pankaj Attri*,
Eun Ha Choi* and
Han Sup Uhm*
Plasma Bioscience Research Center/Department of Electrical and Biological Physics, Kwangwoon University, 20 Kwangwon-Ro, Nowon-Gu, Seoul 139-701, Korea. E-mail: ehchoi@kw.ac.kr; hsuhm@kw.ac.kr; chem.pankaj@gmail.com; Fax: +82-2-913-6187; Tel: +82-2-940-5236
First published on 22nd December 2014
Abstract
A new approach for cancer treatment is based on the congenital overproduction of hydroxyl radicals (OH) and hydrogen peroxide (H2O2) in cancer cells. Recently, atmospheric pressure non-thermal plasma jet (APPJ) have been frequently used for cancer treatment through the generation of different kinds of ROS species. However, APPJ still has some demerits, such as durability after treatment. Hence, in this work, H2O vapour is applied as a synergetic agent to APPJ, which not only controls the temperature rise, but also enhances selectivity by increasing the level of H2O2 and OH radicals during treatment. We observed that due to the increased concentration of OH radicals, apoptosis was induced on SK-BR3 breast cancer cells through an enhancement of oxidative signalling, which inhibits the phosphorylation of extracellular signal-regulated kinases (Erks) and activates the phosphorylation of mintogen-activated protein kinases (p38-MAPK). Furthermore, we studied the DNA damage, and PARP-1 cleaved analysis from treated cancer cells. The results show that OH/H2O2 plays a pivotal role in not only inducing cell death but also in enhancing the selective killing effect.
1. Introduction
For decades, the selective killing of cancerous cells has been a big challenge for medical sciences.1 In spite of the presence of an innate antitumor barrier, cancer continues to be a leading cause of death.2 An improvement of selective apoptosis in cancer cells might serve as a possible way to treat cancer.3,4 However, there remain some restrictions to inducing selective apoptosis in cancer cells. Enhancing the reactive oxygen species (ROS), such as hydrogen peroxide (H2O2)/hydroxyl radicals (OH), is one of the more efficient alternative biochemical options for cancer therapy.5 The atmospheric pressure plasma jet (APPJ) has been well recognized for its use in the propagation of electronically excited atoms, ROS and reactive nitrogen species (RNS).6,7 Although, OH radicals are one of the most unstable ROS with a half-life of about 10−9 s,8 there are indications that they will react with other species of charged molecules under most physiological conditions. By contrast, superoxide radicals carry a negative charge that restricts their membrane permeability to anion channels, but they can be easily converted into H2O2 as well as nitric oxide (NO) that can readily pass through membranes.8–12 H2O2 and NO can alter the intracellular redox state, leading to activation of redox-sensitive proteins signalling, with the latter causing oxidative DNA damage, which can lead to the elimination of cancer cells.13–15 For the high demands of APPJ in cancer therapy, we need more innovation to enhance its wide area of medicinal use. While working with APPJ, the efficiency of plasma source are the main problem which need to be resolved. Hence, there is a need to innovate and modify the plasma source.Through our laboratory-designed APPJ device, we can produce OH/H2O2 in high amounts that may be involved in the modulation of various types of intracellular signalling and selective apoptotic pathways. In selected biological applications, we have studied our new technology (i.e. the combined action of plasma and water vapour) on the anti-cancer activity of SK-BR3 breast cancer cells and on the toxicity of normal Keratinocyte HaCaT cells. Additionally, we studied DNA oxidation and its related marker PARP-1 – cleaved analysis from treated cancer cells. Furthermore, we studied the influence of hydroxyl radicals (OH), generated through the N2 + H2O plasma, on oxidative stress related proteins, such as on extracellular signal-regulated kinases (Erks) and mitogen-activated protein kinases (MAPK p38) signalling, which lead to apoptotic related gene expressions, such as ATM (Ataxia telangiectasia mutated, which is a serine/threonine protein kinase that indicates the response to DNA damage),16 Bax (BCL2-associated X protein governed by the p53 tumour suppressor, which has been shown to be required in p53-mediated apoptosis),17–19 and caspase-8 (apoptosis-related cysteine peptidase, which plays a key role in the execution-stage of cell apoptosis).16 Ultimately, the influence of these signalling pathways induces apoptosis in SK-BR-3 breast cancer cells through a DNA damage signalling cascade.
2. Experimental section
2.1. Chemicals
Dulbecco's Modified Eagle Medium (DMEM) and Fetal Bovine Serum (FBS) were purchased from Life Technologies. SK-BR3 breast cancer and HaCaT (Normal Human Keratinocyte) cell lines, procured from KCLB (Korean Cell Line Bank, South Korea), were used in the experiments. Exogenous H2O2 was measured using an Amplex H2O2 assay kit (Invitrogen, USA) and a NO detection assay kit from Biovision, USA. Apoptosis analysis was done using an EzWayAnnexin V-FITC apoptosis detection kit (Komabiotech, Inc, Seoul, Korea). Genomic DNA extraction and RNA extraction were done through a DNA extraction kit (Gene All, CELL SV MAXI, BanseokBld, Seoul, Korea) and an RNA extraction kit (rneasy mini kit, qiagen). Oxidative DNA damage was measured with an ELISA kit (Cell Biolabs, inc. USA). H2DCFDA (2′,7′-dichlorodihydrofluorescein diacetate; Invitrogen) was used for the detection of intracellular ROS. OH and H2O2 scavenger 6-hydroxy-2,5,7,8-tetramethylchroman-2-carboxylic acid (Trolox) and NO scavenger 2- to 4-carboxyphenyl-4,4,5,5-tetramethylimidazoline-1-oxyl-3-oxide (cPITO) were purchased from Sigma Aldrich.2.2. Plasma properties
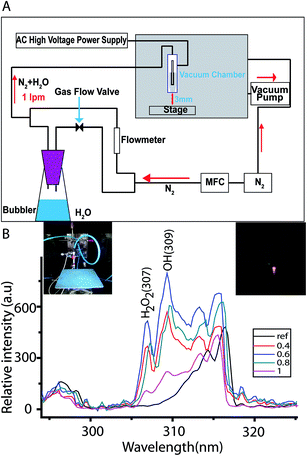
The APPJ device used in our experiment consisted of electrodes and dielectrics with a high voltage power supply, as shown in Fig. 1A.20 The vacuum chamber was constructed for a closed environment study, so that we could do every experiment in separate conditions from the surrounding environment. For the high-voltage power supply, we used a commercial transformer for the neon light. In this case, we also used a voltage controller to control the primary side of the high voltage transformer. We used an injection needle as an inner electrode, with a thickness of 0.2 mm and an inner diameter of 1.2 mm. This was tightly enclosed by a quartz material with an outer diameter of 7 mm. The outer electrode was made up of stainless steel with a hole of 1 mm at the centre. Porous alumina of 12 mm diameter and a length of 17 mm was tightly contacted in between the inner and outer electrodes. The discharge gap between the inner and outer electrodes was 2 mm. The gas was fed into the injection needle and then came out through the 1 mm hole in the outer electrode via the porous alumina, which had nearly 30% (vol) porosity with an average pore diameter of 300 μm. H2O (water vapour) with 400, 600, 800, 1000 sccm (standard cubic centimetres per minute), and nitrogen was used as the feeding gas, at a flow rate of 1 lpm (litre per minute) by mass flow as well as by the flow meter controller. These flow meters were used for mixing H2O vapour and nitrogen gas, with N2 gas flowing through the water bottle to evaporate water and to mix the vapour molecules with N2 gas. The actual voltage and current were distorted sinusoidal waveforms, due to micro-discharges through the porous alumina.20 The RMS values of the current and voltage were close to 1 mA and 2 kV, respectively. To know the plasma component, we applied different concentrations of H2O vapour along with nitrogen, which was the main feeding gas, and then examined the plasma emission spectra of plasma to determine the optimal OH peak, as shown in Fig. 1B.2.3. OES spectra and temperature measurement
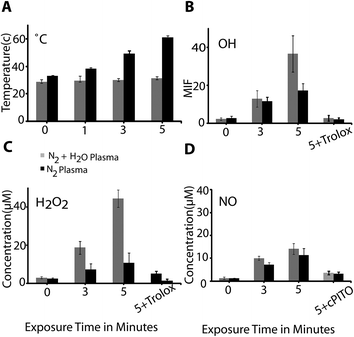
During the plasma discharge of plasma from APPJ, the emission spectra were recorded on a HR4000CG-UV-NIR (Ocean Optics, FL, USA) over a broad wavelength range of 200–1100 nm. We carried out the temperature measurements in 24-well plates containing 1 ml per well DMEM media, exposed to N2 + H2O plasma for 0, 1, 3 and 5 min. After exposure, we measured the temperature of the media by using an Infrared (IR) camera (Fluke Ti100 Series Thermal Imaging Cameras, UK).2.4. Cell lines and MTT assay
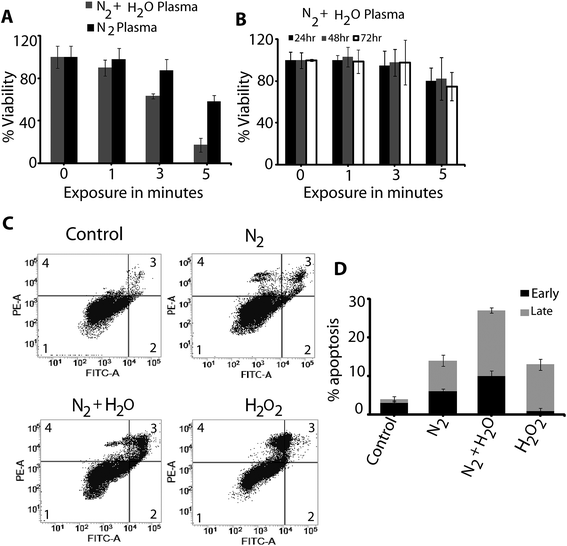
To study the effect of N2 + H2O plasma on cell viability and toxicity, we used breast cancer SK-BR3 cells and normal cells of Human Keratinocyte (HaCaT), respectively. Both cells were cultured in DMEM according to the previous reported paper.10,21,22 Cells (2–4 × 10⁵ cells per 1 ml) were seeded in 24 culture plates in complete media, and kept for the incubation duration to allow for cell adhesion. Cells were exposed for 0, 1, 3 and 5 min with N2 and N2 + H2O plasma, respectively. Untreated cells were included as a 0 min treatment in each experiment. After 48 h incubation of the treated cancer SK-BR3 cells and 72 h incubation of the normal treated HaCaT cells, the viabilities were checked using a MTT (3-[4,5-dimethylthiazol-2yl]-2,5-diphenyltetrazolium bromide) assay.21,222.5. ROS and RNS inside the media and cells
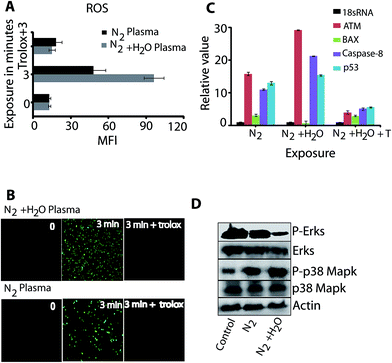
The reactive species, such as OH, H2O2 and NO, concentration in media (DMEM) were analyzed after N2 plasma and N2 + H2O plasma treatment: 1 ml per well media in a 24-well plate were exposed to N2 and N2 + H2O plasma for 0, 3, 5 min and 5 min exposure in the presence of 1 μM Trolox (OH, H2O2 scavenger)/0.5 mM cPITO (NO scavenger), respectively. The concentration of these radicals was measured according to the previously reported method from our group.23 We used the H2DCFDA probe to estimate the total ROS inside the cell. Adherent SK-BR3 cells in 24-well plates in DMEM media were exposed with N2 plasma and N2 + H2O plasma for 0, 3 min, and 3 min exposure in the presence of 1 μM trolox used for the total ROS scavenger. Each treated/untreated sample was transferred to a microcentrifuge tube. After being washed three times with PBS, 10 Mm H2DCFDA was added to each sample, and kept at 30 °C incubation for 1 h. Then, the cells were washed twice with PBS, then read at 495/515 (ex./em.) nm using a microplate reader. We determined the mean fluorescence intensity of the treated and untreated samples.2.6. Detection of apoptosis
SK-BR3 breast cancer cells were exposed with N2 + H2O plasma for 0 (control), 3 min and 20 μM of H2O2 to detect the apoptosis using the Annexin V-FITC apoptosis detection kit. Treated/untreated cells were trypsinized after 12 h incubation, after first washing with 1 ml of cold 1× biding buffer. Annexin V-FITC (0.5 μg ml−1) was added to each sample. After incubation for 15 min at room temperature, the cells were again washed with PBS and stained with 0.3 μg μl−1 of PI (Propidium Iodide) and analyzed by flow cytometry (BD FACS Verse, BD Biosciences).2.7. RNA extraction for quantitative real time PCR
We carried out a comparative study between N2 and N2 + H2O plasma. We analysed apoptosis-related gene expression, such as p53, caspase-8, ATM and BAX. Breast cancer SK-BR3 cells were exposed to N2 plasma, N2 + H2O plasma for 0, 3 min and 3 min N2 + H2O plasma exposure in the presence of 1 μM trolox, respectively. After the total cellular RNA isolation from cells using the Kit, we carried out the cDNA synthesis with ReverTra Ace® qPCR RT Master Mix with gDNA Remover kit (TOYOBO, Japan), and carried out a quantitative PCR using a thunderbird sybr® qPCR Mix kit (TOYOBO, Japan). We carried out the primer design according to the previous reported method from our group.24 Quantitative real-time PCR were done using the resulting cDNA with the following forward and reverse primer sequences listed below. 18S rRNA was used as the house-keeping gene to ensure cDNA integrity.Primer sequences used for apoptosis related mRNA expression on SK-BR3 cancer cell lines.
| Genes | Forward primers [5-3] | Reverse primers [5-3] |
| 18S rRNA | AACGAGACTCTGGCATGCTAACTA | CGCCACTTGTCCCTCTAAGAA |
| p53 | CACATGACGGAGGTTGTGAG | ACACGCAAATTTCCTTCCAC |
| Caspase8 | TTGAACCCAAGAGGTCAAGG | ACGGGGTCTTGTTCTGTCAC |
| ATM | GGGCAACATGGTGAAACTCT | CCTTAACCTCCAGGGCTCAG |
| Bax | AACATGGAGCTGCAGAGGAT | CAGTTGAAGTTGCCGTCAGA |
2.8. Western blot analysis
Cancer cells were exposed with N2 and N2 + H2O plasma for 0 min (control) and 3 min treatment respectively. The whole cell protein extracts from treated/untreated cells were lysed in RIPA buffer (Cell Signaling Technology, USA) extracted protein, and subjected to electrophoresis in 12% SDS-PAGE and blotted onto nitrocellulose membranes. The membrane was probed with the antibodies raised against phospho-specific Erks and p38 MAPK, respectively (Cell Signaling Technology, USA). The bands were detected using a Super Signal West Pico Chemiluminescent substrate (Pierce, Rockford, IL, USA) and imaged using a Vilver imaging system (Vilver, Upland, CA, USA).2.9. 8-OHdG determination and PARP-1 cleaved analysis
After N2 + H2O plasma exposure for 0 (control), 3 min and 20 μM of H2O2, the cancer cells were used to extract genomic DNA for 8-OH-dG detection and CD analysis. The treated cells were subjected to a genomic DNA extraction kit. The genomic DNA (2 mg ml−1) extracted was used for the analysis of 8-OH-dG levels by an oxidative DNA damage ELISA kit. The analysis of PARP-1 cleaved from the treated and control samples was carried out using a Cleaved PARP ELISA kit (Abcam. USA). We followed the standard protocol mentioned in these kits.2.10. Circular dichroism spectroscopy analysis (CD)
CD spectroscopic studies were performed using a J-815 spectrophotometer (Jasco, Japan) containing a Peltier system (temperature controller). A CD machine was calibrated according to our previous research articles;25–27 0.2 mg ml−1 of extracted DNA were monitored by using a 1.0 cm path length cuvette and every spectrum was an average of six spectra taken. However, each sample spectrum was obtained by subtracting appropriate blank media without DNA.3. Results and discussion
3.1. Variation in physical and chemical parameters after N2 + H2O plasma exposure in the media
Since plasma is known to be responsible for the change of physical parameters of the solution,23 it is also the cause for the gradual temperature rise.28 However, by using H2O vapour in combination with plasma that enhanced the ROS/RNS, which provides the synergetic effect of OH radicals with N2 plasma. To know the plasma component, we used 400, 600, 800 and 1000 sccm of H2O vapour in combination with N2 gas, and the emission spectra of the plasma were examined to determine which sccm of water vapour revealed the highest OH radical peak. However, we did not try with Ar or He plasma, because the maximum OH radicals are generated using N2 gas.29,30 Fig. 1B shows the highest OH emission spectrum at 600 sccm of H2O vapour in the plasma jet. We applied water vapour to increase the quantity of the OH radicals, which, subsequently are converted into H2O2. This conversion increases the amount of species to a very large extent, which enhances the efficiency of APPJ, compared to other sources. After exposure with the N2 and N2 + H2O plasma at the different time intervals 0, 1, 3 and 5 min, we measured the temperature of DMEM. This showed that the combination of N2 + H2O plasma did not show any change in temperature over treatment time; while, N2 plasma continuously raised the temperature of the media with treatment time, gaining around 60 °C within 5 min treatment, as shown in Fig. 2A.There must be some possibility that the level and constitution of ROS and RNS generated by the APPJ are affected by the interaction of plasma with the surrounding environment.23 Therefore, in this study, we carried out the plasma treatment in vacuum conditions (i.e. before treatment by plasma, we evacuated the atmospheric gas and then filled the chamber with nitrogen gas only), to generate the ROS without environmental interferences. In this experimental condition, we treated the 1 ml DMEM media in different time intervals. The relative levels of OH radicals, H2O2, and NO were higher in the case of N2 + H2O plasma, compared to N2 plasma alone (see Fig. 2B–D). However, the generation of NO radicals is much less compared to OH and H2O2, because the formation of nitrogen atoms from the N2 gas requires a high amount of energy (∼10 eV), which results in less generation of NO compared to other radicals, as shown in Fig. 2D. However, we are not neglecting the role of NO against the cancer cells, but due to the excess amount of OH radicals and H2O2 they make greater contributions towards the efficacy of APPJ and anticancer activity.
3.2. Apoptosis study of SK-BR3 breast cancer cells at different time intervals of plasma treatments
To determine the treatment time of plasma at sub-lethal levels, we examined the cell viability after exposure with N2 plasma and N2 + H2O plasma at various doses. To know the cell viability and the plasma toxicity on cancer cells, as well as on normal cells, we performed a 3-(4,5-dimethylthiazol-2-yl)-2,5-diphenyltetrazolium bromide (MTT) assay. The MTT cell proliferation assay is considered as a reliable method to determine the cell proliferation rate. Decreases in cells viability were determined through a MTT-produced formazan coloured product. After treatment with N2 plasma and N2 + H2O plasma for 0, 1, 3, and 5 min, SK-BR3 breast cancer cells showed a decrease in viability after just 1 min treatment, during the 48 h incubation time. However, N2 plasma showed a significant effect on cell viability after 5 min exposure at 48 h incubation time (see Fig. 3A). Whereas N2 + H2O plasma showed no significant decrease in viability up to 5 min compared to non-treatment (0 min) during incubation times of 24, 48, and 72 h for HaCaT cells, as shown in Fig. 3B. After exposure with N2 + H2O plasma for 5 min, only 20–30% viability of the cancer cells was observed, although, there was no significant effect on cell viability with 5 min N2 plasma exposure up to 48 h incubation (see Fig. 3A). With the data obtained by MTT assay, it can be seen that the N2 + H2O plasma has an inhibitory effect on the SK-BR3 breast cancer cell growth, but does not show any toxic effects on the growth of HaCaT cells for up to 5 min treatment. Therefore, N2 + H2O plasma also shows selectivity between cancer cells and normal cells.To analyse the direct evidence supporting a causative link between the overproduction of ROS and the apoptosis of SK-BR3 breast cancer cells, we performed a comparative study between the N2, N2 + H2O and 20 μM H2O2 exposed cancer cells. Apoptotic action was analysed using Annexin V-FITC/PI staining. The population of Annexin V/PI-stained cells increased with plasma exposure (see Fig. 3C). For each sample in Fig. 3C, there are four quadrants, which are depicted as numeral values 1, 2, 3, 4 in each sample. The 2nd, 3rd quadrant shows early and late apoptosis, and the 4th quadrant shows narcosis. We studied N2 plasma, N2 + H2O plasma treatment for 3 min and 20 μM H2O2 treatment, which induced apoptosis of ∼15%, 28%, and 15% of the total cells, respectively (see Fig. 3D). However, ∼5% early apoptosis and ∼10% late apoptosis were observed for 3 min N2 plasma treatment, while ∼12% early and 18% were observed for post apoptosis for N2 + H2O plasma treatment (see Fig. 3D). On the other hand, H2O2-exposed cells showed ∼2% early apoptosis and 12% late apoptosis (see Fig. 3D). Although, 20 μM of H2O2 exposure showed higher narcosis ∼25% (see Fig. 3C, 4th quadrant), compared with plasma exposure. These results strongly suggest that the high production of ROS generated by N2 + H2O plasma induced apoptosis rather than the necrosis in SK-BR3 breast cancer cells.
3.3. Effect of ROS on oxidative and apoptosis related signalling
Total intracellular ROS levels were determined by the use of fluorescent probes. The ROS level detected by H2DCFDA significantly increased over the N2 + H2O plasma-treated cells, and it was significantly higher in 3 min treatment compared with 3 min N2 plasma (see Fig. 4A and B). When the treatment is done for 3 min under the presence of trolox, there is no significant increase in ROS, due to the scavenging activity of trolox, as shown in Fig. 4A and B. Therefore, the scavenging action of trolox proves that the enrichment of intracellular ROS enhancement is due to the extracellular ROS generated by N2 + H2O plasma, which causes oxidative stress in the cell and regulates the several kinds of protein signalling, as well as apoptosis-related gene expression.This evidence indicates that members of the mitogen-activated protein kinase (MAPK) family are involved in the regulation of cell survival or death.31 In mammalian cells, extracellular signal – regulated kinases (Erks), and p38 MAPK are known to regulate oxidant stress inside the cell.31,32 In response to oxidative stress induced by the ROS, p38-mitogen-activated protein (MAP) kinase are generally phosphorylated33 and cause an inhibition of Erks signalling, which may upregulate proapoptotic genes through distinct phosphorylation events, resulting in stress stimulus–DNA damage;23 although the activation of Erks generally promotes cell survival.33 To further establish the involvement of ROS in cancer cell death by H2O plasma, we evaluated mRNA expression of four apoptosis (ATM, BAX, caspase-8, p53) related genes and oxidative-stress-related signalling cascade, such as p38 MAPK and Erks, as shown in Fig. 4C and D. The large protein kinase family ATM is responsible for accelerating the cellular responses to DNA damage and may be one of the reasons for activation of H2AX and p53 in DNA damage pathways.34,35 NADPH (nicotinamide adenine dinucleotide phosphate) oxidases are integral membrane proteins that generate ROS from the extracellular molecular oxygen though the transfer of electrons from NADPH to oxygen across biological membranes, generating superoxide anions (O2−); this extracellular O2− dismutes to H2O2 and triggers redox-sensitive signalling transduction cascades, including the MAPK and Erks and its associated downstream transcription factors36 by modulating the expression of numerous oxidative genes, such as ATM, and p53, which cause DNA damage and apoptosis.37 The tumor suppressor protein p53/ATM is considered to be a major downstream effector of DNA damage-activated kinase pathways.38,39 However, oxidative stress inside the cells initiates MAPK activation, which is also linked to caspase-8 dependent apoptosis.40,41 Fig. 4C shows cancer cells exposed to N2, N2 + H2O and N2 + H2O + trolox for 3 min treatment. Compared with N2 plasma, the N2 + H2O plasma showed that ATM and p53, Caspase8 genes were expressed in high amounts, which leads to DNA damage. Whereas in the presence of trolox with 3 min treatment with N2 + H2O plasma, there does not seem to be any significant enhancement of gene expression due to the scavenging action of trolox. Therefore, OH/H2O2 generated by the N2 + H2O plasma is responsible for the high expression of these genes and plays a vital role in cell death through oxidative DNA damage, as illustrated in Scheme 1. For the more conformation oxidative stress induced by ROS, we examined p38-MAPK and Erks signalling in SK-BR3 cancer cells. The 3 min exposure of N2 + H2O plasma induced a significant inhibition in the phosphorylation of Erks protein, compared with 3 min treatment with N2 plasma treatment, as shown in Fig. 4D; although N2 + H2O plasma activate the phosphorylation of p38-MAPK rather than having an inhibitory effect. However, there were no significant differences in the expression of p38-MAPK proteins in all the treated and control cells (see Fig. 4D). Therefore, these results reveal the N2 + H2O plasma has a prominent effect on the oxidative stress signalling, compared with N2 plasma alone. To gain clearer evidence of DNA damage, we studied DNA oxidation and cleaved PARP-1 activity.
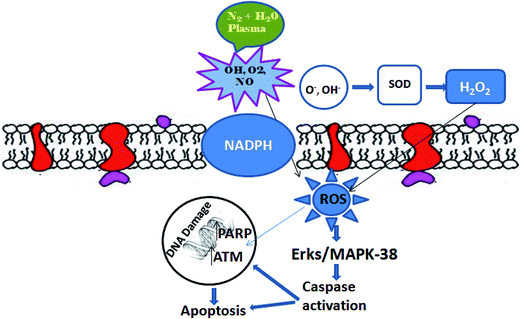 | ||
| Scheme 1 ROS generated through plasma penetrate inside the cell through the cell membrane, which activates the oxidative related signalling pathway, leading to apoptosis in cancer cells. | ||
3.4. Effects of ROS generated through N2 + H2O plasma on DNA oxidation and cleaved PARP-1
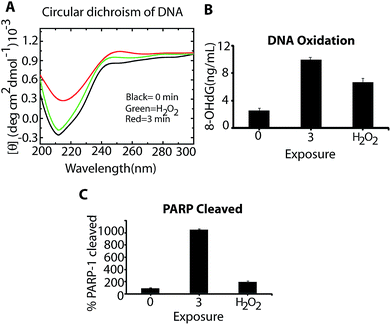
Prominent levels of ROS generated by plasma in tumour cells, increased the oxidative stress, which results in oxidative DNA damage, compared to normal cells.42–44 To know the effect of N2 + H2O plasma on the structural changes of DNA, we checked the CD spectra of DNA. The CD measurement was broadly used to monitor the conformational changes of DNA.45,46 The obtained changes in CD is a function of wavelength before and after plasma treatment. In Fig. 5A, without plasma treatment (control), SK-BR3 cancer cell DNA shows a negative peak at 211 nm and a positive peak at 245 nm. After 3 min treatment of N2 + H2O plasma, the negative peak is at 214 nm and the positive peak is at 250 nm. While, the H2O2 treated cancer cell DNA reveals negative peaks at 212 nm and a positive peak is at 247 nm. This reveals that the deformations occurring in the DNA are different for different types of treatment. In order to know whether these deformations occurring in the DNA might be due to changes in hydrogen bonding between the complementary bases after the plasma treatment, we studied the test results for the 8-oxoguanine (8-OHdG) marker, which is a typical oxidative base lesion.14,25,26 From Fig. 5B, we can observe the ng ml−1 of increase in the 8-OHdG formation, and we can see that the maximum 8-OHdG is formed after 3 min N2 + H2O plasma treatment, and that the concentration of 8-OHdG formation is less after treatment with H2O2. This is also boosted in the presence of different types of treatment doses (plasma and H2O2), which results in different levels of DNA oxidation/damage. One of the main criteria for DNA oxidation/damage by ROS involves activation of the poly(ADP-ribose) (PAR) polymerase-1 (PARP-1), which can lead to depletion of NAD+, decreases in intracellular ATP levels, and ultimately in cell death.47 Therefore, in further studies, we tried to correlate the 8-OHdG formation with the activation of PARP-1 cleaved, as shown in Fig. 5C. In Fig. 5C, we observed that the higher PARP-1 cleaved was observed after 3 min N2 + H2O plasma exposure, compared with the control (without treatment) and with 20 μM H2O2 treated cells. These results show that the higher PARP-1 cleaved leads to a higher level of 8-OHdG formation and is dependent on the presence of H2O2/OH produced by N2 + H2O plasma.However, Winter et al.48 recently reported that humidity plays an important role in the plasma chemical process, due to dissociation of the H2O molecules present in humid air. This dissociation can generate a high amount of H2O2 with increasing feed gas humidity. There is a possible correlation with the cellular response, which also influences the viability of treated cancer cells.49–54 In a similar way, our present work also supported the literature in that the additional generation of OH radicals and H2O2 by our laboratory designed plasma device can affect the viability of cancer cells to a greater extent than normal cells. Moreover, our work strengthens the evidence that OH radicals induce apoptosis on cancer cells through a DNA damage signalling cascade.
4. Conclusion
The combined effect of H2O and N2 plasma offers an advance in technology, which can not only be used to control the temperature of the plasma source but also can be used to increase efficiency for anticancer activity. Water vapour is a synergetic agent, which can be used to increase the efficiency of APPJ. The generation of OH radicals was analysed using optical emission spectroscopy. Our experimental results clearly depicted that OH radicals induced oxidative stress to activate the phosphorylation of p38 MAPK and to inhibit the Erks signalling, leading to apoptosis in SK-BR3 breast cancer cells through a DNA damage signalling cascade. Furthermore, mRNA expression for apoptosis-related genes (ATM, p53 and caspase-8) shows a high level of expression that might induce apoptosis in SK-BR3 breast cancer cells. Additionally, we observed the structural changes of DNA damage or oxidation using CD spectroscopy. We also performed a comparative study with PARP-1 cleaved with 8-OHdG. By comparing with H2O2, we observed higher PARP-1 cleaved, which resulted in higher DNA oxidation after treatment with N2 + H2O plasma. Hence, N2 + H2O plasma can act as a prominent tool against cancer, compared to anti-cancer drugs, because anti-cancer drugs cause side effects; whereas, the uses of N2 + H2O plasma may be one of the more effective and cheap alternative methods for cancer treatment. Hence, this study could enhance the utility of APPJ in cancer therapy.Acknowledgements
This work was financially undertaken by the supported of the SRC program (Grant # 2010-0029421) and by Basic Science Research Program of the National Research Foundation (NRF), and was also partially supported by CBDRC program in Defence Ministry. This work has also been partially supported by Kwangwoon University 2014.References
- J. F. R. Kerr, C. M. Winterfold and B. V. Harmon, Cancer, 1994, 21, 84–88 Search PubMed.
- B. K. Edwards, H. L. Howe and L. A. G. Ries, Cancer, 2002, 94, 2766–2792 CrossRef.
- C. D. Albright, T. A. Van Dyke and R. I. Salganik, J. Nutr., 2004, 134, 1139–1144 CAS.
- W. A. Wlassoff, C. D. Albright, M. S. Sivashinski, A. Ivanova, J. G. Appelbaum and R. I. Salganik, J. Pharm. Pharmacol., 2007, 59, 1549–1553 CrossRef PubMed.
- M. Benhar, C. D. Engelberg and A. Lewitzki, EMBO Rep., 2002, 3, 420–425 CrossRef CAS PubMed.
- B. Shekhter, V. A. Serezhenkov, T. G. Rudenko, A. V. Pekshev and A. F. Vanin, Nitric Oxide, 2005, 12, 210–219 CrossRef PubMed.
- R. E. J. Sladek, E. Stoffels, R. Walraven, P. J. A Tielbeek and R. A. Koolhoven, IEEE Trans. Plasma Sci., 2004, 32, 1540–1543 CrossRef.
- N. Hogg, Annu. Rev. Pharmacol. Toxicol., 2002, 42, 585–600 CrossRef CAS PubMed.
- H. Ischiropoulos, Arch. Biochem. Biophys., 1998, 356, 1–11 CrossRef CAS PubMed.
- N. Kumar, N. K. Kaushik, G. Park, E. H. Choi and H. S. Uhm, Appl. Phys. Lett., 2013, 103, 203701 CrossRef PubMed.
- E. J. Locigno, J. L. Zweier and F. A. Villamena, Org. Biomol. Chem., 2005, 3, 3220–3227 CAS.
- F. Villamena and J. Zweier, Antioxid. Redox Signaling, 2004, 6, 619–629 CrossRef CAS PubMed.
- M. Reth, Nat. Immunol., 2002, 2, 1129–1134 CrossRef PubMed.
- H. J. Forman, Free Radical Biol. Med., 2007, 42, 926–932 CrossRef CAS PubMed.
- J. L. Zweier and F. AVillamena, in Oxidative Stress and Cardiac Failure. ed. M. L. Kukin and V. Fuster, Futura Publishing Co, New York, 2003, pp. 67–95 Search PubMed.
- M. Ahmed and N. Rahman, Oncogene, 2006, 25, 5906–5911 CrossRef CAS PubMed.
- T. Miyashita, S. Krajewski, M. Krajewska, H. G. Wang, H. K. Lin, D. A. Liebermann, B. Hoffman and J. C. Reed, Oncogene, 1994, 9, 1799–1805 CAS.
- M. Selvakumaran, H. K.Lin, T. Miyashita, H. G. Wang, S. Krajewski, J. C. Reed, B. Hoffman and D. Liebermann, Oncogene, 1994, 9, 1791–1798 CAS.
- T. Miyashita and J. C. Reed, Cell, 1995, 80, 93–99 CrossRef.
- Y. C. Hong, W. S. Kang, Y. B. Hong, W. J. Yi and H. S. Uhm, Phys. Plasmas, 2009, 16, 123502 CrossRef PubMed.
- T. Mosmann, J. Immunol. Methods, 1983, 65, 55 CrossRef CAS.
- N. K. Kaushik, Y. H. Kim, Y. G. Han and E. H. Choi, Curr. Appl. Phys., 2013, 13, 176–180 CrossRef PubMed.
- Y. H. Ryu, Y. H. Kim, J. Y. Lee, G. B. Shim, H. S. Uhm, G. Park and E. H. Choi, PLoS One, 2013, 8, e66231 CAS.
- K. Panngom, K. Y. Baik, Y. H. Ryu, H. S. Uhm and E. H. Choi, Curr. Appl. Phys., 2013, 13, S6–S11 CrossRef PubMed.
- P. Attri, P. Venkatesu and A. Kumar, Org. Biomol. Chem., 2012, 10, 7475–7478 CAS.
- P. Attri and E. H. Choi, PLoS One, 2013, 8, e75096 CAS.
- P. Attri, P. Venkatesu, N. Kaushik and E. H. Choi, RSC Adv., 2012, 2, 7146–7155 RSC.
- S. Mirpour, H. Ghomi, S. Piroozmand, M. Nikkhah, S. H. Tavassoli and S. Z. Azad, IEEE Trans. Plasma Sci., 2014, 42, 315–322 CrossRef CAS.
- J. T. Herron, J. Phys. Chem. Ref. Data, 1999, 28, 1453–1483 CrossRef CAS PubMed.
- H. S. Uhm, Y. H. Na, C.-B. Lee, E. H. Choi and G. Cho, Curr. Appl. Phys., 2014, 14, S162–S166 CrossRef PubMed.
- E. K. Kim and E. J. Choi, Biochim. Biophys. Acta, 2010, 1802, 396–405 CrossRef CAS PubMed.
- E. F. Wagner and A. R. Nebreda, Nat. Rev. Cancer, 2009, 9, 537–549 CrossRef CAS PubMed.
- W. Chen, L. Liu, Y. Luo, Y. Odaka, S. Awate, H. Zhou, T. Shen, S. Zheng, Y. Lu and S. Huang, Cancer Prev. Res., 2012, 5, 778–787 CrossRef CAS PubMed.
- K. Bedard and K. H. Krause, Physiol. Rev., 2007, 87, 245–313 CrossRef CAS PubMed.
- M. Yamaura, J. Mitsushita, S. Furuta, Y. Kiniwa, A. Ashida, Y. Goto, W. H. Shang, M. Kubodera, M. Kato, M. Takata, T. Saida and T. Kamata, Cancer Res., 2009, 69, 2647–2654 CrossRef CAS PubMed.
- K. J. Park, C. H. Lee, A. Kim, K. J. Jeong, C. H. Kim and Y. S. Kim, J. Biol. Chem., 2012, 287, 3313–3325 CrossRef CAS PubMed.
- D. V. Bulavin, Y. Higashimoto, I. J. Popoff, W. A. Gaarde, V. Basrur, O. Potapova, E. Appella and A. J. Fornace Jr, Nature, 2001, 411, 102–107 CrossRef CAS PubMed.
- S. L. Harris and A. J. Levine, Oncogene, 2005, 24, 2899–2908 CrossRef CAS PubMed.
- C. J. Bakkenist and M. B. Kastan, Nature, 2003, 421, 499–506 CrossRef CAS PubMed.
- W. S. Choi, D. S. Eom, B. S. Han, W. K. Kim, B. H. Han, E. J. Choi, T. H. Oh, G. J. Markelonis, J. W. Cho and Y. J. Oh, J. Biol. Chem., 2004, 279, 20451–20460 CrossRef CAS PubMed.
- B. E. Mchichi, A. Hadji, A. Vazquez and G. Leca, Cell Death Differ., 2007, 14, 1826–1836 CrossRef PubMed.
- A. B. Fisher, Antioxid. Redox Signaling, 2009, 11, 1349–1356 CrossRef CAS PubMed.
- Y.-M. Chang, C. K.-M. Chen and M.-H. Hou, Int. J. Mol. Sci., 2012, 13, 3394–3413 CrossRef CAS PubMed.
- S. D. Patil and D. G. Rhodes, Nucleic Acids Res., 2000, 28, 2439–2445 CrossRef CAS PubMed.
- P. U. Maheswari and M. J. Palaniandavar, Inorg. Biochem., 2004, 98, 219–230 CrossRef PubMed.
- M. Nowicka, A. Kowalczyk, S. Sek and Z. Stojek, Anal. Chem., 2013, 85, 355–361 CrossRef PubMed.
- H. Xu, P. Luo, Y. Zhao, M. Zhao, Y. Yang, T. Chen, K. Huo, H. Han and Z. Fei, Cell. Signal., 2013, 25, 1018–1026 CrossRef CAS PubMed.
- J. Winter, K. Wende, K. Masur, S. Iseni, M. Dunnbier, M. U. Hammer, H. Tresp, K. D. Weltmann and S. Reuter, J. Phys. D: Appl. Phys., 2013, 46, 295401 CrossRef.
- J. Winter, H. Tresp, M. U. Hammer, S. Iseni, S. Kupsch, A. Schmidt-Bleker, K. Wende, M. Dunnbier, K. Masur, K. D. Weltmann and S. Reuter, J. Phys. D: Appl. Phys., 2014, 47, 285401 CrossRef.
- N. Barekzi and M. Laroussi, Plasma Processes Polym., 2013, 10, 1039–1050 CrossRef CAS.
- M. Laroussi, IEEE Trans. Plasma Sci., 2009, 37, 714–725 CrossRef CAS.
- Y. Sakiyama, D. B. Graves, H. W. Chang, T. Shimizu and G. E. Morfill, J. Phys. D: Appl. Phys., 2012, 45, 425201 CrossRef.
- T. Murakami, K. Niemi, T. Gans, D. O'Connell and W. G. Graham, Plasma Sources Sci. Technol., 2013, 22, 015003 CrossRef.
- K. Kim, J. D. Choi, Y. C. Hong, G. Kim, E. J. Noh, J. S. Lee and S. S. Yang, Appl. Phys. Lett., 2011, 98, 073701 CrossRef PubMed.
| This journal is © The Royal Society of Chemistry 2015 |

