DOI:
10.1039/C4RA15687K
(Paper)
RSC Adv., 2015,
5, 13733-13742
Hydrophilic modification of polyvinyl chloride hollow fiber membranes by silica with a weak in situ sol–gel method
Received
3rd December 2014
, Accepted 8th January 2015
First published on 8th January 2015
Abstract
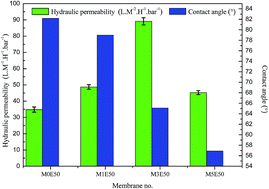
A weak in situ sol–gel method is proposed for the hydrophilic modification of polyvinyl chloride (PVC) hollow fiber membranes by silica, which is generated by the soft hydrolysis of tetraethoxysilane (TEOS) in a deionized water bath. The silica is uniformly distributed on the membrane surface. The sponge-like structure of the modified PVC membranes becomes thicker with the addition of TEOS. The surface hydrophilicity of the membranes gradually increases due to the introduction of silica. The hydraulic permeability increases from 34.8 L M−2 H−1 bar−1 to 89.1 L M−2 H−1 bar−1, and then decreases to 45.3 L M−2 H−1 bar−1 for the membranes of M0(1,3,5)E50 with the addition of TEOS from 0 to 5 wt% in dope content when 50 wt% ethanol aqueous solution is used as the bore liquid. A similar tendency is found for the membranes M0(1,3,5)D95 with 95 wt% DMAc aqueous solution as the bore liquid. The anti-fouling experiments illustrate that the membranes with the addition of TEOS show higher anti-fouling ability. Moreover, the mechanical properties of PVC membranes are also enhanced with the introduction of silica. This work demonstrates that PVC inorganic–organic composite hollow fiber membranes are prepared by a weak in situ sol–gel method, which avoids the use of corrosive substances during membrane preparation.
1. Introduction
Polyvinyl chloride (PVC) ultrafiltration membranes have been widely applied in drinking water production, membrane bioreactors (MBR) and other water treatments due to their low cost, good separation performances as well as mechanical properties.1–13 However, the traditional PVC membranes are still greatly limited by membrane fouling due to its hydrophobic property, which reduces permeability, needs frequent chemical cleaning and increases operation cost. The foulants on a membrane surface and in its pores shorten the membrane life.6 Currently, many methods are employed to improve the properties of polymeric membranes in term of their antifouling ability, hydrophilicity, mechanical properties etc. Among these methods, the blending modification, which is a facile and efficient method, allows for the preparation and modification be completed in a single step.14 The introduced additives include hydrophilic polymers, such as polymethyl methacrylate (PMMA),2 polyethylene glycol (PEG),15 perfluorosulfonic acid (PFSA)16 and polyvinylpyrrolidone (PVP)17 and inorganic nano-fillers, such as carbon nanotubes (CNTs),18 TiO2,19 ZnO,20 and SiO2.21 However, in the blending method it is always difficult to avoid the agglomeration of nano-particles, especially in those cases with high particle content. The agglomeration causes large defects and limits the improvement of membrane performances.22,23 Recently, the sol–gel method, as a classic way for the nano-particle fabrication of silica, was employed to prepare organic–inorganic hybrid membranes.24–30 This method can not only introduce nano-fillers into the membrane matrix, but also effectively prevent their aggregation. Liang et al.25 prepared poly(vinylidene fluoride) (PVDF)/silica (SiO2) hybrid membranes by thermally induced phase separation (TIPS). The surface hydrophilicity, pure water flux and mechanical properties were obviously improved with the formation of SiO2 particles in the hybrid membranes. Yu et al.30 prepared PVDF/SiO2 organic–inorganic composite hollow fiber ultrafiltration (UF) membranes via a tetraethoxysilane (TEOS) sol–gel process combined with the wet-spinning method. The in situ formed SiO2 fillers were homogenously dispersed in the PVDF matrix and apparently improved the mechanical property, thermal stability, permeation and antifouling performance of the hybrid membranes.
However, it is worth noting that all of these works introduced an acid solution or alkali aqueous solution as the coagulation liquid to induce the hydrolysis and polycondensation of TEOS. After membrane preparation, abundant acid or alkali waste water would be generated. This is unacceptable for a green chemical process. Additionally, adding acid or alkali in a coagulation liquid also increases the cost of membrane production. In this work, the PVC membranes were modified by silica with a weak in situ sol–gel method via the soft hydrolysis reaction of TEOS in water. The effects of TEOS on the membrane properties, such as morphology, hydrophilicity, permeability and anti-fouling ability, pore size and mechanical properties are discussed in detail.
2. Experimental
2.1. Materials
PVC with the polymerization degree of 1300 in powder form was purchased by Shanghai Chlor Alkali Chem. Co. Ltd. (China). TEOS, glycerol and N,N-dimethylacetamide (DMAc) were purchased from Shanghai Chemical Agent Company (PR China). PEGs with different molecular weights were purchased from Sigma-Aldrich (Shanghai) Trading Co. Ltd (China). Bovine serum albumin (BSA, MW = 67
000) was purchased from Shanghai Bio Co. Ltd (China).
2.2. Preparation of PVC hollow fiber membranes
The PVC hollow fiber membranes were spun at 25 ± 1 °C with the wet spinning method. First, PVC powder was dried in an oven at 70 °C. Then, 15 wt% PVC, 6 wt% glycerol and different amounts of TEOS were dissolved in DMAc solvent by mechanical stirring at 70 °C for 24 h to get homogenous doped solutions. The doped solutions were kept in a tank overnight for degassing before spinning.
The dope solution and bore liquid was passed through a spinneret under the pressure of N2 and a constant-flow pump, respectively. The external coagulation bath was tap water at 25 ± 1 °C and the bore liquid was 50 wt% ethanol aqueous solution or 95 wt% DMAc aqueous solution. The fabricated PVC fibers were immersed into water for at least 24 h to further induce the hydrolysis of TEOS and remove residual solvents. Then, the fibers were kept in a 50 wt% glycerol aqueous solution for 24 h to avoid the collapse of the porous structure and stored in a sealed space at room temperature for testing. The viscosity of the dopes was tested by a rotational viscometer. The detailed preparation parameters are listed in Table 1.
Table 1 Detailed preparation conditions of PVC hollow fiber membranes
Membrane no. |
Dope composition (PVC/TEOS/glycerol/DMAc) |
Bore composition (wt%) |
Dope viscosity (mPa s) |
M0E50 |
15/0/6/79 |
Ethanol/water: 50/50 |
4440 |
M0D95 |
DMAc/water: 95/5 |
M1E50 |
15/1/6/78 |
Ethanol/water: 50/50 |
5080 |
M1D95 |
DMAc/water: 95/5 |
M3E50 |
15/3/6/76 |
Ethanol/water: 50/50 |
5760 |
M3D95 |
DMAc/water: 95/5 |
M5E50 |
15/5/6/74 |
Ethanol/water: 50/50 |
6420 |
M5D95 |
DMAc/water: 95/5 |
2.3. Membrane characterizations
2.3.1. Characterizations of silica on membrane surface. To verify the hydrolysis of TEOS, energy dispersive spectroscopy (EDS) was used to detect the silicon element and oxygen element of membrane surface M5E50 with the highest TEOS concentration. The FTIR spectra of membrane M5E50 were measured using a Fourier-transform infrared spectrometer (FTIR-ATR ElectronCorp Nicolet 380) from 800 to 2000 cm−1. Meanwhile, the M5E50 membrane samples were put into water with vigorous stirring to test the leaching of the silicon element.
2.3.2. Morphology. The morphologies of all of the PVC membranes were examined by field emission scanning electron microscopy (FESEM) (Hitachi S-4800, Japan). The samples were coated with gold under vacuum before testing.The outer surfaces of membranes M0(1,3,5)E50 were detected by atomic-force microscopy (AFM, BioScope TM, USA) using tapping mode. The prepared membranes were placed on a glass substrate and the surface was scanned in a size of 2 μm × 2 μm with a scanning speed of 2 Hz. The average roughness (Ra), roughness (Rq), surface skewness (Rsk) and surface kurtosis (Rku) values were calculated by equals.31,32
2.3.3. Dynamic contact angle. A dynamic contact angle experiment was conducted to detect the surface hydrophilicity of the PVC hollow fiber membranes by a contact angle analyzer (KRÜSS DSA30, German).
2.3.4. Permeation and rejection performances. The hydraulic permeabilities (Jw) of the PVC hollow fiber membranes were measured at 1.0 bar with deionized water at 25 ± 1 °C. The ultrafiltration system was self-prepared and was revealed in previous reports.33,34 All modules were pre-pressurized at 2.0 bar about 30 min before testing. Then, the Jw was calculated according to |
 | (1) |
where V is the volume of the pure water (L), A is the effective membrane area (m2), t is the running time (h).The rejections of the PVC hollow fiber membranes were conducted by 500 ppm BSA aqueous solution at 1.0 bar. The BSA concentrations of the permeate and feed solutions were determined by a UV-spectrophotometer (UV3600 Shimadzu, Japan) at 280 nm. The rejection of BSA was defined as
|
 | (2) |
where
CP and
CF are the permeate and feed concentrations, respectively.
To elucidate the anti-fouling ability of the PVC hollow fiber membranes, cyclic filtration tests were performed on M0(1,3,5)E50, which included thrice fouling and twice washing. The fouled modules were washed with 500 ppm NaClO aqueous solution at 25 °C for 30 min.35,36 The modules were rinsed with DI water, and then the Jw was tested again. The relative flux reduction (RFR) and the flux recovery ratio (RJ) were evaluated by
|
RFR (%) = (1 − JP/Jw) × 100
| (3) |
where
JP is the BSA aqueous solution flux after each fouling process and
JR is re-measured water flux of the membranes after regeneration in each cycle.
A series of PEG ultrafiltration experiments were conducted to evaluate the mean pore size (
p) and MWCO of the PVC hollow fiber membranes.37,38 The concentration of the PEG solutions was kept at 200 ppm. The detailed equals were mentioned before.39–41
2.3.5. Mechanical properties. The mechanical properties of the PVC hollow fiber membranes were evaluated by a material test machine (QJ210A, Shanghai Qingji Instrumentation Sci. and Tech. Co. Ltd., Shanghai, China). All samples were tested at least for five times with the stretching rate at 50 mm min−1.
3. Results and discussion
3.1. Characterization of silica on membrane surface
Fig. 1 shows the FTIR spectra of membranes M0E50 and M5E50. In comparison with M0E50, M5E50 shows two new weak peaks at 964 cm−1 and 1090 cm−1, which refer to the Si–OH and Si–O–Si bonds, respectively.25,30 The EDS test was further used to detect the silica on the outer surface of membrane M5E50 and the element contents were obtained. According to calculations from the results, there exists 0.76 ± 0.10 wt% silicon element and 10.40 ± 2.40 wt% oxygen element on the membrane surface of M5E50. The EDS maps are shown in Fig. 2. This verifies that the added TEOS has been hydrolyzed to silica after immersion into water. From the distribution (Fig. 2) of the silicon element and oxygen element, it can be seen that silica fillers are introduced and uniformly distributed on the membrane surfaces. After vigorous stirring for 24 h, there still exists 0.65 ± 0.10 wt% silicon element. It means that the interaction force between silicon dioxide and membrane matrix is strong.
 |
| Fig. 1 FTIR-ATR spectra of membrane M0E50 and M5E50. | |
 |
| Fig. 2 EDS maps of the outer membrane surface of M5E50. | |
3.2. Morphology
Fig. 3 shows the cross-sectional FESEM images of the PVC hollow fiber membranes. When 50 wt% ethanol aqueous solution is used as the bore liquid, the PVC membranes show double finger-like structures accompanied with sponge-like structures sandwiched in-between. These structures indicate that phase separation is induced by the non-solvent penetrated from both the inner and outer surfaces of the hollow fiber membranes.42 Meanwhile, the finger-like pores are suppressed and the sandwiched sponge-like structure of the fibers gradually grows with the addition of TEOS. For the membranes prepared from 95 wt% DMAc aqueous solution as the bore liquid, the single finger-like structures accompanied with major sponge-like structures are found for the fibers of M0(1,3,5)D95. Similarly, the sponge-like structure is gradually enhanced. The size and amount of the finger-like pores decrease with the addition of TEOS. From Table 1, the dope viscosity increases with the addition of TEOS. The higher dope viscosity restricts the mass exchange rate between the solvent and non-solvent, and slows down the demixing rate. Therefore, the sponge-like structure gradually becomes thicker for the two series of membranes. To explain the effect of the bore liquid on membrane structure, the solubility parameter differences between the solvent, non-solvent and bore liquid are calculated and showed in Table 2.40,43 It can be seen that the δs–p of water, 50 wt% ethanol aqueous solution and 95 wt% DMAc aqueous solution for the polymer PVC are 40.3 Mpa1/2, 27.2 Mpa1/2 and 9.6 Mpa1/2, respectively. The bigger δs–p value means a faster demixing rate. In general, a delayed phase separation forms the membrane with a sponge-like structure; while an instantaneous phase separation results in the membrane with a finger-like structure.34 Therefore, the two bore fluids lead to the different structures of the PVC hollow fiber membranes in Fig. 3. According to the enlarged images of the sandwiched sponge-like structure, all membranes show porous structures, which may be ascribed to the pore-forming effect of glycerol.44,45
 |
| Fig. 3 Cross-sectional FESEM images of PVC hollow fiber membranes (A) the bore fluid is 50 wt% ethanol aqueous solution (B) the bore fluid is 95 wt% DMAc aqueous solution. | |
Table 2 Solubility parameters of PVC, solvents and bore liquids4,40
|
δd/Mpa1/2 |
δp/Mpa1/2 |
δh/Mpa1/2 |
δ/Mpa1/2 |
δs–p/Mpa1/2 |
PVC |
18.7 |
10.0 |
3.1 |
21.5 |
— |
H2O |
15.5 |
16.0 |
42.4 |
47.9 |
40.3 |
DMAc |
16.8 |
11.5 |
10.2 |
22.7 |
8.2 |
Ethanol |
15.8 |
8.8 |
19.4 |
26.6 |
17.4 |
Ethanol : H2O = 50 : 50 |
15.7 |
12.0 |
29.5 |
35.5 |
27.2 |
DMAc : H2O = 95 : 5 |
16.7 |
11.7 |
11.7 |
23.9 |
9.6 |
Fig. 4 shows the FESEM images of the outer surfaces of PVC hollow fiber membranes. All membranes exhibit dense outer surfaces with water acting as a strong non-solvent. However, from Fig. 5, it can be easily seen that the two different bore liquids lead to different inner surfaces. Compared with membranes M0(1,3,5)E50 prepared with 50 wt% ethanol aqueous solution, the membranes M0(1,3,5)D95, which were fabricated with 95 wt% DMAc aqueous solution as the bore liquid show bigger pores. In addition, the pore size of the inner surfaces may slightly decrease with the addition of TEOS due to the viscosity increase of the dopes.
 |
| Fig. 4 Outer FESEM images of PVC hollow fiber membranes. | |
 |
| Fig. 5 Inner FESEM images of PVC hollow fiber membranes. | |
The outer surfaces of PVC hollow fiber membranes with 50 wt% ethanol aqueous solution as the bore liquid were also detected by the AFM technique using the tapping mode. The images and roughness parameters are illustrated in Fig. 6 and Table 3. From Table 3, the membranes prepared with TEOS show higher surface roughness than that of the pristine PVC membrane (M0E50), which can be ascribed to the relaxation of the oriented macromolecules with the low dope viscosity.40 Yan46 et al. and Yu30 et al. pointed out that higher roughness commonly led to two changes in the modified membrane: an increase of efficient filtration area and a decrease of the anti-fouling performance. The larger filtration area is beneficial to the water flux, which will be further discussed below. For the numerous “valleys” on the membrane surface, foulants tend to accumulate in them, which result in flux decline and membrane fouling.
 |
| Fig. 6 AFM images of the outer surfaces of PVC hollow fiber membranes. | |
Table 3 AFM results of PVC hollow fiber membranes
Membrane no. |
Ra (nm) |
Rq (nm) |
Rsk |
Rku |
M0E50 |
11.37 |
12.72 |
−0.43 |
2.42 |
M1E50 |
24.08 |
16.32 |
−0.72 |
4.78 |
M3E50 |
19.23 |
16.09 |
−0.26 |
2.97 |
M5E50 |
16.27 |
15.21 |
0.94 |
4.37 |
The negative Rsk for M0E50, M1E50 and M3E50 means that valleys dominate their surfaces and the positive value for M5E50 indicates peaks dominate its outer surface. According the Rku values, it can be seen that the introduction of silica results in an uneven and nonrepetitive distribution for the outer surfaces.
3.3. Dynamic contact angle
Commonly, the surface hydrophilicity of polymeric membranes is highly related to permeation performance and anti-fouling ability. For PVC polymer, there are no hydrophilic chemical groups on its structure, which may lead to flux reduction and operation cost increase.6 The dynamic contact angles of the PVC hollow fiber membranes as a function of time and the final contact angle data after 10 min are illustrated in Fig. 7 and Table 4, respectively. It can be seen that the contact angles show an overall decreasing tendency as TEOS concentration for the two series of membranes (M0(1,3,5)E50 and M0(1,3,5)D95) increases. The final contact angles decrease from 82.2° to 56.9° for membranes M0(1,3,5)E50 with the TEOS concentration of 0 to 5 wt% in dope content. Similarly, the contact angle decreases from 83.3° to 57.4° for M0(1,3,5)D95. This phenomenon should be attributed to the good hydrophilicity of silica generated by the hydrolysis and polycondensation reaction of TEOS. The good membrane hydrophilicity results in good wetting and high water permeability. These results are similar to the previous publications,47–49 which therefore verify that the introduction of silica with a weak in situ sol–gel method can significantly improve the hydrophilicity of PVC membranes. Meanwhile, there is no big difference between the contact angles of membranes M0(1,3,5)E50 and those of membranes M0(1,3,5)D95 with the same dope composition.
 |
| Fig. 7 Dynamic contact angles of PVC hollow fiber membranes (A) M0(1,3,5)E50 (B) M0(1,3,5)D95. | |
Table 4 Final contact angles of PVC hollow fiber membranes
Membrane no. |
Final contact angle (°) |
Membrane no. |
Final contact angle (°) |
M0E50 |
82.2 |
M0D95 |
83.3 |
M1E50 |
79.0 |
M1D95 |
77.3 |
M3E50 |
65.1 |
M3D95 |
71.4 |
M5E50 |
56.9 |
M5D95 |
57.4 |
3.4. Permeation and rejection performances
The hydraulic permeability (Jw), the calculated mean pore size (
p) and MWCO of the fabricated PVC hollow fiber membranes are shown in Table 5 and Fig. 8. The results illustrate that Jw increases from 34.8 L M−2 H−1 bar−1 to 48.7 L M−2 H−1 bar−1 and 89.1 L M−2 H−1 bar−1, and then decreases to 45.3 L M−2 H−1 bar−1 for the membranes of M0(1,3,5)E50. A similar Jw variation tendency is found from 32.7 L M−2 H−1 bar−1 to 43.6 L M−2 H−1 bar−1 and 60.7 L M−2 H−1 bar−1, and then decreases to 38.8 L M−2 H−1 bar−1 for the membranes of M0(1,3,5)D95. As is known, permeation performances are closely related to the porosity, interconnection of cavities, surface pore size and surface hydrophilicity of membranes.18 The hydrophilicity of the membranes increases with the increase of TEOS, which commonly results in higher water flux. However, the membranes with higher doped TEOS concentrations exhibit thicker sponge-like structures with higher permeation resistance and suppress permeability.50 The two contradictory factors determine the final permeation flux. For the two series of PVC membranes, the surface hydrophilicity increase dominates the permeabilities of the former three fibers M0(1,3)E50 and M0(1,3)D95, whereas the increased permeation resistance dominates the permeabilities of the fibers of M5E50 or M5D95.
Table 5 Hydraulic permeability, pore size and MWCO of PVC hollow fiber membranes
Membrane no. |
Jw (L M−2 H−1 bar−1) |
p (nm) |
MWCO (kDa) |
M0E50 |
34.8 ± 1.6 |
2.80 |
55.9 |
M0D95 |
32.7 ± 2.0 |
3.18 |
61.1 |
M1E50 |
48.7 ± 1.4 |
1.76 |
49.2 |
M1D95 |
43.6 ± 0.9 |
3.18 |
50.8 |
M3E50 |
89.1 ± 2.2 |
1.52 |
36.5 |
M3D95 |
60.7 ± 1.9 |
2.67 |
42.2 |
M5E50 |
45.3 ± 1.2 |
2.04 |
42.9 |
M5D95 |
38.8 ± 1.8 |
3.01 |
48.4 |
 |
| Fig. 8 (A) Solute PEG rejection curves (B) probability density function curves (C) cumulative pore size distribution curves of PVC hollow fiber membranes. | |
Fig. 8 and Table 5 illustrate the MWCO and
p values of the PVC hollow fiber membranes. For the membranes of M0(1,3,5)E50, the
p decreases from 2.80 nm to 1.52 nm, and then increases to 2.04 nm, and the MWCO decreases from 55.9 KDa to 36.5 KDa and then increases to 42.9 KDa. The membranes of M0(1,3,5)D95 show a similar tendency, whose
p decreases from 3.18 nm to 2.67 nm and then increases to 3.01 nm. The MWCO decreases from 61.1 KDa to 42.2 KDa, and then increases to 48.4 KDa. Correlating the variation of Jw,
p and MWCO values, it can be concluded that the hydraulic permeability of the membranes is determined by not only the pore size but also the presence of silica on the membranes surface.
3.5. Anti-fouling performances
As is known, the permeation flux often significantly decreases during the separation process due to membrane fouling.51 The anti-fouling properties of M0(1,3,5)E50 are illustrated in Fig. 9 and Table 6. From Fig. 9, it can be seen that the permeation flux significantly decreases when deionized water was replaced by BSA aqueous solution for membrane fouling and concentration polarization. However, after washing with NaClO aqueous solution, the permeation fluxes of the four PVC hollow fiber membranes are well recovered. The recovery rates of the four membranes in the two washing cycles are both higher than 95.0%, which indicates that the fouled membranes are easily regenerated by the washing process. Additionally, the fiber of M3E50 has the highest permeation flux for BSA aqueous solution, which is markedly higher than those of other fibers. It verifies that the introduction of the appropriate silica with a weak in situ sol–gel method is an effective method to modify PVC ultrafiltration membranes.
 |
| Fig. 9 Anti-fouling experiments of PVC hollow fiber membranes. | |
Table 6 Anti-fouling parameters of PVC hollow fiber membranes
Membrane no. |
FRR1% |
RJ1 % |
FRR2% |
RJ2 % |
FRR3% |
M0E50 |
75.6 |
97.6 |
79.9 |
95.0 |
80.0 |
M1E50 |
76.7 |
97.7 |
78.6 |
95.2 |
80.0 |
M3E50 |
77.1 |
97.9 |
77.7 |
96.8 |
78.0 |
M5E50 |
73.8 |
97.5 |
75.0 |
95.2 |
76.9 |
3.6. The mechanical properties of the PVC hollow fiber membranes
The break strain, elongation at break and Young's modulus of the PVC hollow fiber membranes are summarized in Table 7. It can be seen that for the two series of PVC fibers with different bore liquids, the three indicators all increase with the addition of silica into the membranes. As 50 wt% ethanol aqueous solution is used as the bore liquid, the break strain values of membranes M0(1,3,5)E50 increase from 1.53 ± 0.16 MPa to 3.76 ± 0.07 MPa, the elongation ratio increases from 56.3 ± 2.1% to 70.8 ± 6.2%, and the Young's modulus increases from 49.4 ± 3.7 MPa to 91.9 ± 4.4 MPa with the addition of TEOS from 0 to 5 wt% in dope content. A similar trend is found for membranes M0(1,3,5)D95 with 95 wt% aqueous solution as the bore liquid. The increased mechanical strength of the PVC fibers should be ascribed to two factors: the variation of membrane morphology and the introduced silica. The images of the cross sections of the PVC fibers illustrate that the sponge-like structure grows with the addition of TEOS, which is advantageous to the improvement of the mechanical properties. In addition, the introduction of inorganic silica by the weak in situ sol–gel method also promotes the improvement of the mechanical properties of the fibers. Additionally, from Table 7, it can also be seen that the fibers of M0(1,3,5)E50 have lower mechanical properties than those of M0(1,3,5)D95 with the same dope. It also attributed to the morphology difference between the two series of fibers.
Table 7 Mechanical properties of the PVC hollow fiber membranes
Membrane no. |
Break strain (MPa) |
Elongation at break (%) |
Young's modulus (MPa) |
M0E50 |
1.53 ± 0.16 |
56.3 ± 2.1 |
49.4 ± 3.7 |
M0D95 |
2.12 ± 0.17 |
66.7 ± 6.3 |
56.8 ± 5.9 |
M1E50 |
1.91 ± 0.10 |
61.5 ± 5.4 |
53.7 ± 2.4 |
M1D95 |
2.60 ± 0.18 |
68.9 ± 4.7 |
76.0 ± 3.3 |
M3E50 |
2.81 ± 0.46 |
63.7 ± 4.3 |
84.0 ± 5.9 |
M3D95 |
2.90 ± 0.17 |
71.1 ± 4.2 |
77.0 ± 4.3 |
M5E50 |
3.76 ± 0.07 |
70.8 ± 6.2 |
91.9 ± 4.4 |
M5D95 |
3.20 ± 0.19 |
80.2 ± 3.3 |
86.6 ± 4.6 |
4. Conclusions
A weak in situ sol–gel method was successfully employed to modify PVC hollow fiber membranes with silica by the soft hydrolysis reaction of TEOS in water, which avoids the use of corrosive substances during membrane preparation. The effects of TEOS concentration and bore liquids on membrane morphologies, hydrophilicity, permeability, anti-fouling ability, pore size and mechanical properties are discussed in detail. The FESEM images show that the sponge-like structure of the PVC hollow fibers expands and the finger-like structure is suppressed with the addition of TEOS in the dopes. The introduced silica is uniformly distributed on the membrane surface, which significantly improves the membrane hydrophilicity and permeability. The highest Jw value obtained is 89.3 L M−2 H−1 bar−1. The mechanical strength of PVC fibers is also gradually enhanced with the addition TEOS.
Nomenclature
Jw | The pure water flux (L M−2 H−1 bar−1) |
V | Volume of penetrative water (L) |
A | The effective permeation area of membrane (m2) |
t | The time of getting the received pure water (h) |
ΔP | The penetrative pressure difference (bar) |
RFR | Relative flux reduction (%) |
RJ | The flux recovery ratio (%) |
Jp | BSA aqueous solution flux after each fouling process (L M−2 H−1 bar−1) |
JR | The re-measured water flux of the membranes in each cycle. (L M−2 H−1 bar−1) |
R | The Stokes radius of the solutes (m) |
M | The molecular weight (kg mol−1) |
Acknowledgements
The research is supported by Science and Technology Commission of Shanghai Municipality (13ZR1429900, 14520502900) and Internation Joint Laboratory on Resource Chemistry (IJLRC).
References
- J.-M. Yang, N.-C. Wang and H.-C. Chiu, J. Membr. Sci., 2014, 457, 139–148 CrossRef CAS PubMed.
- C. Zhou, Y. Gao, X. Qi, Z. Tan, S. Sun and H. Zhang, J. Vinyl Addit. Technol., 2013, 19, 11–17 CrossRef CAS.
- C.-X. Liu, W.-Z. Lang, B.-B. Shi and Y.-J. Guo, Mater. Lett., 2013, 107, 53–55 CrossRef CAS PubMed.
- Q. F. Alsalhy, Desalination, 2012, 294, 44–52 CrossRef CAS PubMed.
- N. Misra, H. S. Panda, G. Kapusetti, S. Jaiswal, S. C. Gopal and U. S. Sharma, J. Polym. Mater., 2011, 28, 139–148 CAS.
- S. Mei, C. Xiao, X. Hu and W. Shu, Desalination, 2011, 280, 378–383 CrossRef CAS PubMed.
- S. Mei, C. Xiao and X. Hu, J. Appl. Polym. Sci., 2011, 120, 557–562 CrossRef CAS.
- W. Ma, H. Otsuka and A. Takahara, Polymer, 2011, 52, 5543–5550 CrossRef CAS PubMed.
- Q.-r. Fan, P. Xiao, F. Xiao, C.-g. Qiao, T. Qin and D.-s. Wang, China Environ. Sci., 2011, 32, 1351–1356 Search PubMed.
- Q. Alsalhy, S. Algebory, G. M. Alwan, S. Simone, A. Figoli and E. Drioli, Sep. Sci. Technol., 2011, 46, 2199–2210 CrossRef CAS.
- X. Zhang, Y. Chen, A. H. Konsowa, X. Zhu and J. C. Crittenden, Sep. Purif. Technol., 2009, 70, 71–78 CrossRef CAS PubMed.
- M. Khayet, M. C. García-Payo, F. A. Qusay and M. A. Zubaidy, J. Membr. Sci., 2009, 330, 30–39 CrossRef CAS PubMed.
- X. Guo, Q. Li, W. Hu, W. Gao and D. Liu, J. Membr. Sci., 2009, 327, 254–263 CrossRef CAS PubMed.
- F. Liu, N. A. Hashim, Y. Liu, M. R. M. Abed and K. Li, J. Membr. Sci., 2011, 375, 1–27 CrossRef CAS PubMed.
- J.-H. Kim and K.-H. Lee, J. Membr. Sci., 1998, 138, 153–163 CrossRef CAS.
- W.-Z. Lang, Q. Ji, J.-P. Shen, Y.-J. Guo and Z.-L. Xu, Desalination, 2012, 292, 45–52 CrossRef CAS PubMed.
- W.-Z. Lang, X. Zhang, J.-P. Shen, H.-P. Xu, Z.-L. Xu and Y.-J. Guo, Desalination, 2014, 341, 72–82 CrossRef CAS PubMed.
- H.-P. Xu, W.-Z. Lang, X. Yan, X. Zhang and Y.-J. Guo, J. Membr. Sci., 2014, 467, 142–152 CrossRef CAS PubMed.
- F. Shi, Y. Ma, J. Ma, P. Wang and W. Sun, J. Membr. Sci., 2013, 427, 259–269 CrossRef CAS PubMed.
- J. Hong and Y. He, Desalination, 2014, 332, 67–75 CrossRef CAS PubMed.
- A. Cui, Z. Liu, C. Xiao and Y. Zhang, J. Membr. Sci., 2010, 360, 259–264 CrossRef CAS PubMed.
- X. Zuo, S. Yu, X. Xu, J. Xu, R. Bao and X. Yan, J. Membr. Sci., 2009, 340, 206–213 CrossRef CAS PubMed.
- A. Cui, Z. Liu, C. Xiao and Y. Zhang, J. Membr.
Sci., 2010, 360, 259–264 CrossRef CAS PubMed.
- R. Ciriminna, A. Fidalgo, V. Pandarus, F. Béland, L. M. Ilharco and M. Pagliaro, Chem. Rev., 2013, 113, 6592–6620 CrossRef CAS PubMed.
- H.-Q. Liang, Q.-Y. Wu, L.-S. Wan, X.-J. Huang and Z.-K. Xu, J. Membr. Sci., 2014, 465, 56–67 CrossRef CAS PubMed.
- F. Zhang, W. Zhang, Y. Yu, B. Deng, J. Li and J. Jin, J. Membr. Sci., 2013, 432, 25–32 CrossRef CAS PubMed.
- H. F. Qureshi, A. Nijmeijer and L. Winnubst, J. Membr. Sci., 2013, 446, 19–25 CrossRef CAS PubMed.
- W. Chen, Y. Su, L. Zhang, Q. Shi, J. Peng and Z. Jiang, J. Membr. Sci., 2010, 348, 75–83 CrossRef CAS PubMed.
- R. A. Zoppi and C. G. A. Soares, Adv. Polym. Technol., 2002, 21, 2–16 CrossRef CAS.
- L.-Y. Yu, Z.-L. Xu, H.-M. Shen and H. Yang, J. Membr. Sci., 2009, 337, 257–265 CrossRef CAS PubMed.
- X. Zhang, W.-Z. Lang, H.-P. Xu, X. Yan, Y.-J. Guo and L.-F. Chu, J. Membr. Sci., 2014, 469, 458–470 CrossRef CAS PubMed.
- J. Stawikowska and A. G. Livingston, J. Membr. Sci., 2013, 425–426, 58–70 CrossRef CAS PubMed.
- W.-Z. Lang, J.-P. Shen, Y.-X. Zhang, Y.-H. Yu, Y.-J. Guo and C.-X. Liu, J. Membr. Sci., 2013, 430, 1–10 CrossRef CAS PubMed.
- W.-Z. Lang, Z.-L. Xu, H. Yang and W. Tong, J. Membr. Sci., 2007, 288, 123–131 CrossRef CAS PubMed.
- Y. Zhang, J. Tian, H. Liang, J. Nan, Z. Chen and G. Li, J. Environ. Sci., 2011, 23, 529–536 CrossRef CAS.
- X. Guo, H. Shao, W. Hu and H. Shen, Desalin. Water Treat., 2011, 33, 231–239 CrossRef CAS.
- M. Gholami, S. Nasseri, C. Y. Feng, T. Matsuura and K. C. Khulbe, Desalination, 2003, 293–301 CrossRef CAS.
- Q. Yang, T.-S. Chung and Y. E. Santoso, J. Membr. Sci., 2007, 290, 153–163 CrossRef CAS PubMed.
- X. Zhang, W.-Z. Lang, H.-P. Xu, X. Yan, Y.-J. Guo and L.-F. Chu, J. Membr. Sci., 2014, 469, 458–470 CrossRef CAS PubMed.
- W.-Z. Lang, J.-P. Shen, Y.-T. Wei, Q.-Y. Wu, J. Wang and Y.-J. Guo, Chem. Eng. J., 2013, 225, 25–33 CrossRef CAS PubMed.
- J. Shirley, S. Mandale and V. Kochkodan, Desalination, 2014, 344, 116–122 CrossRef CAS PubMed.
- Z. Yuan and X. Dan-Li, Desalination, 2008, 223, 438–447 CrossRef PubMed.
- Z.-L. Xu and F. Alsalhy Qusay, J. Membr. Sci., 2004, 233, 101–111 CrossRef CAS PubMed.
- L. Shi, R. Wang, Y. Cao, D. T. Liang and J. H. Tay, J. Membr. Sci., 2008, 315, 195–204 CrossRef CAS PubMed.
- M. A. Aroon, A. F. Ismail, M. M. Montazer-Rahmati and T. Matsuura, Sep. Purif. Technol., 2010, 72, 194–202 CrossRef CAS PubMed.
- L. Yan, Y. Li, C. Xiang and S. Xianda, J. Membr. Sci., 2006, 276, 162–167 CrossRef CAS PubMed.
- G. Arthanareeswaran, T. Sriyamunadevi and M. Raajenthiren, Sep. Purif. Technol., 2008, 64, 38–47 CrossRef CAS PubMed.
- J. Huang, K. S. Zhang, K. Wang, Z. L. Xie, B. Ladewig and H. T. Wang, J. Membr. Sci., 2012, 423, 362–370 CrossRef PubMed.
- Z. J. Yu, X. Y. Liu, F. B. Zhao, X. Y. Liang and Y. Tian, J. Appl. Polym. Sci., 2015 DOI:10.1002/app.41267.
- L. García-Fernández, M. C. García-Payo and M. Khayet, J. Membr. Sci., 2014, 468, 324–338 CrossRef PubMed.
- S. Zinadini, A. A. Zinatizadeh, M. Rahimi, V. Vatanpour and H. Zangeneh, J. Membr. Sci., 2014, 453, 292–301 CrossRef CAS PubMed.
|
This journal is © The Royal Society of Chemistry 2015 |
Click here to see how this site uses Cookies. View our privacy policy here.