Solid phase extraction of heavy metal ions from agricultural samples with the aid of a novel functionalized magnetic metal–organic framework

Mirzaagha Babazadeh*a, Rahim Hosseinzadeh-Khanmiria, Jafar Abolhasania, Ebrahim Ghorbani-Kalhora and Akbar Hassanpourb
aDepartment of Chemistry, Tabriz Branch, Islamic Azad University, Tabriz, Iran. E-mail: babazadeh@iaut.ac.ir; Fax: +98-41-33333458; Tel: +98-41-33396024
bDepartment of Chemistry, Marand Branch, Islamic Azad University, Marand, Iran

Received 30th November 2014 , Accepted 26th January 2015

First published on 26th January 2015


Abstract

This work describes the synthesis and application of a novel magnetic metal–organic framework (MOF) [(Fe3O4–ethylenediamine)/MIL-101(Fe)] to preconcentrate the trace amounts of Cd(II), Pb(II), Zn(II) and Cr(III) ions and their determination by flame atomic absorption spectrometry. A Box–Behnken design was used to find the parameters affecting the preconcentration procedure through response surface methodology. Three variables, including sorption time, amount of the magnetic sorbent, and sample pH, were selected as affecting factors in sorption step, and four parameters, including type, volume, concentration of the eluent, and elution time, were selected in elution step for the optimization study. The values of the amount of the magnetic sorbent, sorption time, sample pH, type, volume, concentration of the eluent, and elution time were 29 mg, 15 min, 6.1, EDTA + HNO3, 4.2 mL, 0.7 mol L−1 EDTA in 0.07 mol L−1 HNO3 solution, 17.0 min, respectively. The limits of detection (LOD) were 0.15, 0.8, 0.2 and 0.5 ng mL−1 for Cd(II), Pb(II), Zn(II) and Cr(III) ions, respectively. The relative standard deviations (RSD) of the method were less than 7.6% for five separate batch experiments in the determination of 30 μg L−1 of Cd(II), Pb(II), Zn(II) and Cr(III) ions. The sorption capacity of [(Fe3O4–ethylenediamine)/MIL-101(Fe)] was 155 mg g−1 for cadmium, 198 mg g−1 for lead, 164 mg g−1 for zinc and 173 mg g−1 for chromium. Finally, the magnetic MOF nanocomposite was successfully applied to rapidly extract the trace amounts of heavy metal ions in agricultural samples.

1. Introduction

Heavy metal ions are toxic pollutants, which exist in wastewaters, and their presence concerns industries and environmental organizations all over the world. Most of these pollutants are very toxic and dangerous for human health. Thus the determination of trace amounts of heavy metals is often a major task for the analytical chemists, as it is a good tool for the identification and monitoring of toxicants in environmental samples. Among heavy metals that exist in the environment, cadmium monitoring is very vital due to the fact that cadmium concentrations in the environment are increasing significantly.1,2 Cadmium exposure can be linked to diseases associated with aging such as osteoporosis, prostate, and pancreatic cancer.3,4 Lead is one of the most toxic and hazardous elements in human health, because it can cause detrimental effect on metabolic processes of human beings.5 It has been proven to be a carcinogenic agent. Zinc deficiency might lead to several disorders such as growth retardation, diarrhea, immunity depression, eye and skin lesions, malfunction of wound healing, and other skin diseases.6 Cr(III) is an essential nutrient for humans. Cr(III) is effective on the mechanism of the glucose and cholesterol metabolism. In larger amounts and in different forms, chromium can be toxic and carcinogenic.7 Though trace amounts of metals such as zinc are biotic for humans, the excess utilization can be harmful and toxic; therefore, it should be used in the case of physiological needs. Thus the determination of trace amounts of heavy metals is one of the most important topics in analytical chemistry.

Various instrumental techniques, including electrothermal atomic absorption spectrometry (ETAAS),8,9 inductively coupled plasma-optical emission spectrometry (ICP-OES),10 flame atomic absorption spectrometry (FAAS),11 inductively coupled plasma-mass spectrometry (ICP-MS),12 and total reflection XRF-spectrometry13 have been used for the determination of heavy metals. The heavy metals concentration level in environmental samples is fairly low and the complexity of matrices is a main problem; thus preconcentration techniques are often required.14 Different procedures, such as liquid–liquid extraction (LLE),15 cloud point extraction,16 chemical precipitation,17 ion exchange,18 and solid phase extraction (SPE), have been developed for the extraction and preconcentration of heavy metals in natural matrices.19–21

Among the abovementioned methods, the most commonly used technique for the preconcentration of heavy metal ions from environmental samples is solid phase extraction. Its common application is due to its simplicity, rapidity, minimal cost, and low consumption of reagents.22 By the advent of SPE, various diverse sorbents have been utilized such as carbon nanotubes,23,24 magnetic nanoparticles,25,26 solid sulfur,27 cotton,28 and modified porous materials.29,30 Porous materials are defined as solids containing empty voids, which can host other molecules. The fundamental features of these materials are their porosity, the ratio between total occupied and empty space, the (average) size of the pores and the surface area. Typical surface area values for the porous materials applied in technological processes range between 2000 and 8000 m2 g−1.31 The most important applications of such materials are the storage of small molecules and filtering. The metal organic frameworks are defined as a nanocomposite material that consists of either inorganic or organic materials. MOFs have shown high potential in gas storage, separation, chemical sensing, drug delivery, and heterogeneous catalysis applications.32 In general, the flexible and highly porous structure of MOFs allows guest species such as metal ions to diffuse into their bulk structure. The shape and size of the pores lead to selectivity over the guests that may be adsorbed. These features make MOFs an ideal sorbent in solid phase extraction of heavy metals. However, there is little information about MOFs as an adsorbent.33

In this work, for the first time a magnetic metal–organic framework immobilized with Fe3O4–ethylenediamine (Fe3O4@En) has been utilized as a novel adsorbent for the fast separation and the preconcentration of Cd(II), Pb(II), Zn(II) and Cr(III) ions in various matrixes. The magnetic sorbent was characterized by, X-ray diffraction (XRD), Fourier transform infrared spectroscopy (FT-IR), scanning electron microscopy (SEM), transmission electron microscopy (TEM) and elemental analysis. The magnetic property of the sorbent causes a rapid and easy separation of the new solid phase from the solution. The presence of ethylenediamine in the sorbent helps the new solid phase to show selectivity towards these heavy metals. In addition, MOF cavities can increase the surface area and sorption capacity of this new sorbent. A Box–Behnken design was used in order to find the optimum conditions of the method through response surface methodology. Finally, the sorbent was used for the preconcentration and determination of Cd(II), Pb(II), Zn(II) and Cr(III) ions in different real samples and satisfactory results were obtained.

2. Experimental

2.1. Reagents and solutions

All reagents of analytical grade (FeCl2, FeCl3·6H2O, HCl, HNO3, K2SO4, NaOH, KCl, thiourea (TU), EDTA, N-(2-aminoethyl)-3-(aminopropyl)trimethoxysilane (AEAPTMS), benzene-1,4-dicarboxylic acid (H2BDC), toluene, triethylamine (TEA), tetrahydrofuran (THF), dimethylformamide (DMF), ethanol, methanol and acetone) were purchased from Merck (Darmstadt, Germany) or from Fluka (Seelze, Germany) and used without further purification. Standard solutions of 1000 mg L−1 of Cd(II), Pb(II), Zn(II) and Cr(III) were purchased from Merck. All solutions were prepared using double distilled water.

2.2. Instrumentation

An AA-680 Shimadzu (Kyoto, Japan) flame atomic absorption spectrometer with a deuterium background corrector was used for the determination of Cd(II), Pb(II), Zn(II) and Cr(III) ions. Cadmium, lead, zinc and chromium hollow cathode lamps (HCL) were used as the radiation sources with wavelengths of 228.8, 283.3, 213.9 and 357.9 nm, respectively. All measurements were carried out in an air/acetylene flame. The pH of the solutions was measured at 25 ± 1 °C with a digital WTW Metrohm 827 Ion analyzer (Herisau, Switzerland) equipped with a combined glass-calomel electrode. IR spectra were recorded by a Bruker IFS-66 FT-IR spectrophotometer. High-angle X-ray diffraction patterns were obtained using a Philips-PW 17C diffractometer with Cu Kα radiation (Philips PW, The Netherlands). CHN analysis was performed using a Thermo Finnigan Flash EA112 elemental analyzer (Okehampton, UK). Scanning electron microscopy (SEM) was performed by gently distributing the sample powder on the stainless steel stubs, using an SEM (KYKY-3200, Beijing, China) instrument. Transmission electron microscopy (TEM) analysis was performed by a LEO 912AB electron microscope (Leo Ltd., Germany).

2.3. Preparation of standard solution

Standard Stock solutions (1000 mg L−1) of K+, Na+, Ag+, Ca(II), Mg(II), Fe(III), Cu(II), Mn(II), Al(III), Ni(II), Hg(II), Co(II), and AsO43− were prepared in a 2% (v/v) HNO3 solution. The working standard solutions were prepared by diluting an appropriate amount of the stock solution with double distilled water. All of these solutions were stored at ambient temperature.

2.4. Synthesis of magnetic metal–organic framework nanocomposite

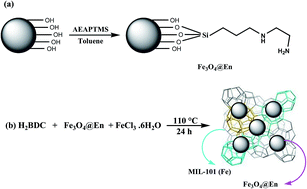
2.4.1. Synthesis of Fe3O4@ethylenediamine. Fe3O4 nanoparticles were synthesized according to a previously reported procedure.25 It was then modified with AEAPTMS. In a typical reaction, 1.5 g of Fe3O4 was suspended in 50 mL toluene, and the mixture was stirred for 45 min. Then AEAPTMS (1.5 mL) was added to the mixture and it was refluxed for 12 h under nitrogen atmosphere.34 Thereafter, the solid was removed from the solvents by magnetic separation washed with methanol and acetone and then dried at room temperature (Fig. 1a). The synthesis of ethylenediamine-functionalized Fe3O4 (Fe3O4@En) was characterized by IR spectroscopy, high-angle X-ray diffraction, transmission electron microscopy, and elemental analysis.
image file: c4ra15532g-f1.tif
Fig. 1 (a) A schematic diagram of Fe3O4 functionalization by En. (b) The schematic illustration of synthesized magnetic MOF nanocomposite.
2.4.2. Synthesis of MIL-101(Fe) metal–organic framework. MIL-101(Fe) metal–organic framework was synthesized according to the previously reported procedure.35 A solution containing 1.03 g of H2BDC and 3.25 g of FeCl3·6H2O in 100 mL of DMF was sonicated for 15 min and then under vigorous stirring. The mixture was transferred into an autoclave and it was heated at 110 °C for 24 h. The obtained powder was recovered by centrifugation, washed once with water and then with ethanol four times to remove impurities. Afterwards, it was dried under vacuum at 100 °C for 16 h and kept under dry nitrogen until further use. The synthesized MOF was characterized by IR spectroscopy, CHN analysis, SEM, and XRD.
2.4.3. Synthesis of magnetic metal–organic framework nanocomposite. Magnetic MOF nanocomposite was synthesized according to the following procedure (Fig. 1b). First, 0.5 g Fe3O4@En was dispersed in a solution containing 3.38 g of FeCl3·6H2O and 40 mL DMF by sonicating for 15 min. Then, this mixture was added to another solution containing 1.03 g of H2BDC in 50 mL DMF and sonicated for 10 min. Thereafter, the mixture was transferred into an autoclave and it was heated at 110 °C for 24 h. Finally, the product was isolated from the supernatant solution by magnetic decantation and washed with water (50 mL) and hot ethanol (15 mL × 5). Magnetic sorbent was characterized by IR spectroscopy, CHN analysis, SEM, and XRD.

2.5. Sorption and elution step

Extraction of heavy metal ions from aqueous solutions was investigated by batch analysis. Sorptions were performed in test tubes containing 25 μg of Cd(II), Pb(II), Zn(II) and Cr(III) ions in 50 mL of double distilled water. According to the preliminary experimental design, the pH of the solutions were adjusted by the drop wise addition of 1.0 mol L−1 ammonia and 1.0 mol L−1 hydrochloric acid. Then magnetic sorbent was added into the solutions. After that, the mixture was stirred for an appropriate time to extract these heavy metal ions from the solution completely. Finally, the test tubes were exposed to a strong magnet (15 cm × 12 cm × 5 cm, 1.4 T), where permanent magnet in the wall caused the particles to aggregate on one side of the test tube. The adsorbed amounts of Cd(II), Pb(II), Zn(II) and Cr(III) ions were determined using FAAS due to the concentration change of these ions in solution after sorption. The instrument response was periodically checked with known Cd(II), Pb(II), Zn(II) and Cr(III) ions standard solutions. Extraction percentage for each ion was calculated using the following equation:
image file: c4ra15532g-t1.tif
where CA and CB are initial and final concentrations (mg L−1) of each ion in the solution, respectively. In the elution step, 4.2 mL of 0.7 mol L−l EDTA in 0.07 mol L−l HNO3 solution as an eluent was added to the magnetic sorbent and shaken. This mixture was again exposed to a strong magnet and the clear solution of eluent, containing the eluted heavy metal ions, was introduced to FAAS in order to determine the amount of each ion.

2.6. Real sample pretreatment

2.6.1. Agricultural samples. The agricultural samples, including leek, fenugreek, parsley, radish, radish leaves, beetroot leaves, garden cress, basil and coriander, were collected from Tehran growing areas (Shahriyar-Tehran). Cleaned polyethylene bags were used to supply the samples according to their type. After washing the samples with distilled water, they were dried at 100 °C for 2 days. For the preparation of spiked samples, 1.0 mL of the standard working solution was added to 1.0 g of each sample. They were then allowed to stand at room temperature for the evaporation of the solvent; therefore, the equilibration between the analytes and the agricultural products was achieved. After grinding the dry samples (spiked or non-spiked), microwave-assisted acid digestion was carried out by adding 2 mL of distilled water, 4 mL of 65% nitric acid, and 2 mL of 33% hydrogen peroxide (w/v) to 0.5 g of each sample. The reactors were then subjected to microwave program as following:36 2.5 min at room temperature, 6 min at 140 °C, and 5 min at 200 °C in power of 550 W. After acid digestion was completed, the acid digests were diluted up to 25 mL with distilled water and kept in a refrigerator before magnetic solid phase extraction.
2.6.2. Reference material. The concentration of the heavy metal ions was determined at optimum conditions in standard reference materials (NIST SRM 1573a tomato leaves and NIST SRM 1515 apple leaves). The standard material was digested according to the mentioned procedure for agricultural samples. The pH of the solution was adjusted to 6.1 for the separation and preconcentration of Cd(II), Pb(II), Zn(II), and Cr(III) ions form the solution. Finally, the preconcentration procedure mentioned above was applied to the resulted solutions.

2.7. Experimental design methodology

In order to completely understand the effect of the experimental variables that can significantly affect the extraction procedure, individual factors must be considered along with nonlinear effects and interaction terms. The chemometric approach has a rational experimental design, which allows simultaneous variation of all experimental factors, reducing the required time and number of trials, which results in the reduction of the overall required costs. The Box–Behnken design (BBD) is probably the most widely used experimental design applied for fitting a second-order response surface. This cubic design is characterized by a set of points lying at the midpoint of each edge of a multidimensional cube and center point replicates, whereas the ‘missing corners’ help the experimenter to avoid using the combined factor extremes. This property prevents a potential loss of data in those cases.37

In this study, the StatGraphics plus 5.1 package was used for the analysis of the experimental design data and calculating the predicted responses.

3. Results and discussion

3.1. Characterization studies

3.1.1. FT-IR spectra and elemental analysis. The FT-IR spectra of MOF, and magnetic nanocomposite were recorded using KBr pellet method. The advent of the absorption peaks due to Fe–O (585 cm−1), Si–O–Si (1039 cm−1), C–H aliphatic (2933 and 2885 cm−1), and N–H (3441 cm−1) confirmed the immobilization of MOF by Fe3O4@En. Moreover, elemental analysis showed the presence of 3.2% N in the structure of the magnetic nanocomposite. This data indicated that Fe3O4@En had been sufficiently immobilized in the structure of magnetic nanocomposite (C: 23.5%, H: 1.6%, N: 3.2%).
3.1.2. TEM and SEM images. To investigate the surface morphology of the Fe3O4@En NPs, MOF and magnetic MOF nanocomposite, the samples were characterized by TEM or SEM (Fig. 2). As it is illustrated in Fig. 2a, the spherical structure of Fe3O4 NPs was approximately preserved after modification with AEAPTMS. In this figure, two regions with different electron densities can be distinguished, which confirmed the formation of the core–shell structure:38 an electron dense region that corresponds to Fe3O4 cores with a uniform size of about 10–30 nm and a less dense and more translucent region surrounding these cores that is AEAPTMS coating shell with a thickness of about 10–15 nm. Furthermore, the TEM micrograph confirmed that the Fe3O4@En NPs were nano-sized with an average particle size of 30 nm. The crystals of original MIL-101 (Fe) sample have a smooth surface with an average size of 200 nm (Fig. 2b). However, the surface of the magnetic nanocomposite tends to be rougher after Fe3O4@En immobilization (Fig. 2c). It was apparent that the modified Fe3O4 NPs were linked to the external surface of the MIL-101 crystals.
image file: c4ra15532g-f2.tif
Fig. 2 (a) The TEM image of Fe3O4@En, the SEM images of (b) MOF, and (c) magnetic MOF nanocomposite.
3.1.3. X-ray diffraction analysis. For further study, MOF and magnetic nanocomposite were characterized by XRD. All of the diffraction peaks of MIL-101 (Fe) can be seen in Fig. 1S (ESI) before modification. For magnetic nanocomposite, the modification of MIL-101 (Fe) with Fe3O4@En resulted in a loss of crystalline order in the framework. This was evidenced by a significant decrease in diffraction intensities (Fig. 3b), which was due to the partial decomposition of the crystalline MIL-101 (Fe).33,35 The advent of five characteristic peaks for Fe3O4 in the XRD parent of magnetic MOF and also the presence of three characteristic peaks for MIL-101 (Fe) revealed that this hybrid material was composed of Fe3O4@En and MIL-101 (Fe).
image file: c4ra15532g-f3.tif
Fig. 3 (a) Pareto chart of the main effects in the BBD (uptake step). AA, BB and CC are the quadratic effects of sample pH, the uptake time and the nanosorbent amount, respectively. AB, AC and BC are the interaction effects between sample pH and the uptake time, pH and the nanosorbent amount and the uptake time and the nanosorbent amount, respectively. (b) RSM and two-dimensional contour plot obtained by plotting pH vs. uptake time using the BBD.

3.2. Optimization of the preconcentration procedure

3.2.1. Sorption step. The optimization step for the sorption of metal ions on the magnetic nanocomposite was carried out using Box–Behnken design (BBD). Variables affecting the extraction efficiency were chosen: pH, amount of the magnetic nanocomposite, and extraction time. Other parameters involved in the extraction were kept constant, particularly the concentration of heavy metal ions (0.5 mg L−1). This design permitted the responses to be modeled by fitting a second-order polynomial, which can be expressed as the following equation:
Y = β0 + β1x1 + β2x2 + β3x3 + β12x1x2 + β13x1x3 + β23x2x3 + β11x12 + β22x22 + β33x32
where, x1, x2, and x3 are the independent variables, β0 is an intercept, β1β33 are the regression coefficients, and Y is the response (removal% or recovery%). The number of experiments (N) is defined by the expression given below:
N = 2K(K − 1) + Co
where K is the number of variables and Co is the number of center points.39 In this study, K and Co were set at 3 and 6, respectively, which meant that 18 experiments had to be done. The levels of the factors are listed in Table 1. The analysis of variance (ANOVA) results producing the Pareto chart of main and interaction effects are shown in Fig. 3a. The standard effect was estimated for computing the t-statistic for each effect. The vertical line on the plot shows statistically significant effects. The bar extracting beyond the line corresponds to the effects that are statistically significant at 95% confidence level.40–44 Furthermore, the positive or negative sign (corresponding to a colored or colorless response) can enhance or reduce the extraction efficiency, respectively, while increasing from the lowest to the highest level set for the specific factor. According to Pareto chart, the pH of the solution has the most significant positive effect on the extraction efficiency. The sorption of heavy metal ions increased as the pH increased. In acidic solution, sorption was very low. This observation was due to the protonation of the magnetic nanocomposite active sites, particularly N atoms of ethylenediamine. As the pH increased, the protonation of these active sites decreased and the condition became more favorable for complex formation and adsorption of heavy metal ions to the magnetic nanocomposite. At pH > 6.1, the extraction efficiencies of the target ions decreased due to the formation of insoluble hydroxide forms of metals. To avoid the precipitation of metal ions at higher pH values, pH 6.1 was selected as optimum. The response surface methodology (RSM) and two-dimensional contour plot (Fig. 3b) was applied to analyze the simultaneous effects of sorption time and pH variables on the response. The sorption efficiency of heavy metal ions increased along with the increase in pH, whereas the extraction time had a non-significant positive effect on the extraction of these ions. Sorption time and amount of the magnetic nanocomposite both showed positive and significant effect on the extraction efficiency. According to the overall results of the optimization study, the following experimental conditions were chosen: pH, 6.1; sorption time, 15 min; amount of the magnetic nanocomposite, 29 mg.
Table 1 Experimental variables and levels of the Box–Behnken design (BBD)
  Level
Lower Central Upper
Sorption step A: pH 2.0 5.0 8.0
B: uptake time (min) 5.0 12.5 20.0
C: nanocomposite amount (mg) 5 25 45
Elution step A: HNO3 concentration (mol L−1) 0.01 0.055 0.1
B: EDTA concentration (mol L−1) 0 0.5 1.0
C: eluent volume (mL) 2.0 4.0 6.0
D: elution time (min) 10.0 15.0 25.0


3.2.2. Selection of eluent. In this work, several eluents, including HCl, HNO3, K2SO4, NaOH, KCl, thiourea, EDTA solution, and their mixture were examined as the desorption solvent. Other factors were kept constant during the optimization (pH, 6.1; sorption time, 15 min; amount of the magnetic nanocomposite, 29 mg; eluent volume, 7.0 mL; elution time, 20 min). Results showed that HNO3 containing EDTA can recover the target ions. In the next step, the effect of eluent volume and its concentration as well as elution time were optimized.
3.2.3. Elution step. Three factors were studied in elution step using experimental design: eluent volume (mL), elution time (min), HNO3 concentration (mol L−l) and EDTA concentration (mol L−l). In these conditions, a response surface design could be done without previously performing a screening design. The BBD was chosen because it requires the least number of experiments (29 run). The data obtained were evaluated by ANOVA. The results of the experimental design were evaluated at 5% of significance and analyzed by standardized Pareto chart (Fig. 4a). Based on BBD, all parameters showed positive and significant effect on the recovery of target ions. These observations were most possibly due to the increased protonation of the hetero atoms of the sorbent as the concentration of the eluent increased, as well as coordination of heavy metal ions with EDTA, and also fast kinetics of elution process is of great importance. As Fig. 4a shows, EDTA concentration has the greatest influence on the extraction recovery. The RSM and two-dimensional contour plot (Fig. 4b) were applied to analyze simultaneous effects of the elution time and eluent volume on the responses. The extraction efficiency of the heavy metal ions increased along with an increase in the eluent volume and also elution time. According to the overall results of the optimization study, the following experimental conditions were chosen as the optimized ones: eluent volume, 4.2 mL; elution time, 17 min; and eluent concentration, 0.70 mol L−l EDTA in 0.07 mol L−l HNO3 solution.
image file: c4ra15532g-f4.tif
Fig. 4 (a) Pareto chart of the main effects in the BBD (elution step). AA, BB, CC and DD are the quadratic effects of HNO3 concentration, EDTA concentration, eluent volume and elution time, respectively. AB, AC, AD, BC, BD and CD are the interaction effects between HNO3 concentration and EDTA concentration, HNO3 concentration and eluent volume, HNO3 concentration and elution time, EDTA concentration and eluent volume, EDTA concentration and elution time, and eluent volume and elution time, respectively. (b) RSM and two-dimensional contour plot obtained by plotting eluent volume vs. elution time using the BBD.

3.3. Effect of breakthrough volume

In the analysis of real samples, the sample volume is one of the important parameters affecting the preconcentration factor. The breakthrough volume of sample solutions was investigated by dissolving 1 mg of each Cd(II), Pb(II), Zn(II) and Cr(III) ion in 100, 250, 500, 750, 1000, 1250 and 1500 mL of distilled water. Then, the SPE protocol was performed. The results demonstrated that the dilution effect was not significant for sample volumes of 1000 mL for each ion on the magnetic nanocomposite. Thus, the new sorbent enabling an enrichment factor of 238 was obtained for Cd(II), Pb(II), Zn(II) and Cr(III) ions.

3.4. Effect of the potentially interfering ions

To investigate the effect of the potentially interfering ions found in natural samples, various metal ions were added to 250 mL of a solution containing 10 μg of each ion. The degree of tolerance for potentially interfering ions is presented in Table 1S (ESI). From the tolerance results, it can be seen that even high levels of the potentially interfering ions have no impact on the preconcentration of Cd(II), Pb(II), Zn(II) and Cr(III) ions at pH 6.1. Therefore, the method could be applied to determine these heavy metal ions in samples with complicated matrix.

3.5. Sorption capacity study and reusability of the sorbent

In order to investigate the sorption capacity of the magnetic nanocomposite, a standard solution containing 7.0 mg L−1 of Cd(II), Pb(II), Zn(II) and Cr(III) ions was used. In order to evaluate the maximum sorption capacity, the initial and equilibrium amounts of heavy metal ions were determined by FAAS. The maximum sorption capacity is defined as the total amount of heavy metal ions sorbed per gram of the magnetic nanocomposite. The obtained capacities of the magnetic nanocomposite were found to be 155, 198, 164, and 173 mg g−1 for Cd(II), Pb(II), Zn(II) and Cr(III) ions, respectively.

The reusability of magnetic nanocomposite was tested by assessing the change in the recoveries of the analytes through several sorption–elution cycles under the opted conditions. The results revealed that the synthesized nanosorbent could be reused up to 12 times.

3.6. Analytical performance of the method

Under the optimal conditions, calibration curves were constructed for the determination of Cd(II), Pb(II), Zn(II) and Cr(III) ions, according to the mentioned procedure. Linearity was within the range of 0.5–100 ng mL−1 for Cd(II), 2.5–250 ng mL−1 for Pb(II), 0.6–120 ng mL−1 for Zn(II) and 1.5–150 ng mL−1 for Cr(III) in initial solution. The correlation of determination (r2) was 0.9975 for Cd(II), 0.9964 for Pb(II), 0.9938 for Zn(II) and 0.9955 for Cr(III) ions. The limit of detection was defined as LOD = 3Sb/m, where Sb is the standard deviation of 10 replicate blank signals and m is the slope of the calibration curve after preconcentration. For a sample volume of 1000 mL, it was found to be 0.15 ng mL−1 for Cd(II), 0.8 ng mL−1 for Pb(II), 0.2 ng mL−1 for Zn(II), and 0.5 ng mL−1 for Cr(III) ions. The precision of the method for a standard solution containing 30 ng mL−1 of heavy metal ions (n = 5) was evaluated as the relative standard deviation (RSD%) and was found to be 7.6, 4.9, 6.8 and 5.5% for Cd(II), Pb(II), Zn(II) and Cr(III) ions, respectively.

3.7. Validation of the method

The concentrations of Cd(II), Pb(II), Zn(II) and Cr(III) ions obtained by current method were compared to the exact concentration of these ions in the standard reference materials. For this reason, the concentration of the heavy metal ions was determined at optimum conditions in standard reference materials (NIST SRM 1573a tomato leaves and NIST SRM 1515 apple leaves). As it can be seen in Table 2, good correlation was achieved between the estimated content by the present method and reference materials. Therefore, the magnetic nanocomposite can be used as a reliable solid phase for the extraction and determination of Cd(II), Pb(II), Zn(II) and Cr(III) ions in agricultural samples.
Table 2 Determination of heavy metal ion recovery in certified reference materialsa
Sample Concentration (μg g−1) Relative error%
Element Certified Found
a BDL: below the detection limit.
NIST SRM 1515 apple leaves Cd 0.013 0.012 −7.7
Zn 12.5 12.0 −4.0
Pb 0.47 0.51 8.5
Cr BDL
SRM 1570a spinach leaves Cd 1.52 1.56 2.6
Zn BDL
Pb BDL
Cr 1.99 2.06 3.5


3.8. Determination of target ions in agricultural samples

Because natural samples have complex matrices, non-specific background absorption is always caused by interfering species of the sample matrix. To reduce this undesirable effect, the magnetic nanocomposite was applied for the selective extraction of Cd(II), Pb(II), Zn(II) and Cr(III) ions in pH 6.1. Table 3 shows the Cd(II), Pb(II), Zn(II) and Cr(III) ions recovery in various agricultural samples, which in all cases were almost quantitative.
Table 3 Determination of heavy metal ions in agricultural samples
Sample Element Real sample (μg g−1) Added (μg g−1) Found (μg g−1) Recovery (%)
Leek Cd 4.5 5.0 9.0 90.0
Pb 9.4 10.0 19.2 98.0
Zn 267 250 526 104
Cr 4.4 5.0 9.6 104
Fenugreek Cd 3.2 5.0 8.0 96.0
Pb 41.0 50.0 92.1 102
Zn 105 100 196 91.0
Cr 4.2 5.0 9.6 108
Garden cress Cd 1.7 2.0 3.6 95.0
Pb 59.1 50.0 104 89.8
Zn 192 200 380 94.0
Cr 3.3 5.0 8.1 96.0
Radish Cd 3.2 5.0 8.1 98.0
Pb 52.6 50.0 104 103
Zn 102 100 204 102
Cr 4.5 5.0 9.2 94.0
Radish leaves Cd 2.2 5.0 7.3 102
Pb 4.7 5.0 9.5 96.0
Zn 203 200 398 97.5
Cr 6.4 10.0 15.5 91.0
Beetroot leaves Cd 1.4 5.0 6.5 102
Pb 9.0 10.0 18.6 96.0
Zn 152 150 296 96.0
Cr 7.4 10.0 18.0 106
Basil Cd 1.0 2.0 2.9 95.0
Pb 7.2 10.0 16.8 96.0
Zn 145 150 284 92.7
Cr 8.5 10.0 18.6 101
Coriander Cd 1.9 2.0 4.1 110
Pb 16.5 10.0 27.1 106
Zn 169 150 300 87.3
Cr 5.6 5.0 10.0 88.0
Parsley Cd 2.8 5.0 7.5 94.0
Pb 18.3 20.0 38.4 106
Zn 200 200 393 96.5
Cr 5.6 10.0 15.3 97.0


4. Conclusion

A simple, fast, reproducible, and selective solid-phase extraction procedure and a novel magnetic metal–organic framework nanocomposite for determining cadmium, zinc, chromium and lead ions has been developed. In comparison with other solid-phases, the magnetic nanocomposite has the advantages of high enrichment capacity, low limit of detection, and high enrichment factor (Table 2S, ESI). Other advantages of this method are low time-consumption due to the magnetically-assisted separation of the adsorbent and higher surface area. Therefore, satisfactory results can be achieved by using fewer amounts of the adsorbents. Due to the relatively high preconcentration factor, the trace amounts of heavy metals at ng mL−1 levels in high-volume samples can be quantified by the magnetic nanocomposite.

Acknowledgements

The authors would like to thank Tabriz Branch, Islamic Azad University, Tabriz, Iran, for the financial support of this research.

References

  1. U. Farooq, M. A. Khan, M. Athar and J. A. Kozinski, Chem. Eng. J., 2011, 171, 400–410 CrossRef CAS PubMed.
  2. J. N. Bianchin, E. Martendal, R. Mior, V. N. Alves, C. S. T. Araújo, N. M. M. Coelho and E. Carasek, Talanta, 2009, 78, 333–336 CrossRef CAS PubMed.
  3. N. M. Kalariya, B. Nair, D. K. Kalariya, N. K. Wills and F. J. G. M. V. Kuijk, Toxicol. Lett., 2010, 198, 56–62 CrossRef CAS PubMed.
  4. M. Gharehbaghi, M. Davoudabadi Farahani and F. Shemirani, Anal. Methods, 2014, 6, 9258–9266 RSC.
  5. A. A. Asgharinezhad, H. Ebrahimzadeh, M. Rezvani, N. Shekari and M. Loni, Food Addit. Contam., Part A, 2014, 31, 1196–1204 CAS.
  6. H. Scherz and E. Kirchhoff, J. Food Compos. Anal., 2006, 19, 420–433 CrossRef CAS PubMed.
  7. Z. Bahadir, V. N. Bulut, D. Ozdes, C. Duran, H. Bekta and M. Soylak, J. Ind. Eng. Chem., 2014, 20, 1030–1034 CrossRef CAS PubMed.
  8. D. Bohrer, P. Cícero do Nascimento, M. Guterres, T. Trevisan and E. Seibert, Analyst, 1999, 124, 1345–1350 RSC.
  9. Y.-H. Sung and S.-D. Huang, Anal. Chim. Acta, 2003, 495, 165–176 CrossRef CAS PubMed.
  10. E. L. Silva, P. dos Santos Roldan and M. F. Giné, J. Hazard. Mater., 2009, 171, 1133–1138 CrossRef CAS PubMed.
  11. C. Duran, H. B. Senturk, L. Elci, M. Soylak and M. Tufekci, J. Hazard. Mater., 2009, 162, 292–299 CrossRef CAS PubMed.
  12. J. Yin, Z. Jiang, G. Chang and B. Hu, Anal. Chim. Acta, 2005, 540, 333–339 CrossRef CAS PubMed.
  13. B. Zawisza and R. Sitko, Spectrochim. Acta, Part B, 2007, 62, 1147–1152 CrossRef PubMed.
  14. P. Bruno, M. Caselli, G. Gennaro, P. Ielpo, T. Ladisa and C. M. Placentino, Chromatographia, 2006, 64, 537–542 CAS.
  15. S. Abe, K. Fuji and T. Sono, Anal. Chim. Acta, 1994, 293, 325–330 CrossRef CAS.
  16. J. Chen and K. C. Teo, Anal. Chim. Acta, 2011, 450, 215–222 CrossRef.
  17. M. M. Matlock, B. S. Howerton and D. A. Atwood, Water Res., 2002, 36, 4757–4764 CrossRef CAS.
  18. M. C. Yebra-Biurrun, A. Bermejo-Barrera, M. P. Bermejo-Barrera and M. C. Barciela-Alonso, Anal. Chim. Acta, 1995, 303, 341–345 CrossRef CAS.
  19. M. Rezvani, A. A. Asgharinezhad, H. Ebrahimzadeh and N. Shekari, Microchim. Acta, 2014, 181, 1887–1895 CrossRef CAS.
  20. A. Duran, M. Tuzen and M. Soylak, J. Hazard. Mater., 2009, 169, 466–471 CrossRef CAS PubMed.
  21. M. Tuzen, M. Soylak and L. Elci, Anal. Chim. Acta, 2005, 548, 101–108 CrossRef CAS PubMed.
  22. M. Tuzen, K. O. Saygi and M. Soylak, J. Hazard. Mater., 2008, 156, 591–595 CrossRef CAS PubMed.
  23. A. A. ALOthman, M. Habila, E. Yilmaz and M. Soylak, Microchim. Acta, 2012, 177, 397–403 CrossRef.
  24. M. Taghizadeh, A. A. Asgharinezhad, N. Samkhaniany, A. Tadjarodi, A. Abbaszadeh and M. Pooladi, Microchim. Acta, 2014, 181, 597–605 CrossRef CAS.
  25. A. A. Asgharinezhad, N. Mollazadeh, H. Ebrahimzadeh, F. Mirbabaei and N. Shekari, J. Chromatogr. A, 2014, 1338, 1–8 CrossRef CAS PubMed.
  26. A. A. Asgharinezhad, H. Ebrahimzadeh, F. Mirbabaei, N. Mollazadeh and N. Shekari, Anal. Chim. Acta, 2014, 844, 80–89 CrossRef CAS PubMed.
  27. H. Parham, N. Pourreza and N. Rahbar, J. Hazard. Mater., 2009, 163, 588–592 CrossRef CAS PubMed.
  28. M. Faraji, Y. Yamini and S. Shariati, J. Hazard. Mater., 2009, 166, 1383–1388 CrossRef CAS PubMed.
  29. M. R. Sohrabi, Z. Matbouie, A. A. Asgharinezhad and A. Dehghani, Microchim. Acta, 2013, 180, 589–597 CrossRef CAS.
  30. M. Taghizadeh, A. A. Asgharinezhad, M. Pooladi, M. Barzin, A. Abbaszadeh and A. Tadjarodi, Microchim. Acta, 2013, 180, 1073–1084 CrossRef CAS.
  31. H. K. Chae, D. Y. Siberio-Perez, J. Kim, Y. Go, M. Eddaoudi, A. J. Matzger, M. O'Keeffe and O. M. Yaghi, Nature, 2004, 427, 523–527 CrossRef CAS PubMed.
  32. O. Shekhah, J. Liu, R. A. Fischer and C. Wöll, Chem. Soc. Rev., 2011, 40, 1081–1106 RSC.
  33. F. Ke, L.-G. Qiu, Y.-P. Yuan, F.-M. Peng, X. Jiang, A.-J. Xie, Y.-H. Shen and J.-F. Zhu, J. Hazard. Mater., 2011, 196, 36–43 CrossRef CAS PubMed.
  34. A. S. M. Chong and X. S. Zhao, J. Phys. Chem. B, 2003, 107, 12650–12657 CrossRef CAS.
  35. S. Bauer, C. Serre, T. Devic, P. Horcajada, J. Marrot, G. Férey and N. Stock, Inorg. Chem., 2008, 47, 7568–7576 CrossRef CAS PubMed.
  36. A. B. Yilmaz, Environ. Res., 2003, 92, 277–281 CrossRef CAS.
  37. G. E. P. Box and N. R. Draper, Empirical Model Building and Response Surfaces, John Wiley and Sons, New York, 1987 Search PubMed.
  38. H. Helmi, R. Helmi, N. Shahtahmassebi, M. R. Roknabadi and N. Ghows, Nanomed. J., 2014, 1, 71–78 Search PubMed.
  39. F. Kamarei, H. Ebrahimzadeh and A. A. Asgharinezhad, J. Sep. Sci., 2011, 34, 2719–2725 CrossRef CAS PubMed.
  40. StatGraphics Plus 5.1 for Windows, Statistical Graphic Crop., online manuals, 2001 Search PubMed.
  41. H. Ebrahimzadeh, N. Shekari, Z. Saharkhiz and A. A. Asgharinezhad, Talanta, 2012, 94, 77–83 CrossRef CAS PubMed.
  42. H. Ebrahimzadeh, N. Mollazadeh, A. A. Asgharinezhad, N. Shekari and F. Mirbabaei, J. Sep. Sci., 2013, 36, 3783–3790 CrossRef CAS PubMed.
  43. L. Adlnasab, H. Ebrahimzadeh, A. A. Asgharinezhad, M. Nasiri Aghdam, A. Dehghani and S. Esmaeilpour, Food Anal. Methods, 2014, 7, 616–628 CrossRef.
  44. V. Amani, S. Roshan, A. A. Asgharinezhad, E. Najafi, H. Abedi, N. Tavassoli and H. R. Lotfi Zadeh Zhad, Anal. Methods, 2011, 3, 2261–2267 RSC.

Footnote

Electronic supplementary information (ESI) available. See DOI: 10.1039/c4ra15532g

This journal is © The Royal Society of Chemistry 2015