
Molecular modeling studies of dihydro-alkyloxy-benzyl-oxopyrimidines (DABOs) as non-nucleoside inhibitors of HIV-1 reverse transcriptase using 3D-QSAR, Topomer CoMFA and molecular docking simulations
Minghui Dong and
Yujie Ren*
School of Chemical and Environmental Engineering, Shanghai Institute of Technology, Shanghai, P. R. China. E-mail: clab@sit.edu.cn
First published on 21st January 2015
Abstract
The human immunodeficiency virus type 1 (HIV-1) reverse transcriptase (RT) is generally regarded as a target for the treatment of acquired immune deficiency syndrome (AIDS). Non-nucleoside RT inhibitors (commonly known as NNRTIs) are currently being used in the treatment of HIV-1 infections. In this work, a series of NNRTIs were studied using a combination of molecular modeling techniques including three-dimensional quantitative structure–activity relationship (3D-QSAR), Topomer CoMFA and molecular docking simulations. The best optimum comparative molecule field analysis (CoMFA) model yielded a leave-one-out correlation coefficient (q2) and a non-cross-validated correlation coefficient (r2) of 0.636 and 0.993, respectively. The respective q2 and r2 of the best comparative molecular similarity indices analysis (CoMSIA) model were 0.655 and 0.998. The models were validated by test sets, and predicted correlation coefficients (rpred2) of 0.907 and 0.886 obtained from the CoMFA and CoMSIA models, thus judging the robustness of the model. The analysis of Topomer CoMFA obtained a q2 of 0.546 and a rpred2 value of 0.718 which suggested the model had a good predictive ability (q2 > 0.2). The results indicated the steric, hydrophobic and electrostatic fields play key roles in the models. Molecular docking elucidated the conformations of the compounds and key amino acid residues at the docking pocket of RT protein.
1. Introduction
The HIV-1 infection causes acquired immunodeficiency syndrome that is a fatal human health-threatening disease.1 The disease presents a serious health care challenge because each year it affects an increasing number of people.2 Since the time when it was recognized 30 years ago, 30 million people have died of HIV-related causes.3 An estimated 34 million people are living with HIV/AIDS worldwide.4,5 Among them about 3.4 million children aged less than 15 years have been infected mainly through mother-to-children transmission.6 In 2010, 1.8 million people died of AIDS related illness,7 it has further reaching implications in terms of economic, social and political stability.8In AIDS therapy, the fundamental strategy is to inhibit viral replication. Many studies have demonstrated that the viral reverse transcriptase of HIV was a multifunctional enzyme critical to the viral life cycle, and thus provided an attractive target in the search for anti-HIV therapies.9 HIV was first isolated in 1983 by Luc Montagnier10 and accepted as the causative agent of AIDS by 1984,11 had a single strand RNA containing its genomic material and the viral enzyme reverse transcriptase enables the virus to utilise this single strand RNA genome as a template for the production of an intermediate single DNA strand, and ultimately double-stranded DNA.12 Among the major types of HIV originated from primate species, HIV-1 which is more easily transmitted and accounts for the vast majority of global HIV infections.13,14 The HIV-1 RT is an asymmetric heterodimer, comprising a p66 subunit (560 amino acids) and a p51 subunit (440 amino acids)15 which has been used as an effective target for antiretroviral drugs.
To combat disease, several drugs which are currently in clinical use have been developed to inhibit this potential target, including Nevirapine,16 TIBO,17 PETT,18 TNK-651,19 Delavirdine20 and HEPT21 (Fig.1). NNRTIs inhibit RT by binding to the enzyme in a hydrophobic pocket located at a distance of around 10 Å from its catalytic site.22 However, their therapeutic effectiveness are limited by toxicity, unfavorable pharmacokinetics and emergence of resistant viral strains.23–25 The ability of the virus to circumvent the inhibitors via mutation clearly signifies the need for improved therapeutic agents.26 Therefore, there is still a need to identify new NNRTIs, eliciting intense efforts in the development of potent inhibitors. Fortunately, the dihydro-alkyloxy-benzyl-oxopyrimidines (DABOs)27–29 derivatives were disclosed as non-nucleoside reverse transcriptase inhibitor (NNRTI)30,31 by Artico et al. group in 1992,32–34 endowed with inhibitory potencies in the low nanomolar range.
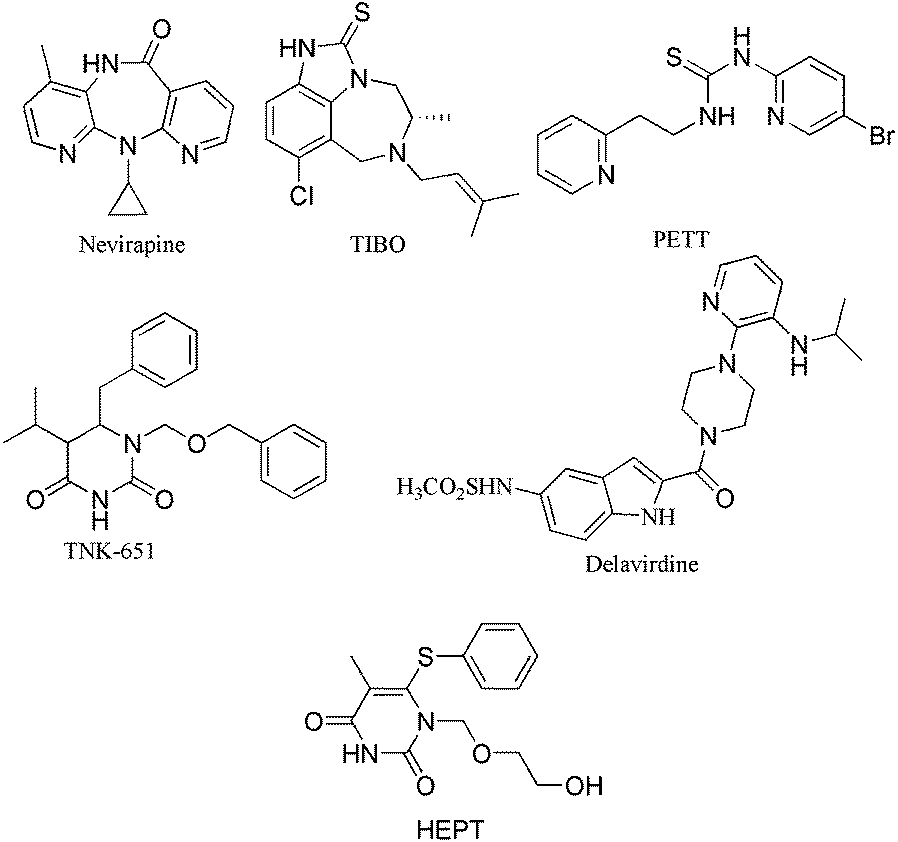 | ||
| Fig. 1 Chemical structures of Well-Known RT Inhibitors. | ||
For saving resources and expedite the development of NNRTIs, computer simulation techniques used to offer further means or design effective inhibitors about RT and explore the inhibition mechanisms, recently. Among several computational methods, the quantitative structure–activity relationship (QSAR)35 study is one of the most effective computational approaches in drug design without a doubt. The results of comparative molecular field analysis (CoMFA)36 and the comparative molecular similarity indices analysis (CoMSIA)37 studies not only used to predict the activity of newly inhibitors but provide beneficial information in structural modification. Up till now, it has been successfully applied in many biological and medicinal studies.
This method has been applied to facilitate the design of more specific and potent HIV-1 inhibitors. Such as, Horrick Sharma et al.38 used 3D-QSAR method to study of 3-keto salicylic acid chalcones and related amides as novel HIV-1 integrase inhibitors, Hamid Abedi et al.39 developed a 3D-QSAR model for new phenyloxazolidinones derivatives as potent HIV-1 protease inhibitors and so on. In this work, 3D-QSAR based on the ligand-based alignment rule, applied to determine the structural factors that affect the inhibitory activity of RT inhibitors. In addition, we used the second generation of CoMFA technique-Topomer CoMFA which generated a QSAR model by splitting the molecule into fragments, aligning each fragment and calculating steric and electrostatic field descriptor values for the topomerically aligned fragments. The contour maps got by models were used to support each other. Molecular docking was carried out to study the possible binding modes of inhibitors at the active site of HIV-1 protein. To the best of our knowledge, this is the first report on 3D-QSAR-CoMFA/CoMSIA/Topomer models for this series of compounds. Also, have not been reported simultaneously in the literature. The models and docking information derived, we hope, will be of great assistance in NNRTIs and accurate activity predictions for newly designed HIV-1 reverse transcriptase inhibitors in future.
2. Results and discussion
2.1 Computational approach
The 3D-QSAR, Topomer CoMFA modeling analyses, calculations, molecular docking simulations were performed using the SYBYL-X 2.0 package (Tripos Inc. St. Louis, USA) running on windows 7 workstation. All compounds (creation of training set, test set and docking calculations) involved in this study were optimized using Tripos force field and Gasteiger–Huckel charges. The structural energy minimization was terminated when using Powell gradient algorithm with a convergence criterion of 0.005 kcal/(mol Å) reached and a maximum of 10![[thin space (1/6-em)]](https://www.rsc.org/images/entities/char_2009.gif) 000 iterations.
000 iterations.
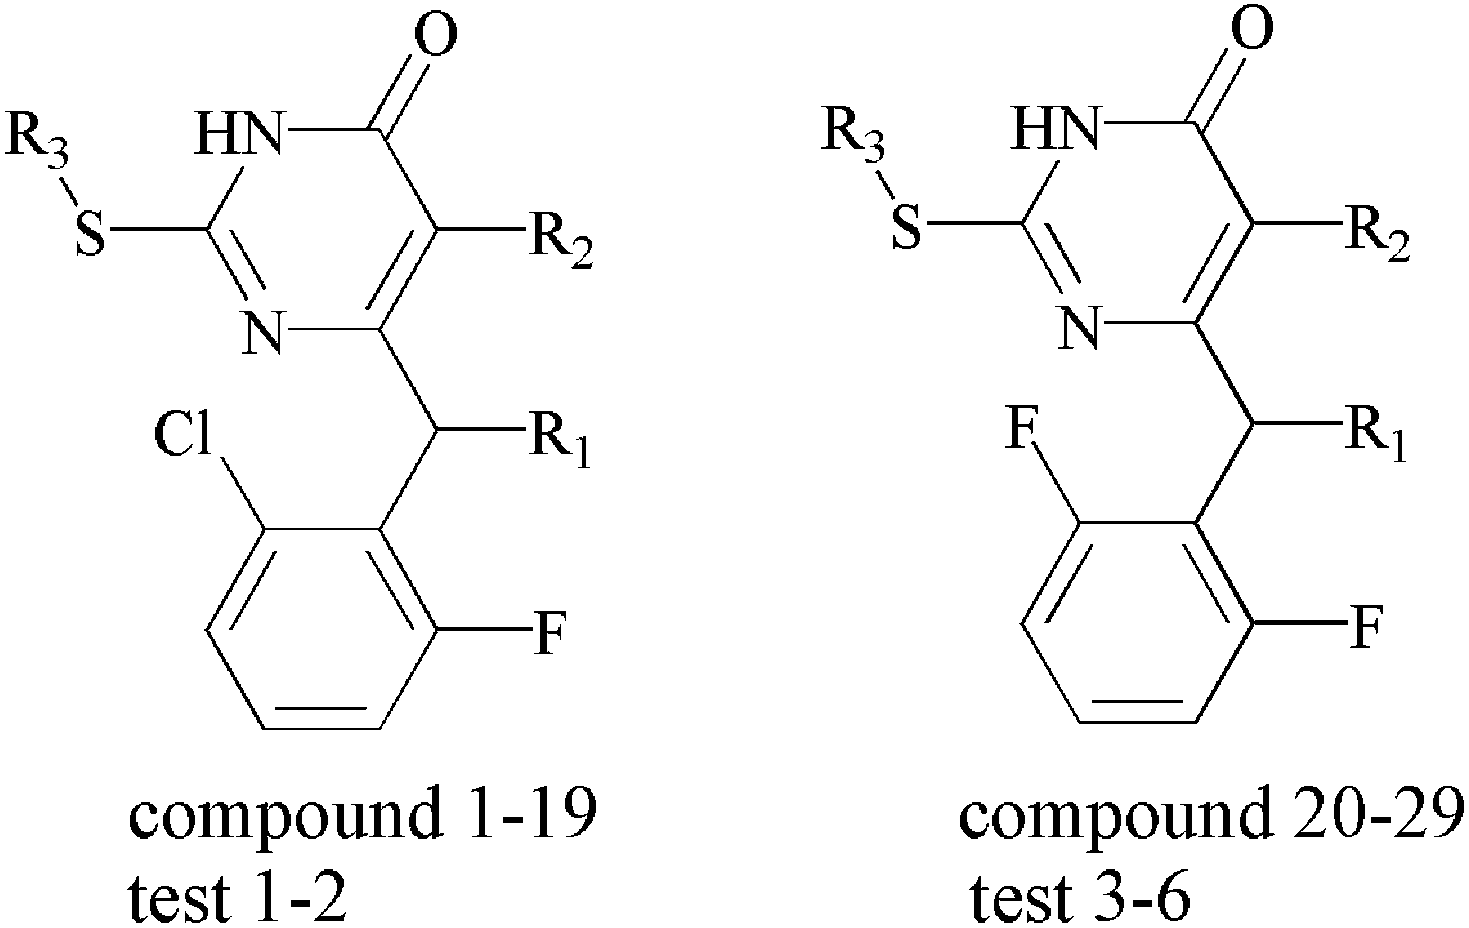
2.2 Data sets
The 35 compounds involved in this study which were reported recently by Dante Rotili.40 Their capability to inhibit by 50% the HIV-1-induced cytopathic effect in MT-4 cells (HIV-1 Strain:NL4-3) were expressed as micromolar (μM) units and converted to corresponding pEC50 values according to the following formula:| pEC50 = −lgEC50 |
The samples were randomly divided into a training set of 29 compounds for model generation and a test set of 6 compounds for model validation. The data set was selected by considering both the distribution of biological data and structural diversity. The structures and Anti-HIV-1 activities expressed as pEC50 against HIV-1 are shown in Table 1. In this study, the highest activity of compound 14 is taken as the template molecule and each molecule has to be superimposed onto it for the analysis. The alignment of training set is shown in Fig. 2a. As shown in Fig. 2b, the red atoms used to automatically position the compounds by using database alignment.
|
||||||||
|---|---|---|---|---|---|---|---|---|
| No | R1 | R2 | R3 | Actual pEC50 | Predicted COMFA | Residual | Predicted COMSIA | Residual |
| a Test = test set compounds. | ||||||||
| 1 | H | H | i-Pr | 6.42 | 6.431 | −0.011 | 6.419 | 0.001 |
| 2 | H | H | s-Bu | 6.80 | 6.752 | 0.048 | 6.776 | 0.024 |
| 3 | H | H | n-Bu | 6.54 | 6.583 | −0.043 | 6.562 | −0.022 |
| 4 | H | Me | i-Pr | 6.92 | 6.946 | −0.026 | 6.905 | 0.015 |
| 5 | H | Me | n-Pr | 7.07 | 7.091 | −0.021 | 7.149 | −0.079 |
| 6 | H | Me | s-Bu | 7.33 | 7.252 | 0.078 | 7.272 | 0.058 |
| 7 | H | Me | n-Bu | 6.96 | 7.071 | −0.111 | 7.000 | −0.040 |
| 8 | Me | H | i-Pr | 8.70 | 8.952 | −0.252 | 8.816 | −0.116 |
| 9 | Me | H | n-Pr | 8.52 | 8.469 | 0.051 | 8.476 | 0.044 |
| 10 | Me | H | s-Bu | 9.00 | 9.025 | −0.025 | 8.941 | 0.059 |
| 11 | Me | H | Cyclopentyl | 9.52 | 9.278 | 0.242 | 9.522 | −0.002 |
| 12 | Me | Me | n-Pr | 10.30 | 10.307 | −0.007 | 10.207 | 0.093 |
| 13 | Me | Me | s-Bu | 9.52 | 9.473 | 0.047 | 9.560 | −0.040 |
| 14 | Me | Me | Cyclopentyl | 10.52 | 10.517 | 0.003 | 10.524 | −0.004 |
| 15 | Me | Et | n-Pr | 7.55 | 7.536 | 0.014 | 7.527 | 0.023 |
| 16 | Me | Et | n-Bu | 7.19 | 7.098 | 0.092 | 7.159 | 0.031 |
| 17 | Et | Me | n-Pr | 7.59 | 7.497 | 0.093 | 7.605 | −0.015 |
| 18 | Et | Me | s-Bu | 7.27 | 7.263 | 0.007 | 7.251 | 0.019 |
| 19 | Et | Me | n-Bu | 6.96 | 6.905 | 0.055 | 6.963 | −0.003 |
| 20 | Me | Me | i-Pr | 9.00 | 8.903 | 0.097 | 8.985 | 0.015 |
| 21 | Me | Me | n-Pr | 7.55 | 7.453 | 0.097 | 7.625 | −0.075 |
| 22 | Me | Me | s-Bu | 9.05 | 9.151 | −0.101 | 9.112 | −0.062 |
| 23 | Me | Me | n-Bu | 7.30 | 7.482 | −0.182 | 7.302 | −0.002 |
| 24 | Me | Et | i-Pr | 7.05 | 7.113 | −0.063 | 7.005 | 0.045 |
| 25 | Me | Et | n-Pr | 6.62 | 6.586 | 0.034 | 6.592 | 0.028 |
| 26 | Et | Me | i-Pr | 8.40 | 8.581 | −0.181 | 8.374 | 0.026 |
| 27 | Et | Me | n-Pr | 7.92 | 7.884 | 0.036 | 7.916 | 0.004 |
| 28 | Et | Me | s-Bu | 9.10 | 9.048 | 0.052 | 9.119 | −0.019 |
| 29 | Et | Me | Cyclopentyl | 7.96 | 7.984 | −0.024 | 7.966 | −0.006 |
| Test1a | H | H | Cyclopentyl | 6.82 | 6.767 | 0.053 | 7.373 | 0.553 |
| Test2 | H | Me | Cyclopentyl | 6.74 | 6.933 | −0.193 | 6.828 | −0.088 |
| Test3 | Me | Me | Cyclopentyl | 9.00 | 8.771 | 0.229 | 8.835 | 0.165 |
| Test4 | Me | Et | s-Bu | 6.85 | 7.743 | −0.893 | 7.614 | −0.764 |
| Test5 | Me | Et | n-Bu | 7.64 | 6.792 | 0.848 | 7.121 | 0.519 |
| Test6 | Me | Et | Cyclopentyl | 6.8 | 7.213 | −0.413 | 7.577 | −0.777 |
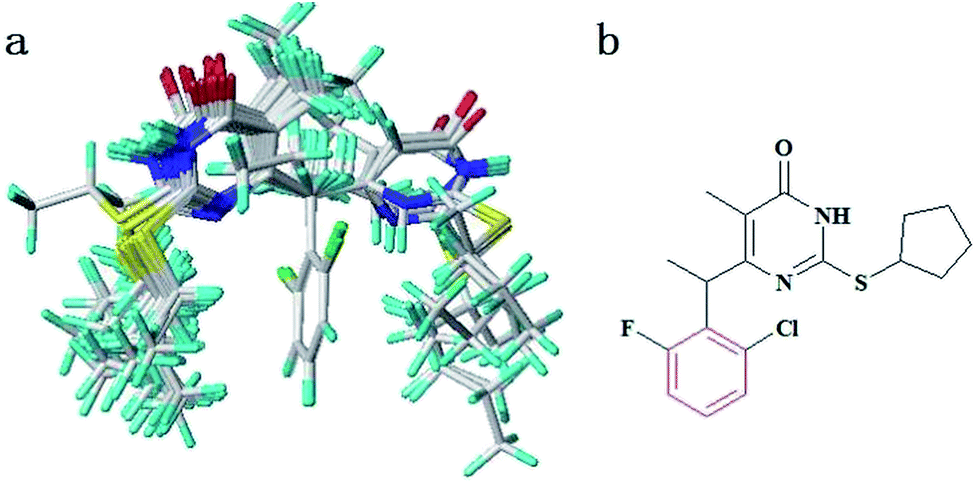 | ||
| Fig. 2 (a) The alignment of training set compounds. (b) The atoms used to automatically position the compounds by using database alignment (red). | ||
Topomer CoMFA is the second generation of CoMFA. The study was carried out with the same training and test sets, each of the training set structure was broken into two sets of fragments shown as R1 (red) and R2 (blue) groups as shown in Fig. 3. The method provides a means for an alignment-independent 3D-QSAR approach, which providing the means for automated search for activity in fragment libraries. Each topomer fragment was applied with topomer alignment to make a 3D invariant representation.41 Steric and electrostatic interaction energies were calculated using the carbon sp3 probe.
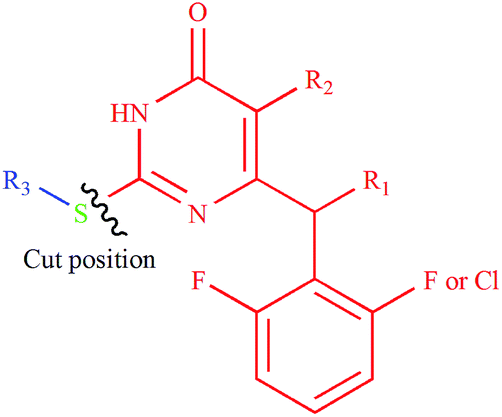 | ||
| Fig. 3 R1 fragment is represented by the red color and R2 fragment is represented by sky blue color. | ||
2.3 CoMFA, CoMSIA and Topomer CoMFA statistical results
To generate statistically significant 3D-QSAR models, we used the ligand-based alignment rule. The alignment result is shown in Fig. 2. In this study, the regression analysis was carried out using the partial least squares (PLS) method,42,43 some statistical parameters were used to analysis the stand or fall of these models, including the cross-validated coefficient (q2), the standard deviation of error prediction (r2), standard error of estimate (SEE) and F-statistic values, a high q2 and r2 value (q2 > 0.5, r2 > 0.6) is considered as a proof of high predictive ability of the model.44 Table 2 lists the statistical parameter results of the CoMFA and CoMSIA analyses. For CoMFA analysis, steric and electrostatic fields were considered, which gave an optimal number of components (ONC) of 8 and q2 of 0.636. The standard deviation of error prediction r2, SEE and F-statistic values are 0.993, 0.118 and 333.5, respectively. The contributions of the steric and electrostatic fields are 58.5% and 41.5%. For CoMSIA analysis, five descriptor fields were considered. The CoMSIA model obtained satisfactory q2, r2, SEE and F-statistic values of 0.655, 0.998, 0.069 and 488.2, respectively. The steric, electrostatic, hydrophobic, hydrogen bond donor, and hydrogen bond acceptor fields contribution of 22.1%, 19.9%, 24.5%, 18.7% and 14.8%, respectively. The steric, electrostatic, hydrophobic fields were found to be the important contributions in the optimal CoMSIA model. All the statistical results of different fields summarized in Table 2. The actual and predicted pEC50 value of the training and test set molecules were illustrated in Fig. 4, respectively.| q2 | ONC | r2 | SEE | F | rpred2 | Field contributiona(%) | |||||
|---|---|---|---|---|---|---|---|---|---|---|---|
| S | E | H | D | A | |||||||
| a Abbreviations: COMFA and COMSIA with different field contributions such as S (steric); E (electrostatic); H (hydrophobic); D (H-bond donor); A (H-bond acceptor). | |||||||||||
| COMFA | |||||||||||
| S + E | 0.636 | 8 | 0.993 | 0.118 | 333.5 | 0.907 | 58.5 | 41.5 | — | — | — |
|
|||||||||||
| COMSIA | |||||||||||
| H + A | 0.604 | 11 | 0.992 | 0.129 | 202.0 | 0.964 | — | — | 65.3 | — | 34.7 |
| S + A | 0.678 | 11 | 0.987 | 0.170 | 115.6 | 0.910 | 63.2 | — | — | — | 36.8 |
| H + D | 0.742 | 12 | 0.995 | 0.107 | 268.7 | 0.844 | — | — | 64.5 | 35.5 | — |
| S + H | 0.814 | 9 | 0.991 | 0.133 | 232.8 | 0.864 | 44.2 | — | 55.8 | — | — |
| S + E + H | 0.697 | 14 | 0.998 | 0.072 | 517.2 | 0.820 | 29.9 | 35.7 | 34.4 | — | — |
| S + H + D | 0.842 | 12 | 0.996 | 0.100 | 308.8 | 0.828 | 30.6 | — | 40.8 | 28.6 | — |
| S + H + A | 0.757 | 11 | 0.996 | 0.098 | 353.7 | 0.913 | 33.3 | — | 42.3 | — | 24.4 |
| S + E + H + D | 0.711 | 16 | 0.999 | 0.060 | 643.2 | 0.826 | 25.2 | 25.7 | 29.4 | 19.8 | — |
| S + E + H + A + D | 0.655 | 16 | 0.998 | 0.069 | 488.2 | 0.886 | 22.1 | 19.9 | 24.5 | 18.7 | 14.8 |
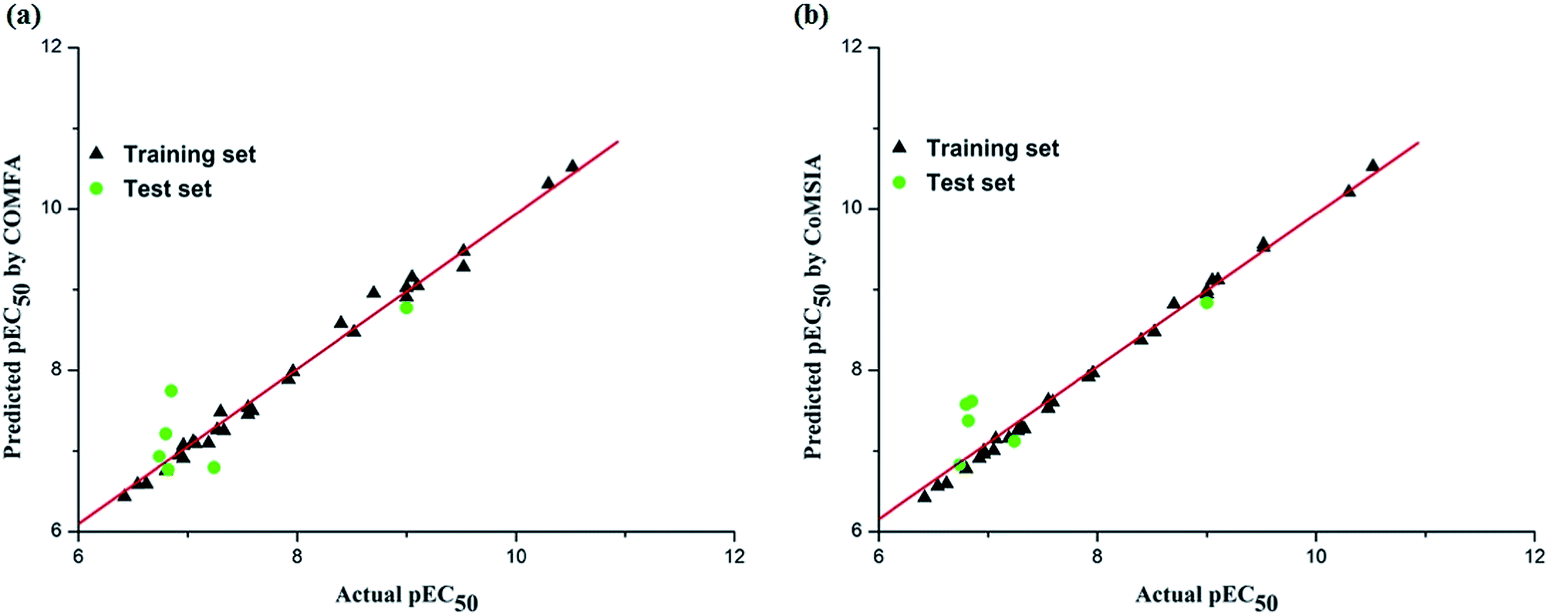 | ||
| Fig. 4 Plots of predicted versus actual pEC50 values for all the molecules based on CoMFA (a) and CoMSIA models (b). | ||
In Topomer CoMFA analysis, all the models were investigated using the full cross validated (q2) PLS leave-one-out (LOO) method with CoMFA standard options for scaling of the variables. The model reflects the quantitative relationship between the structure and activity. The q2 value of 0.546, an optimized component of 6 and r2 value of 0.798, which suggested the model also has predictive ability (q2 > 0.2). The pEC50 value of test set was predicted with the rpred2 value of 0.718.
2.4 Contour maps of CoMFA, CoMSIA and Topomer CoMFA
To visualize the field effects on the target compound in 3D space, the model results were graphically interpreted by using field type “StDev*Coeff”. For choosing the best biological activity against HIV-1 cells which makes it is easier to explain the contour maps. Hence using compound 14 as a reference structure to illustrate all contour maps of the models, explaining the key structural features required for inhibitory activity.As shown in Fig. 5a and b, the sterically favorable regions are represented in green and yellow contours suggest that the bulky subsituents would not be tolerated. The default values of 80% contribution for favored and 20% for disfavored regions were set for visualization of the contour maps. It can be observed that the steric contour map of COMFA is similar to that of COMSIA. The Topomer CoMFA 3D interaction maps (steric interactions) around R1 and R2 are shown in Fig. 5c and d, respectively. The meaning of colors is the same as the CoMFA's. The steric descriptor is found to be identical with the CoMFA and CoMSIA models, which prove the consistency of the results. A green contour covering the cyclopentyl group links to R3 indicates the presence of a bulky group for good biological activity. This is in agreement with the experimental data. The order of inhibitory activity is: isomeric (i) > normal (n) and secondary (s) > normal (n). For example, 2 (s-Bu) > 3 (n-Bu), 6 (s-Bu) > 7 (n-Bu), 8 (i-Pr) > 9 (n-Pr), 18 (s-Bu) > 19 (n-Bu), 20 (i-Pr) > 21 (n-Pr), 22 (s-Bu) > 23 (n-Bu), 24 (i-Pr) > 25 (n-Pr), 26 (i-Pr) > 27 (n-Pr). The yellow contour surrounding the R2 position indicates that compound with bulky substitution could not possess better biological activity as observed in 15 (Et) < 12 (Me), 24 (Et) < 20 (Me) and 25 (Et) < 21 (Me).
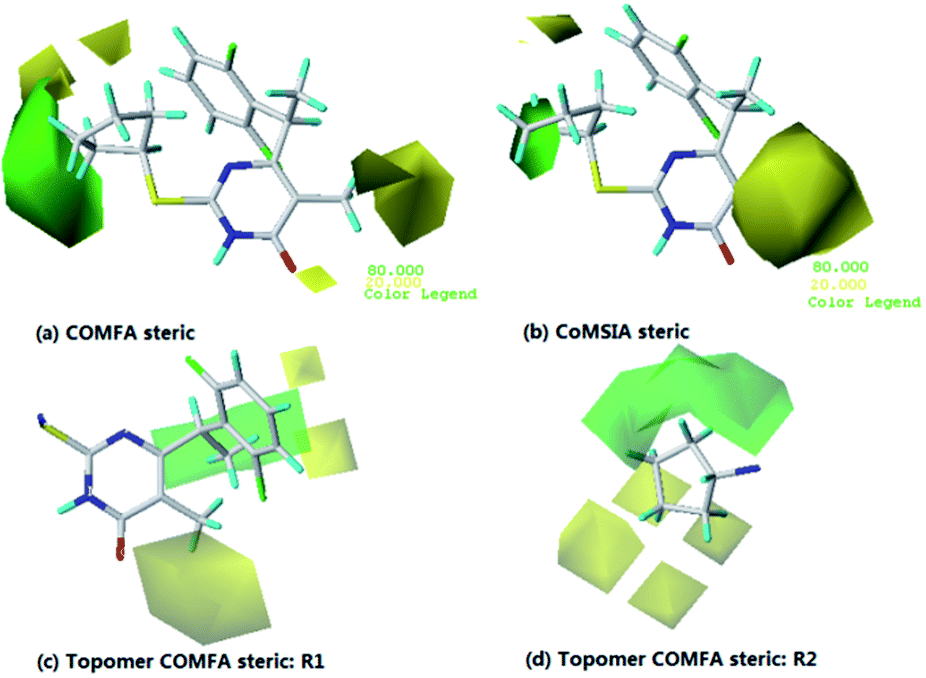 | ||
| Fig. 5 Contour maps of CoMFA (a) and COMSIA (b) based on compounds 14. Topomer CoMFA contour maps around R1 (c) and R2 (d). Steric fields: favored (green) and disfavored (yellow). | ||
In Fig. 6a, a large blue color contour around the pyrimidine group indicates that the electropositive groups are favorable to the activity, the red region around O atom at the pyrimidine ring suggests the electronegative groups are favorable to the activity. As shown in Fig 6b, two pieces of medium-sized region of blue contour locate at the pyrimidine group shows the importance of electropositive atoms in imparting better biological activity. The result of Topomer CoMFA (electrostatic contour map) is almost similar to that of the CoMFA and CoMSIA model, the analysis of the electrostatic contour map is neglected herein. Moreover, it is recognized that all the models have a blue contour region around R3 position, which indicates that with electropositive groups lead to a increase of bioactivity.
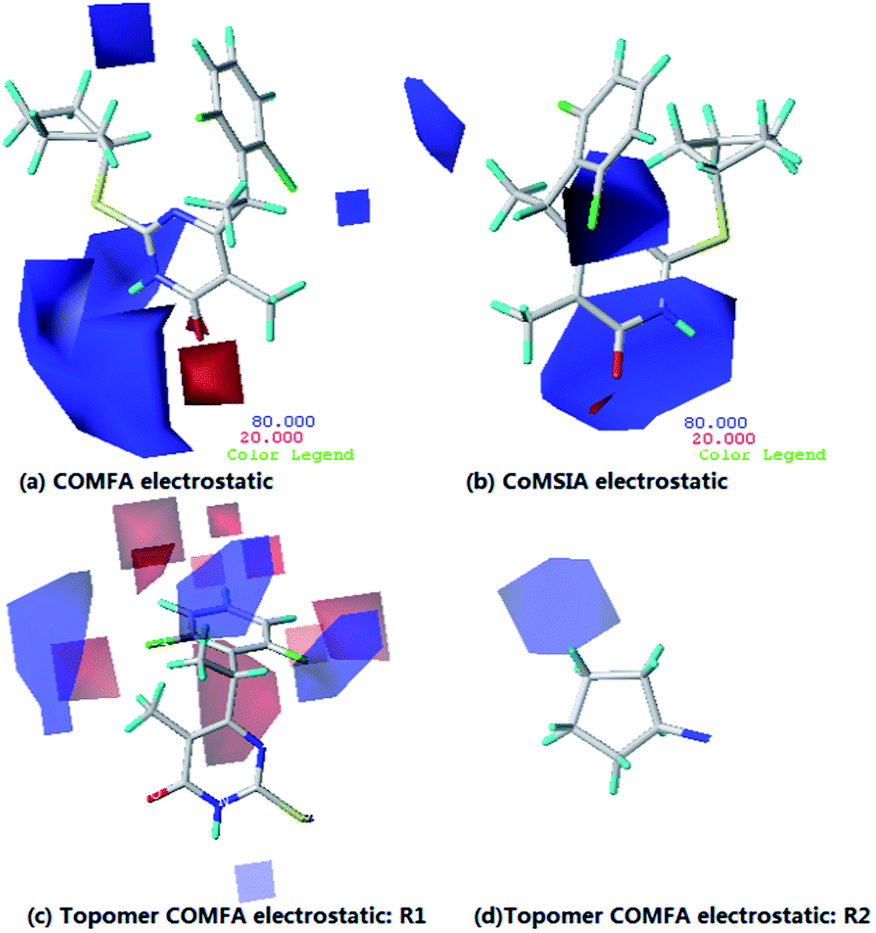 | ||
| Fig. 6 Contour maps of CoMFA (a) and COMSIA (b) based on compounds 14. Topomer CoMFA contour maps around R1 (c) and R2 (d). Electrostatic fields: electropositive (blue) and electronegative (red). | ||
As shown in Table 2, the hydrophobic field was found to be the most important contributions in the optimal CoMSIA model. It plays important role in bioactivity than other fields. From Fig. 7a, one large yellow (hydrophobic favorable) contour map cross the R2 position, suggesting introduction of hydrophobic substituents into the ring pyrimidine will be benefit for inhibitory activity. This is in agreement with the experimental data: 4(–CH3) > 1(H), 6(–CH3) > 2(H), 7(–CH3) > 3(H), 12(–CH3) > 9(H), 13(–CH3) > 10(H) and 14(–CH3) > 11(H). Besides, a small yellow contour map observed farther from R3, indicating the hydrophobic field has little effect on inhibitory activity.
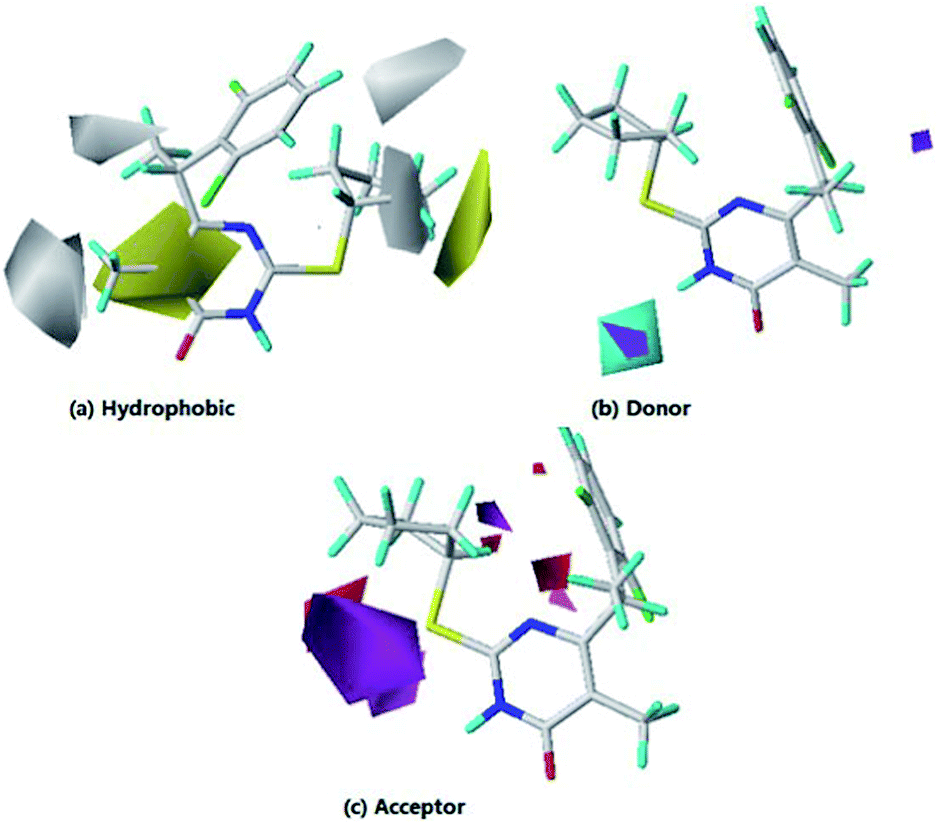 | ||
| Fig. 7 Contour maps of COMSIA based on compounds 14.(a) Hydrophobic field: the yellow color shows the favored hydrophobic area, the white color shows the disfavored hydrophobic area. (b) Hydrogen bond donor field: the cyan color shows the favored H-donor area, and the purple color represents the disfavored H-donor area. (c) Hydrogen bond acceptor field: the magenta color shows the favored H-acceptor area, the red color shows the disfavored H-acceptor area. | ||
One small white (hydrophilic favorable) contour map around the ring cyclopentyl (R3), suggesting that introduction of hydrophilic substituents into the ring cyclopentyl may be benefit for inhibitory activity. Since the other white contour maps farther from compound 14, the analysis of these contour maps are neglected herein. As shown in Fig. 7b and c, the purple contour represents where hydrogen bond donor disfavors the biological activity and the cyan contour shows the favored hydrogen bond donor area, in which the magenta color shows the hydrogen bond acceptor group would be beneficial to the bioactivity, whereas the red color shows the disfavored H-acceptor area.
2.5 Docking analysis
To validate the 3D-QSAR results, docking simulation was performed to study the binding environment. Here, the Surflex program (SYBYL-X 2.0, Tripos Inc. St Louis, USA) was used to explore the probable binding conformation. Initially, the performance of docking software was tested by re-docking experiment. For this purpose, crystal structure of protein (PDB code:1KLM) with the cognate ligand was re-docked. As is shown in Fig.8, it can be recognized that the re-docking result and the cognate ligand are almost completely superimposed together. Their rotational tendency are basically similar. Meanwhile, it shows interacting modes of U-90152 in the binding site of RT receptor, some key amino acids (Lys104, Tyr188, Tyr181, His235, Val106, Leu100 and Pro236) interact with the inhibitor by hydrophobic interactions at the binding site. The key residue Lys103 interact with the inhibitor by hydrogen bond. The hydrogen bond distances observed are 2.04 Å (Lys103–HN–H⋯O–), 1.98 Å (Lys103–O⋯H–NH–), respectively. Two of these interactions are similar to the results discussed by Robert et al.45 Both results can be inferred that the rationality of the program, and the docking result is reliable.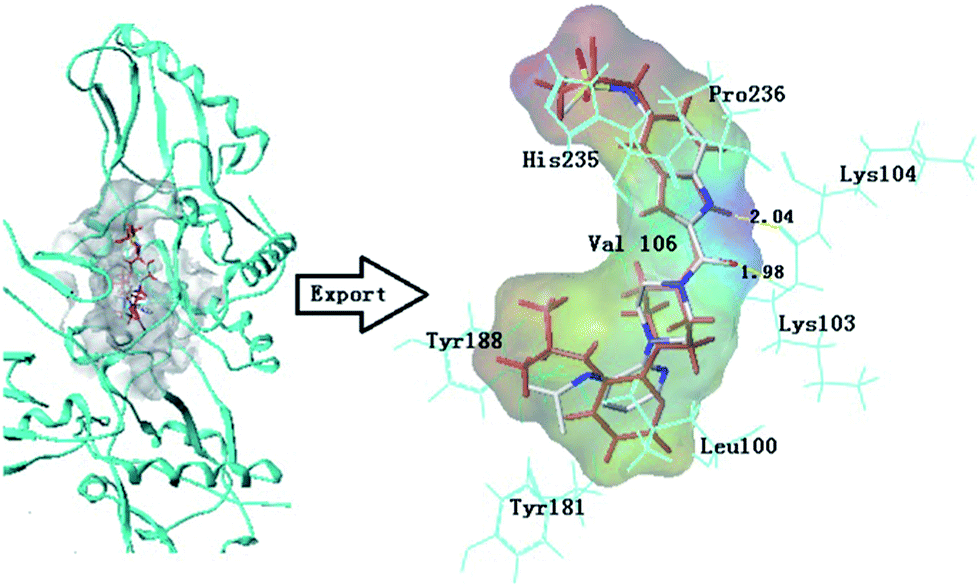 | ||
| Fig. 8 Re-docking result of the bis (heteroaryl) piperazine (BHAP) U-90152 (red color ligand) into the binding site of HIV-1 reverse transcriptase protease and the cognate ligand (Atom type color) from the protein (PDB:1KTS). Hydrogen bonds are shown as yellow lines, with distance unit of Å. The inhibitor and the important residues are shown as stick model. | ||
After validating the docking reliability, Surflex-Dock was used for docking. Herein the compounds were originally reported to be the most potent inhibitors toward HIV-1 and least active compound were selected for more detailed analysis. Fig. 9 shows the interacting mode of compounds 14, 28 and 1 in the binding site of RT receptor. As shown in Fig. 9a, compound 14 was docked into the binding cavity with the carboxyl directing towards the hydrophobic group of Leu100, Lys102, Val106, Val179, Tyr181, Tyr188, Val189, Gly190, Phe227, Leu234, His235, Pro236 and Tyr318. One hydrogen bond was formed between the pyrimidine ring and the Lys101 residue. The hydrogen bond distances observed are 2.26 Å (Lys101–HN–H⋯O–), 1.78 Å (Lys101–O⋯H–NH–), respectively. Robert et al. revealed that hydrogen bonding to the main chain of Lys-103 and strong hydrophobic interactions are particularly important for any successful inhibitors. But many NNIs, including HEPT and TIBO analogues,45 also forming a hydrogen bond to the carbonyl oxygen of Lys101. The Glu138 and Lys103 residues interact with 14 by electrostatic interaction. The presence of these interactions affect the nearby protein structure.
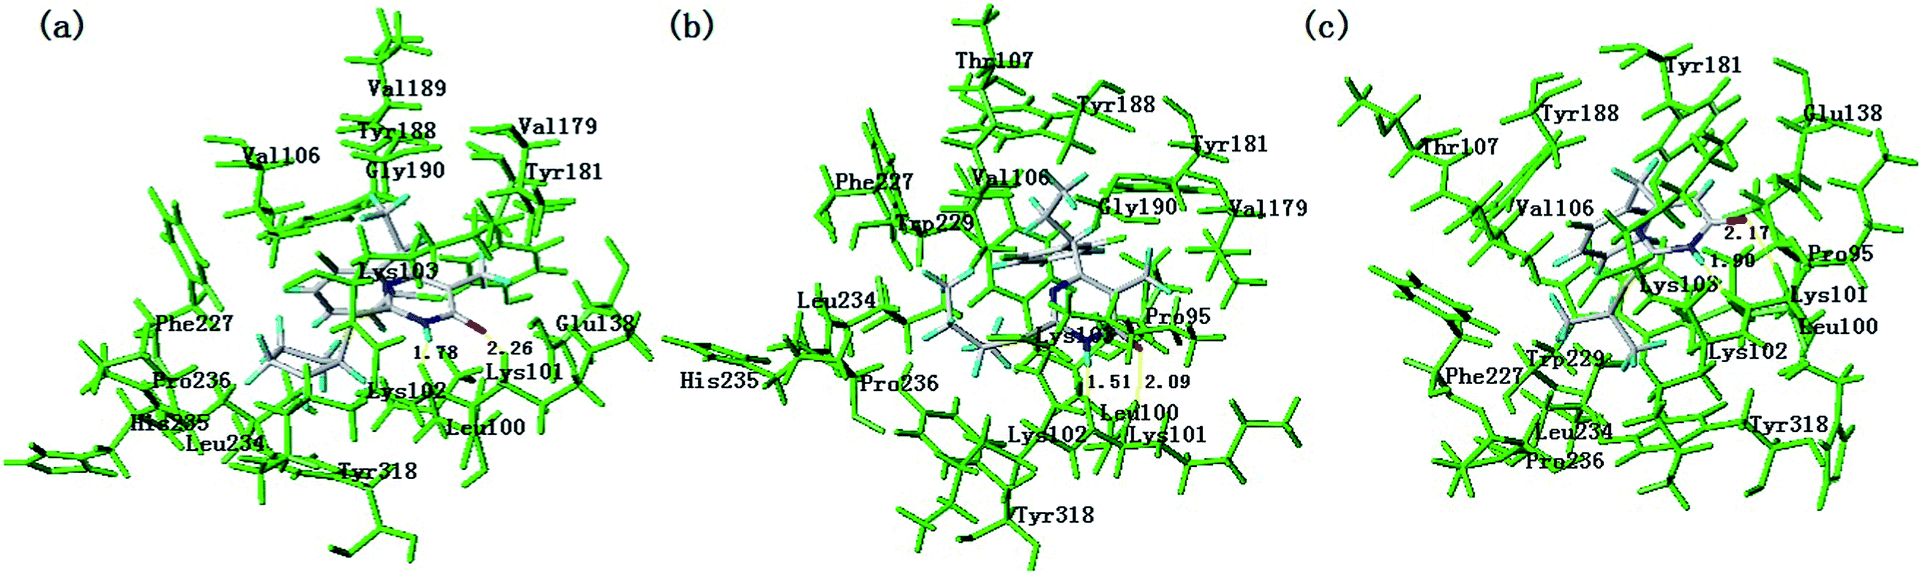 | ||
| Fig. 9 Docking result of the compound 14 (a), 28 (b) and 1 (c) into the binding site of HIV-1 reverse transcriptase protease. Hydrogen bonds are shown as yellow lines, with distance unit of Å. The inhibitor and the important residues are shown as stick model. | ||
As shown in Fig. 9b, compound 28 was docked into the binding cavity with the carboxyl directing towards the hydrophobic group of Pro95, Leu100, Val106, Thr107, Val179, Tyr181, Tyr188, Gly190, Phe227, Trp229, Leu234, His235, Pro236 and Tyr318. One hydrogen bond was formed between the pyrimidine ring and the Lys101 residue. The distances observed are 1.51 Å (Lys101–HN–H⋯O–), 2.09 Å (Lys101–O⋯H–NH–), respectively. The residues Lys102 and Lys103 interact with 28 by electrostatic interaction. Fig. 9c depicts the interactions between the compound 1 and the active site. The ligand was anchored into the binding site via one hydrogen bond to the key residues of Lys101. The distances observed are 2.17 Å (Lys101–HN–H⋯O–), 1.90 Å (Lys101–O⋯H–NH–), respectively. Moreover, the compound was stabilized by the hydrophobic interactions offered by Leu100, Pro95, Val106, Lys102, Val179, Tyr181, Tyr188, Trp229, Leu234, Phe227 and Tyr318. Compared with the compounds 14 and 28, the number of hydrophobic group around compound 1 obviously decreased. The key residues Pro236 and His235 can not be found in the binding pocket, simultaneously.
3. Conclusion
In the present work, a series of DABOs derivatives as Non-nucleoside inhibitors were studied by computer-aided drug design processes, such as 3D-QSAR/Topomer CoMFA studies and molecular docking simulations. The built models are favored by internal and external predictions and the stastics are convincing and comparable. The models can not only be extrapolated to predict novel and more potent inhibitors, but the contour maps obtained from CoMFA, CoMSIA and Topomer CoMFA analyses provid a useful insight for structure-based design for designing new chemical entities with high HIV-1 inhibitory activity. For a better understanding of the binding modes of inhibitors at the active site of HIV-1 protein, molecular docking analyses of the representative compounds were performed. Some key residues such as Leu100, Lys102, Val106, Tyr181, Tyr188, His235, Pro236 hydrophobic interactions, as well as hydrogen bonds (Lys101, Lys103) between inhibitors and the active site were observed. The inhibitors interact with the main residues (Lys101 and 103), which may generate binding affinity that is less susceptible to point mutations. This study could serve as a basis for the development of HIV-1 inhibitors.Acknowledgements
This work is supported by the Science and Technology Commission of Shanghai Municipality (no. 13142201001, 13DZ1930402, 13DZ1930403).Notes and references
- Y. Xu, H. Liu, C. Y. Niu, C. Luo, X. M. Luo, J. H. Shen, K. X. Chen and H. L. Jiang, Bioorg. Med. Chem., 2004, 12, 6193–6208 CrossRef CAS PubMed.
- R. Joseph, B. Florent, T. Catia and M. Francois, J. Comput.–Aided Mol. Des., 2008, 22, 831–841 CrossRef PubMed.
- http://www.unaids.org, accessed 3 February 2012.
- M. E. S. Soliman, Drug Dev. Res., 2013, 74, 283–295 CrossRef CAS.
- B. C. Johnson, G. T. Pauly, G. Rai, D. Patel, J. D. Bauman, H. L. Baker, K. Das, J. P. Schneider, D. J. Maloney and E. Arnold, et al., Retrovirology, 2012, 9, 1–23 CrossRef PubMed.
- H. Abedi, H. Ebrahimzadeh and J. B. Ghasemi, Struct. Chem., 2013, 24, 433–444, DOI:10.1007/s11224-012-0092-16.
- http://www.who.int/hiv/mediacentre/news64/, Accessed 3 February 2012.
- R. C. Gallo and L. Montagnier, Science, 2002, 298, 1730–1731 CrossRef CAS PubMed.
- R. M. Esnouf, J. Ren, A. L. Hopkins, C. K. Ross, E. Y. Jones, D. K. Stammers and D. I. Stuart, Proc. Natl. Acad. Sci. U. S. A., 1997, 94, 3984–3989 CrossRef CAS.
- R. C. Gallo and L. Montagnier, N. Engl. J. Med., 2003, 349, 2283–2285 CrossRef CAS PubMed.
- R. C. Gallo, Science, 2002, 298, 1728–1730 CrossRef CAS PubMed.
- C. Reynolds, C. B. de Koning, S. C. Pelly, W. A. L. van Otterlo and M. L. Bode, Chem. Soc. Rev., 2012, 41, 4657–4670 RSC.
- R. C. Gallo, Retrovirology, 2006, 3, 72–78 CrossRef PubMed.
- M. Ndour, P. S. Sow, A. M. Coll-Seck, S. Badiane, C. T. Ndour, N. Diakhate, B. Diop, M. Faye, M. Soumaré, G. Diouf and R. Colebunders, Trop. Med. Int. Health, 2000, 5, 687–691 CrossRef CAS.
- L. A. Kohlstaedt, J. Wang, J. M. Friedman, P. A. Rice and T. A. Steitz, Science, 1992, 256, 1783–1790 CAS.
- V. J. Merluzzi, K. D. Hargrave, M. Labadia, K. Grozinger, M. Skoog, J. C. Wu, C.-K. Shih, K. Eckner, S. Hattox, J. Adams, A. S. Rosenthal, R. Faanes, R. J. Eckner and R. A. Koup, et al., Science, 1990, 250, 1411–1413 CAS.
- R. Pauwels, K. Andries and J. Desmyter, et al., Nature, 1990, 343, 470–474 CrossRef CAS PubMed.
- A. S. Cantrell, P. Engelhardt and M. Hogberg, et al., J. Med. Chem., 1996, 39, 4261–4274 CrossRef CAS PubMed.
- A. L. Hopkins, J. Ren and R. M. Esnouf, et al., J. Med. Chem., 1996, 39, 1589–1600 CrossRef CAS PubMed.
- T. J. Dueweke, S. M. Poppe and D. L. Romero, et al., Antimicrob. Agents Chemother., 1993, 37, 1127–1131 CrossRef CAS.
- M. Baba, H. Tanaka and E. De Clercq, et al., Biochem. Biophys. Res. Commun., 1989, 165, 1375–1381 CrossRef CAS.
- M.-P. de Béthune, Antiviral Res., 2010, 85, 75–90 CrossRef PubMed.
- D. D. Richman, M. A. Fischi and M. H. Grieco, et al., N. Engl. J. Med., 1987, 317, 192–197 CrossRef CAS PubMed.
- D. D. Richman, Antimicrob. Agents Chemother., 1993, 37, 1207–1221 CrossRef CAS.
- T. Terasaki and W. M. Pardridge, J. Infect. Dis., 1988, 158, 630–632 CrossRef CAS PubMed.
- M. Vijay, K. Khedkar Premlata and S. A. J. V. Mushtaque, et al., J. Mol. Model., 2010, 16, 1251–1268 CrossRef PubMed.
- M. Artico, Drugs Future, 2002, 27, 159–175 CrossRef CAS.
- S. Yang, F. E. Chen and E. De Clercq, Curr. Med. Chem., 2012, 19, 152–162 CrossRef CAS.
- I. A. Novakov, M. Artico and A. Mai, et al., Russ. Chem. Bull., 2012, 61, 1399–1418 CrossRef CAS PubMed.
- D. Jayaweera and P. Dilanchian, Expert Opin. Pharmacother., 2012, 13, 2601–2612 CrossRef CAS PubMed.
- I. Usach, V. Melis and J. E. Peris, J. Int. AIDS Soc., 2013, 16, 1–14 Search PubMed.
- M. Botta, M. Artico and S. Massa, et al., Eur. J. Med. Chem., 1992, 27, 251–257 CrossRef CAS.
- M. Artico, S. Massa and A. Mai, et al., Antiviral Chem. Chemother., 1993, 4, 361–368 CAS.
- S. Massa, A. Mai and M. Artico, et al., Antiviral Chem. Chemother., 1995, 6, 1–8 CAS.
- H. Van de Waterbeemd, Chemometric Methods in Drug Design, VCH, Weinheim, 1995, ch. 1 Search PubMed.
- R. D. Cramer, D. E. Patterson and J. D. Bunce, J. Am. Chem. Soc., 1988, 110, 5959–5967 CrossRef CAS PubMed.
- G. Klebe, U. Abraham and T. Mietzner, J. Med. Chem., 1994, 37, 4130–4146 CrossRef CAS.
- H. Sharma, S. Patil, T. W. Sanchez, N. Neamati, R. F. Schinazi and J. K. Buolamwini, Bioorg. Med. Chem., 2011, 6, 2030–2045 CrossRef PubMed.
- H. Abedi, H. Ebrahimzadeh and J. B. Ghasemi, Struct. Chem., 2013, 2, 433–444 CrossRef PubMed.
- D. Rotili, D. Tarantino and M. B. Nawrozkij, et al., J. Med. Chem., 2014, 57, 5212–5225 CrossRef CAS PubMed.
- R. D. Cramer III, R. D. Clark, D. E. Patterson and A. M. Ferguson, J. Med. Chem., 1996, 39, 3060–3069 CrossRef PubMed.
- L. Ståhle and S. Wold, J. Chemom., 1987, 1, 185 CrossRef.
- S. Wold, C. Albano and W. J. Dunn, et al., Chemometrics, 1984, 138, 17 CAS.
- P. P. Roy, J. T. Leonard and K. Roy, Chemom. Intell. Lab. Syst., 2008, 90, 31–42 CrossRef CAS PubMed.
- R. M. Esnouf, J. Ren, A. L. Hopkins and C. K. Ross, et al., Proc. Natl. Acad. Sci. U. S. A., 1997, 94, 3984–3989 CrossRef CAS.
| This journal is © The Royal Society of Chemistry 2015 |