3D hierarchical honeycomb structured MWCNTs coupled with CoMnAl–LDO: fabrication and application for ultrafast catalytic degradation of bisphenol A†
Wen Lia,
Pingxiao Wu*abc,
Shanshan Yanga,
Yajie Zhua,
Chunxi Kanga,
Ly Tuong Trana and
Beilei Zenga
aCollege of Environment and Energy, South China University of Technology, Guangzhou 510006, P.R. China. E-mail: pppxwu@scut.edu.cn
bThe Key Lab of Pollution Control and Ecosystem Restoration in Industry Clusters, Ministry of Education, Guangzhou 510006, P.R. China
cThe Key Laboratory, of Environmental Protection and Eco-Remediation of Guangdong Regular Higher Education Institutions, P.R. China
First published on 24th December 2014
Abstract
3D hierarchical honeycomb nano-structured o-MWCNTs coupled with CoMnAl-layer double oxides have been successfully fabricated and characterized as a heterogeneous catalyst for bisphenol A (BPA) degradation using potassium monopersulfate (PMS) as oxidant. The role of MWCNTs was investigated and discussed in terms of surface morphology, structure, composition and catalytic activity of the as-prepared nanohybrid by investigation of SEM, TEM, XRD, XPS, and Raman measurements, etc. The results showed that catalytic performance of the CNTs–LDO can be significantly enhanced with the increase of o-MWCNTs content in the hybrids, and MWCNTs provided orientation/confinement for nanohybrid formation and the defects generated by calcination might increase PMS activation for the production of sulfate radicals.
1 Introduction
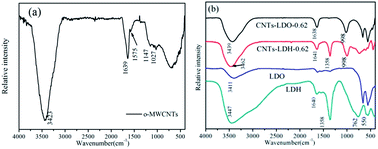
Carbon nanomaterials, including carbon nanotubes (CNTs), graphene and fullerene, are a kind of novel nanomaterials with a monolayer of carbon atoms arranged in a honeycomb lattice. The fascinating properties of the carbon nanomaterials, such as unique electronic properties, large surface area, high chemical and thermal stability, and excellent mechanical flexibility have been well documented.1 Very recently, carbon nanomaterials have been attracting enormous interest among researchers in the application of catalytic degradation of pollutants.2–4 Previous studies5 in our laboratory found that a trace level of reduced graphene oxide was able to significantly facilitate the degradation of cationic dye methylene blue and anionic dye orange G in aqueous solutions, and both the sp2-hybridized carbon and zigzag carbons played important roles in the photocatalysis process. It also showed that carbon nanomaterials or functional carbon nanomaterials can promote decomposition of oxidants (e.g., H2O2, PMS, PDS) into radicals, thereby enhancing the oxidation of organic compounds in liquids.6–9To improve the hydrophilicity and catalytic activity of the carbon nanomaterials, an array of surface functional groups, such as hydroxyl, carboxyl, and amino groups are often introduced to functionalize these materials. Owing to case of acidity or basicity possessed by that many of these surface functional groups, carbon nanomaterials exerted potential in degradation of organic contaminants by acid-catalyzed and base-catalyzed in the nucleophilic and hydrolytic reactions.10 In addition, defects which formed inevitably during the modification or functionalization can increase the proportion of adsorbed oxygen species onto the surface lattice oxygen ones and thus improve the catalytic activity.11,12 What's more, the oxygen functional surface species, such as ketonic (C![[double bond, length as m-dash]](https://www.rsc.org/images/entities/char_e001.gif) O) group, are rich in electrons and thus have great potential to coordinate a redox process.13 Based on the abovementioned analysis, sp2-hybridized carbon, surface acidity/basicity, lattice defects and oxygen-containing functional groups are deemed to be the origins of the catalytic activity.
O) group, are rich in electrons and thus have great potential to coordinate a redox process.13 Based on the abovementioned analysis, sp2-hybridized carbon, surface acidity/basicity, lattice defects and oxygen-containing functional groups are deemed to be the origins of the catalytic activity.
The construction of hierarchical structures by arranging carbon nanomaterials and metal oxide nanoparticles with nanometer-scale precision exhibits a superior prospect in the application of nanotechnology.14 Therefore, it inspired us to prepare a novel kind of composite materials with morphology, structure, composition and properties which are different from those of the simple sum of the individual parts. Particularly, the combination of metal oxides and carbon nanomaterials endows the composites with the unique properties of each component or even with a synergistic effect when apply them in the heterogeneous catalysis. For example, the CNTs network was found to be effective in facilitating the dispersion of the oxide nanoparticles and providing exposure of more active sites outside because of their large surface areas and interaction between the functional groups and meta ions.5,15 Moreover, surface sites may be classified as the delocalized π electrons on the graphene layers (C–π), which provide continuous conducting pathways for the electrons transportation and thus accelerate the reactions.5,15 Besides, the morphology, structure and composition of metal oxides could be affected by the introduction of CNTs; e.g., Song16 prepared VO2 supported on multi-walled carbon nanotube (MWCNTs) by the spontaneous redox between V5+ and the defects of MWCNTs, the resulting catalysts had a better catalytic performance than V2O5 loaded directly on MWCNTs; Dang17 synthesized crystalline hollow manganese oxide nanotubes with highly porous walls using CNTs as templates and they found that this kind of material exhibited excellent catalytic performances on the degradation of organic dye. Consequently, it seems necessary to study of the interaction between CNTs and metal oxides and the application of the hybrid materials.
In view of those abovementioned reasons, composites of CNTs with catalytic metal oxides or metal hydroxides have been the subject of many studies.18–20 Among various metal elements, the group VII metals, especially the iron-group-metal Fe, Mn and Co, exhibite promising catalysis activity in heterogeneous reactions.21–23 The iron-group-metal-based catalysts have attracted enormous interests as low-cost alternatives to noble-metal catalysts. Layered double hydroxides (LDHs) are a family of common inorganic materials and are easily synthesized in the laboratory. A key structural characteristic of LDHs is that the MII and MIII cations distributed in a uniform manner in the hydroxide layers.24 Therefore, it can be used as precursor or template for fabricating catalyst with specific/morphology/surface structure and high dispersion by lattice orientation/lattice confinement of LDHs.25
In this study, we describe an approach of fabricating MWCNTs coupled with layers of CoMnAl mixture metal oxides with 3D hierarchical honeycomb nano-structure and investigate its catalytic performance in potassium monopersulfate (PMS) oxidation of bisphenol A (BPA). Particular attention was paid to the changes of morphology, structure and composition of the hybrids in the absence and presence of MWCNTs. The stability and recycle of the catalysts, as well as the catalysis mechanism were also studied.
2 Materials and methods
2.1 Synthesis of catalysts
Commercial MWCNTs were purchased form Nanjing XFNANO Materials Tech Co., Ltd, China. The MWCNTs have a outer diameter of <8 nm and inner diameter of 2–5 nm, a length of 0.5–2 μm, and a purity of >95% by weight. Pristine MWCNTs were treated with a mixture of nitric acid and sulfuric acid (in a volume ration of 1![[thin space (1/6-em)]](https://www.rsc.org/images/entities/char_2009.gif) :
:![[thin space (1/6-em)]](https://www.rsc.org/images/entities/char_2009.gif) 3) aqueous solution by refluxing in a round-bottom flask at 100 °C for 4 h, and then filtered and washed with distilled water to neutrality. Finally, the collected power was dried at 80 °C for 12 h in an oven to obtain the modified MWCNTs that are denoted as o-MWCNTs.
3) aqueous solution by refluxing in a round-bottom flask at 100 °C for 4 h, and then filtered and washed with distilled water to neutrality. Finally, the collected power was dried at 80 °C for 12 h in an oven to obtain the modified MWCNTs that are denoted as o-MWCNTs.
CNT–LDH nanohybrids were fabricated via a homogeneous urea precipitation method. For a typical run, a certain amount of Co(NO3)2·6H2O, Mn(NO3)2, Al(NO3)2·9H2O (the metal ion molar ration is 4![[thin space (1/6-em)]](https://www.rsc.org/images/entities/char_2009.gif) :
:![[thin space (1/6-em)]](https://www.rsc.org/images/entities/char_2009.gif) 1
1![[thin space (1/6-em)]](https://www.rsc.org/images/entities/char_2009.gif) :
:![[thin space (1/6-em)]](https://www.rsc.org/images/entities/char_2009.gif) 1) and urea were dissolved in 500 mL of distilled water to obtain the mixed solution by ultrasonication for 10 min. Then, 50 mg of o-MWCNTs were dispersed in the above mixed solutions and ultrasonicated for 4 h. According to the total metal contents added into the mixed solution, the nanohybrids were denoted as CNTs–LDH-X, where X represented the mass ratio of CNTs to LDH. In this work, four samples with different ratios (CNTs–LDH-0.06, CNTs–LDH-0.31, CNTs–LDH-0.62 and CNTs–LDH-1.23) were prepared for investigating the effect of CNTs on the catalytic activity. The mixture was transferred into a three-necked round-bottom flask after standing and adsorption for overnight. Subsequently, the mixed solution was refluxed for 48 h. After filtering and washing with distilled water several times, the resulting precipitant was dried at 60 °C in vacuum overnight, yielding the final CNTs–LDH nanohybrids. The dried products were calcined for 5 h at 400 °C and denoted as CNTs–LDO-0.06, CNTs–LDO-0.31, CNTs–LDO-0.62 and CNTs–LDO-1.23, respectively. For comparison, the pristine LDO was prepared under the same conditions except for the addition of o-MWCNTs.
1) and urea were dissolved in 500 mL of distilled water to obtain the mixed solution by ultrasonication for 10 min. Then, 50 mg of o-MWCNTs were dispersed in the above mixed solutions and ultrasonicated for 4 h. According to the total metal contents added into the mixed solution, the nanohybrids were denoted as CNTs–LDH-X, where X represented the mass ratio of CNTs to LDH. In this work, four samples with different ratios (CNTs–LDH-0.06, CNTs–LDH-0.31, CNTs–LDH-0.62 and CNTs–LDH-1.23) were prepared for investigating the effect of CNTs on the catalytic activity. The mixture was transferred into a three-necked round-bottom flask after standing and adsorption for overnight. Subsequently, the mixed solution was refluxed for 48 h. After filtering and washing with distilled water several times, the resulting precipitant was dried at 60 °C in vacuum overnight, yielding the final CNTs–LDH nanohybrids. The dried products were calcined for 5 h at 400 °C and denoted as CNTs–LDO-0.06, CNTs–LDO-0.31, CNTs–LDO-0.62 and CNTs–LDO-1.23, respectively. For comparison, the pristine LDO was prepared under the same conditions except for the addition of o-MWCNTs.
2.2 Characterization
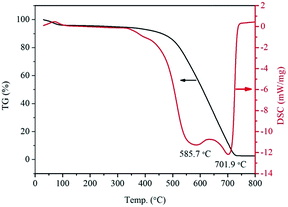
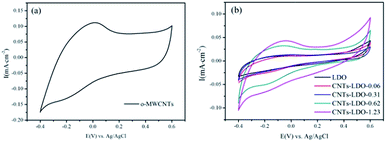
Thermogravimetry-differential scanning calorimetry (TG-DSC) date were obtained by using a thermal analysis meter (STA-449F3, Netasch, Germany) under air environment with a heating rate of 10 °C min−1. The external surface microstructure of the samples' external surface was observed by a ZEISS Merlin Scanning electron microscopy (SEM, Carl Zeiss, Germany) and a high resolution transmission electron microscopy (TEM, JEM-3010, JEOL Ltd., Japan) with an accelerating voltage of 200 kV. The X-ray diffraction (XRD) patterns were measured by a X-ray diffractometer equipped (D/MAX-IIIA, Rigaku Ltd., Japan) with Cu Kα radiation. The particle surface area and pore size measurement were carried out by N2 adsorption/desorption isotherm analysis with a Chemi-sorption Surface Area Analyzer (ASAP 2010, Micrometritics, America). The X-ray photoelectron spectra (XPS) were measured with an X-ray photoelectron spectrometer (AES430S, ANELVA, Japan) and the binding energy of C 1S was shifted to 284.6 eV as an internal reference.Cyclic voltammetry (CV) tests were performed at 25 °C in a three-electrode cell connected to a AUTOLAB PGSTAT302N workstation (AUT83939, ECO CHEMIE BV, Netherlands). The working electrode was a glassy carbon disk (GC) with an area of 0.071 cm2 and coated with catalysts to form the catalysts layer. Ag/AgCl and a platinum foil served as reference and counter electrodes, respectively. The catalysts ink for GC was prepared by blending 2 mg catalyst, 2 mL ethanol and 10 μL nafion emulsion, which was ultrasonically dispersed for 10 min to form suspension. Then, 10 μL of this suspension was deposited onto the surface GC pipette, and then dried at room temperature. Electrochemical experiments were carried out in O2-saturated B–R buffer solution with pH = 3 at room temperature. CVs were initially collected by scanning the disk potential from −0.4 V to 0.6 V at a scan rate of 10 mV s−1 to measure the surface behavior of the catalysts.
2.3 Catalytic activity test
The degradation of BPA was carried out at 25 °C in a 1 L glass vessel with 500 mL of BPA solution at 10–40 mg L−1 with a constant stirring. The reactor was attached to a stand and dipped into a water bath. First, 0.01 g catalysts was added into the BPA solution for a while, then the PMS (2KHSO5·KHSO4·K2SO4, Aladdin) was added into the solution at 0.15 g L−1. It must be noted that PMS addition in unbuffered water would lead to a significant decrease in the pH. Therefore, phosphate buffer solution was used to maintain the neutral condition (pH = 7.0) of the solution. At predetermined time internals, the samples (1 mL) were withdrawn by syringe and filtered by 0.45 μm PES (polyethersulfone) membranes. The BPA concentrations in filtered solutions were then quantified by high performance liquid chromatography (HPLC, Hitachi, L-2000) with an HP UV detector at 276 nm. A Synergi 4u Polar-RP 80 column (diameter, 250 × 4.60 mm) and a guard column (diameter, 4.6 × 12 mm) were used. Mobile phase was consisted of water and acetonitrile (50![[thin space (1/6-em)]](https://www.rsc.org/images/entities/char_2009.gif) :
:![[thin space (1/6-em)]](https://www.rsc.org/images/entities/char_2009.gif) 50) at 1.0 mL min−1.
50) at 1.0 mL min−1.
To evaluate the stability of the catalysts, the leaching amounts of cobalt and manganese after reaction were measured by zeeman atomic absorption spectrometry (AAS, Z-2000, Hitachi).
For the recycle tests, the catalysts were recovered by filtration, thoroughly washed with distilled water for several times, then dried at 60 °C overnight after each run. The catalyst losses were observed during the recycle processes. Therefore, several parallel reactions were conducted in the first and second runs to ensure a sufficient amount of catalysts for the next run.
3 Results
3.1 Catalyst characterization
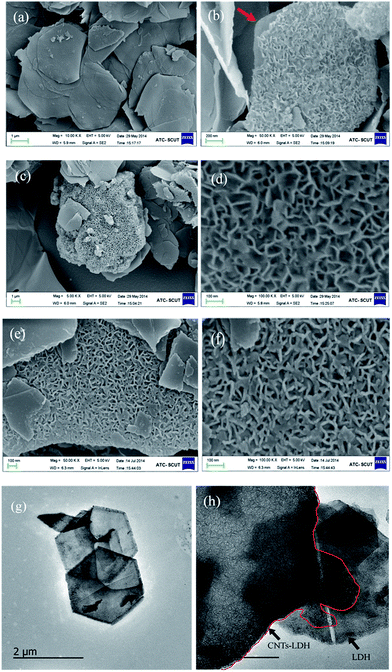 | ||
| Fig. 2 SEM images of (a) LDH, (b) CNTs–LDH-0.62, (c) and (d) CNTs–LDH-1.23, (e) and (f) CNTs–LDO-1.23 and TEM images of (g) LDH and (h) CNTs–LDH-0.62. | ||
The chemical composition of the catalysts were analyzed using an energy dispersive spectrometer (EDS). The EDS results (Fig. S2†) show that the C concentration in the catalysts increased after adding o-MWCNTs. The carbon element also was detected in LDH and LDO, which suggests the CoMnAl–LDH is referred to CO3–LDH.
The concentration of metal ions in liquids before and after adding o-MWCNTs were detected by AAS respectively and the results are listed in Table S1.† The concentration of metal ions slightly decreased after adsorption due to small amounts of functional groups on the surface of MWCNTs. A possible formation and growth protocol is schematically shown in Scheme 1. A conventional acid treatment of CNTs introduced functional groups, e.g., hydroxyl and carbonyl groups (Scheme 1: step I), which served as bonding sites for the adsorption of metal ions by electrostatic forces (Scheme 1: step II). These anchored metal ions acted as nucleation centers for the deposition of CoMnAl–LDH through a facile in situ growth method (Scheme 1: step III). Then CoMnAl–LDH nanosheets with the thickness of ≈8 nm grew along with the skeleton of CNTs, leading to an open and porous structure (Scheme 1: step III). The resulting single CNTs–LDH as interconnected sheet-like subunits was to form a honeycomb structure. Therefore, the agglomerated o-MWCNTs provided an orientation/confinement for LDH nanosheets formation. At the same time, a large amount of metal ions in the solution deposited to form larger LDH sheets substrate (Scheme 1: step IV).
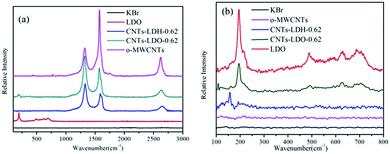
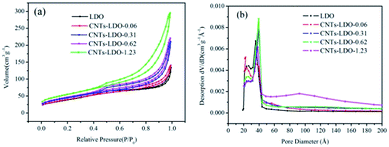
| Samples | d003 (Å) | ID/IG | Samples | ID/IG | SBET (m2 g−1) | VPa (m2 g−1) | DP |
|---|---|---|---|---|---|---|---|
| a The total pore volume was evaluated for a P/P0 ration of 0.97. | |||||||
| o-MWCNTs | — | 0.43 | o-MWCNTs | — | 432.96 | 0.45 | 4.37 |
| LDH | 7.63 | — | LDO | — | 141.13 | 0.15 | 5.71 |
| CNTs–LDH-0.06 | 7.59 | 1.07 | CNTs–LDO-0.06 | — | 146.87 | 0.17 | 5.88 |
| CNTs–LDH-0.31 | 7.62 | 1.43 | CNTs–LDO-0.31 | 1.71 | 162.09 | 0.24 | 7.91 |
| CNTs–LDH-0.62 | 7.65 | 1.57 | CNTs–LDO-0.62 | 1.83 | 173.95 | 0.26 | 7.72 |
| CNTs–LDH-1.23 | 7.71 | 1.41 | CNTs–LDO-1.23 | 0.68 | 206.48 | 0.37 | 8.50 |
 | (1) |
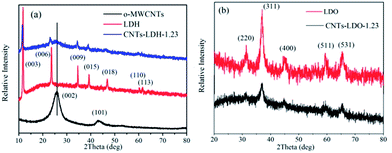
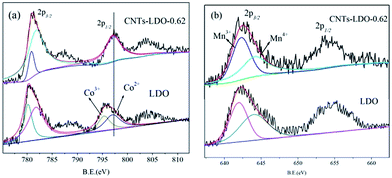
High spin state of Mn(III) (d4) was susceptible to Jahn–Teller distortion, which could further lead to the lattice instability in the LDH.32 Therefore, Mn(III) should be oxidized to Mn(IV) to overcome the lattice instability. According to the previous studies,33,36,37 both the Mn(III) and Mn(IV) could exist in the catalysts. This hypothesis can be proved by XPS spectra of Mn 2p3/2, in which the broad peaks of Mn 2p3/2 can be deconvolved into two peaks: the peak at 641.9–642.0 eV is assigned to Mn(III) ions and that at 643.8–644.0 eV is assigned to Mn(IV) ions.38 However, the ratio of Mn(III)/Mn(IV), which reflects the “oxygen mobility ” in the lattice, is different in the absence and presence of CNTs, e.g., the ratio is about 0.68 and 1.14 in LDO surface and CNTs–LDO surface, respectively.
3.2. Catalytic oxidation of bisphenol A
Fig. 9(a) shows the preliminary tests of adsorption of BPA by o-MWCNTs, LDO and CNTs–LDO. It is found that the o-MWCNTs exhibits the highest adsorption capacity for BPA compared with that on LDO and CNTs–LDO. Moreover, the adsorption capacity of BPA decreases with the increasing amount of LDO. It is suggested that loading LDO on CNTs reduced the surface area and pore volume of o-MWCNTs (as shown in Table 1). The desorption of BPA occurs in all adsorption tests after 15 min, indicating that the adsorption of BPA is very weak. The degradation tests of BPA by different catalysts are shown in Fig. 9(b), it can be clearly seen that the BPA degradation only with PMS is relatively weak, which can be explained by the reason that the hot activation of PMS leads to the production of sulfate radicals under the neutral condition. Nevertheless, the degradation of BPA presents a gradual increase when adding PMS and o-MWNCTs simultaneously, and the degradation of BPA was higher than that of o-MWCNTs adsorption. It is suggested that o-MWCNTs could possibly activate PMS to produce sulfate radicals, and the reaction is shown as eqn (2) below.| CNT–C=O + S2O82− → CNT–C–O+ + SO4−˙ + SO42− | (2) |
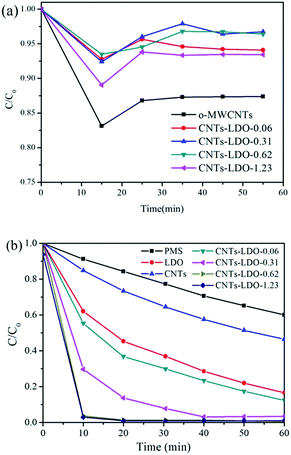 | ||
| Fig. 9 BPA adsorption (a) and degradation (b) on different samples. Reaction conditions: [BPA]0 = 20 mg L−1, sample dosage = 0.02 g L−1, T = 25 °C (a), and PMS dosage = 0.15 g L−1 (b). | ||
For LDO/PMS system, 100% BPA degradation could be achieved after 80 min. The activation of PMS by LDO could be presented by eqn (3)–(6).
| Mn3+ + HSO5− → Mn4+ + SO4−˙ + H+ | (3) |
| Co2+ + HSO5− → Co3+ + SO4−˙ + OH− | (4) |
| Mn4+ + HSO5− → Mn3+ + SO5−˙ + H+ | (5) |
| Co3+ + HSO5− → Co2+ + SO5−˙ + H+ | (6) |
Note that the catalytic performance in BPA oxidation was significantly improved with the addition of CNTs–LDO nanohybrids. Moreover, the degradation efficiency increased with the increase of CNTs contents. Typically, 20 mg L−1 of BPA was completely degraded within 10 min by 0.02 g L−1 of CNTs–LDO-0.62 and 0.15 g L−1 of PMS.
The BPA degradation in the presence of LDO or CNTs–LDO was correlated with the TOC removals as shown in Fig. S5.† About 25% and 45% of TOC was removed after 80 min in LDO/PMS system and CNTs–LDO-0.62/PMS system, respectively. It indicates that the introduction of CNTs into the catalysts is in favor of the BPA degradation and the removal of TOC.
3.3 Stability of CNTs–LDO in multiple runs
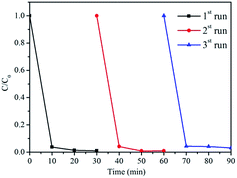
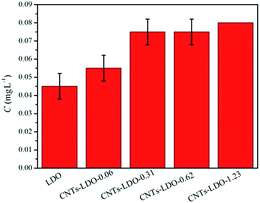
The recycling ability of CNTs–LDO-0.62 nanohybrid was determined by adding recycled catalyst from previous runs into fresh BPA solutions for degradation under the same reaction conditions, as shown in Fig. 10. The activity of catalyst has not changed in the three cycles. The concentration of dissolved Co and Mn ions from LDO was measured by AAS. The Mn leached from all samples was <0.005 mg L−1, which was below the detection limit. As shown in Fig. 11, trace amounts of leaching Co were detected and increased with the increase of CNTs contents, which indicates the stability of catalysts reduced after adding CNTs.3.4 Role of MWCNTs in CNTs–LDO nanohybrids in catalytic activation of PMS
In this work, the transformation of morphology, structure and composition of the mixture metal oxides was observed in the presence of MWCNTs. For example, the morphology of mixed metal oxides was transformed from stacked 2D hexagonal plate to 3D hierarchical honeycomb because of the orientation/confinement of MWCNTs; the particle size decreased and the surface area increased with the addition of MWCNTs; the transition metal was hard to oxidize during calcination which might be due to the reduction of MWCNTs.In previous study, Anipsitakis et al.51 studied the heterogenous activation of PMS by using cobalt oxides, CoO and Co3O4, and found that only Co3O4 activated PMS heterogeneously. Therefore, in this work, Co existed in CNTs–LDO at +2 valence state is not the reason of much higher catalytic activity. In terms of the morphology and structure of the nanohybrids, the CNTs–LDH was fabricated with a 3D hierarchical honeycomb structure, which greatly reduced the aggregation of LDH platelets and MWCNTs and thus leading to the exposure of more surface and activity sites. Besides, the oxidized and lost part of the carbon nanotubes occurred during the calcination, could lead to the lower crystalline order of graphite phase and higher MWCNTs defect densities according to the Raman analysis. Song et al.12 reported that MWCNTs with different defect densities had been used directly as catalyst for the activation of H2O2. The results showed that the performance of the catalyst was improved with the increasing defect densities of MWCNTs, and active oxygen was generated by H2O2 decomposition on the defect of MWCNTs with dangling incomplete bonding. Therefore, MWCNTs defects generated by calcination might increase PMS activation for the production of sulfate radicals in this work.
4 Conclusion
In conclusion, the results obtained herein provide clear evidence that the CNTs–LDH and CNTs–LDO nanohybrids with a 3D hierarchical honeycomb structure are formed by the deposition of CNTs–LDH nanosheets on LDH sheets substrates. The transformations of surface morphology, structure and composition of the as-prepared materials in the presence or absence of MWCNTs are depicted in this work. The catalytic performance of the calcined products can be significantly enhanced with the increase of o-MWCNTs contents in the hybrids. The unique 3D hierarchical honeycomb structure and MWCNTs defects play important roles in the catalytic activation of PMS for BPA degradation. Typically, 20 mg L−1 of BPA was completely degraded by 0.02 g L−1 of CNTs–LDO-0.62 and 0.15 g L−1 of PMS within 10 min. Therefore, the preliminary results confirmed that this new kind of heterogeneous catalysts with a 3D hierarchical honeycomb structure could be applied in the effective BPA degradation.Acknowledgements
The authors are grateful for financial support from the National Science Foundation of China (Grant no. 41472038, 41273122, 41073058).Notes and references
- M. Zhao, Q. Zhang, J. Huang and F. Wei, Adv. Funct. Mater., 2012, 22, 675–694 CrossRef CAS.
- Y. Yao, Z. Yang, H. Sun and S. Wang, Ind. Eng. Chem. Res., 2012, 51, 14958–14965 CrossRef CAS.
- Y. Yao, Y. Cai, F. Lu, F. Wei, X. Wang and S. Wang, J. Hazard. Mater., 2014, 270, 61–70 CrossRef CAS PubMed.
- R. Xu, H. Bi, G. He, J. Zhu and H. Chen, Mater. Res. Bull., 2014, 57, 190–196 CrossRef CAS PubMed.
- Z. Huang, P. Wu, B. Gong, Y. Fang and N. Zhu, J. Mater. Chem. A, 2014, 2, 5534–5540 CAS.
- E. Saputra, S. Muhammad, H. Sun and S. Wang, RSC Adv., 2013, 3, 21905–21910 RSC.
- P. Shi, R. Su, S. Zhu, M. Zhu, D. Li and S. Xu, J. Hazard. Mater., 2012, 229, 331–339 CrossRef PubMed.
- S. Liu, W. Peng, H. Sun and S. Wang, Nanoscale, 2014, 6, 766–771 RSC.
- H. Sun, C. Kwan, A. Suvorova, H. M. Ang, M. O. Tadé and S. Wang, Appl. Catal., B, 2014, 154, 134–141 CrossRef PubMed.
- W. Chen, D. Zhu, S. Zheng and W. Chen, Environ. Sci. Technol., 2014, 48, 3856–3863 CrossRef CAS PubMed.
- S. Jiang and S. Song, Appl. Catal., B, 2013, 140, 1–8 CrossRef PubMed.
- S. Song, H. Yang, R. Rao, H. Liu and A. Zhang, Catal. Commun., 2010, 11, 783–787 CrossRef CAS PubMed.
- W. Peng, S. Liu, H. Sun, Y. Yao, L. Zhi and S. Wang, J. Mater. Chem. A, 2013, 1, 5854–5859 CAS.
- M. Grzelczak, J. Vermant, E. M. Furst and L. M. Liz-Marzán, ACS Nano, 2010, 4, 3591–3605 CrossRef CAS PubMed.
- W. Zhang, B. Xu and L. Jiang, J. Mater. Chem., 2010, 20, 6383–6391 RSC.
- S. Song, S. Jiang, R. Rao, H. Yang and A. Zhang, Appl. Catal., A, 2011, 401, 215–219 CrossRef CAS PubMed.
- T. Dang, A. N. Banerjee, S. W. Joo and B. Min, Ind. Eng. Chem. Res., 2014, 53, 9743–9753 CrossRef CAS.
- S. Jiang and S. Song, Appl. Catal., B, 2013, 140, 1–8 CrossRef PubMed.
- A. Zhao, J. Masa, W. Xia, A. Maljusch, M. Willinger, G. Clavel, K. Xie, R. Schlögl, W. Schuhmann and M. Muhler, J. Am. Chem. Soc., 2014, 136, 7551–7554 CrossRef CAS PubMed.
- X. Zhang, J. Wang, R. Li, Q. Dai, R. Gao, Q. Liu and M. Zhang, Ind. Eng. Chem. Res., 2013, 52, 10152–10159 CrossRef CAS.
- L. Xu and J. Wang, Environ. Sci. Technol., 2012, 46, 10145–10153 CAS.
- E. Saputra, S. Muhammad, H. Sun, H. M. Ang, M. O. Tadé and S. Wang, Environ. Sci. Technol., 2013, 47, 5882–5887 CrossRef CAS PubMed.
- H. Liang, H. Sun, A. Patel, P. Shukla, Z. H. Zhu and S. Wang, Appl. Catal., B, 2012, 127, 330–335 CrossRef CAS PubMed.
- S. He, Z. An, M. Wei, D. G. Evans and X. Duan, Chem. Commun., 2013, 49, 5912–5920 RSC.
- P. J. Sideris, U. G. Nielsen, Z. Gan and C. P. Grey, Science, 2008, 321, 113–117 CrossRef CAS PubMed.
- Q. Liao, J. Sun and L. Gao, Colloids Surf., A, 2009, 345, 95–100 CrossRef CAS PubMed.
- J. Yang, C. Yu, X. Fan, Z. Ling, J. Qiu and Y. Gogotsi, J. Mater. Chem. A, 2013, 1, 1963–1968 CAS.
- W. Yang, Z. Gao, J. Wang, J. Ma, M. Zhang and L. Liu, ACS Appl. Mater. Interfaces, 2013, 5, 5443–5454 CAS.
- A. Garcia-Gallastegui, D. Iruretagoyena, M. Mokhtar, A. M. Asiri, S. N. Basahel, S. A. Al-Thabaiti, A. O. Alyoubi, D. Chadwick and M. S. P. Shaffer, J. Mater. Chem., 2012, 22, 13932–13940 RSC.
- H. Wang, X. Xiang and F. Li, J. Mater. Chem., 2010, 20, 3944–3952 RSC.
- F. Kovanda, T. Rojka, J. Dobešová, V. Machovič, P. Bezdička, L. Obalová, K. Jirátová and T. Grygar, J. Solid State Chem., 2006, 179, 812–823 CrossRef CAS PubMed.
- N. V. Kosova, E. T. Devyatkina and V. V. Kaichev, J. Power Sources, 2007, 174, 735–740 CrossRef CAS PubMed.
- Y. Zhang, Z. Qin, G. Wang, H. Zhu, M. Dong, S. Li, Z. Wu, Z. Li, Z. Wu, J. Zhang, T. Hu, W. Fan and J. Wang, Appl. Catal., B, 2013, 129, 172–181 CrossRef CAS PubMed.
- S. Fritsch, J. Sarrias, A. Rousset and G. U. Kulkarni, Mater. Res. Bull., 1998, 33, 1185–1194 CrossRef CAS.
- F. A. Al Sagheer, M. A. Hasan, L. Pasupulety and M. I. Zaki, J. Mater. Sci. Lett, 1999, 18, 209–211 CrossRef CAS.
- J. Lamonier, A. Boutoundou, C. Gennequin, M. Pérez-Zurita, S. Siffert and A. Aboukais, Catal. Lett, 2007, 118, 165–172 CrossRef CAS PubMed.
- L. Obalová, G. Maniak, K. Karásková, F. Kovanda and A. Kotarba, Catal. Commun., 2011, 12, 1055–1058 CrossRef PubMed.
- H. Li, G. Lu, Q. Dai, Y. Wang, Y. Guo and Y. Guo, Appl. Catal., B, 2011, 102, 475–483 CrossRef CAS PubMed.
- H. Fu, Z. Du, W. Zou, H. Li and C. Zhang, Carbon, 2013, 65, 112–123 CrossRef CAS PubMed.
- J. Zhou, H. Song, L. Ma and X. Chen, RSC Adv., 2011, 1, 782–791 RSC.
- M. Cargnello, M. Grzelczak, B. Rodríguez-González, Z. Syrgiannis, K. Bakhmutsky, V. La Parola, L. M. Liz-Marzán, R. J. Gorte, M. Prato and P. Fornasiero, J. Am. Chem. Soc., 2012, 134, 11760–11766 CrossRef CAS PubMed.
- R. Nie, J. Shi, W. Du, W. Ning, Z. Hou and F. Xiao, J. Mater. Chem. A, 2013, 1, 9037–9045 CAS.
- J. Qu, L. Shi, C. He, F. Gao, B. Li, Q. Zhou, H. Hu, G. Shao, X. Wang and J. Qiu, Carbon, 2014, 66, 485–492 CrossRef CAS PubMed.
- R. Nie, J. Shi, W. Du, W. Ning, Z. Hou and F. Xiao, J. Mater. Chem. A, 2013, 1, 9037–9045 CAS.
- C. Yu, J. Yang, C. Zhao, X. Fan, G. Wang and J. Qiu, Nanoscale, 2014, 6, 3097–3104 RSC.
- J. Zhao, J. Chen, S. Xu, M. Shao, Q. Zhang, F. Wei, J. Ma, M. Wei, D. G. Evans and X. Duan, Adv. Funct. Mater., 2014, 24, 2938–2946 CrossRef CAS.
- Q. Ma, D. Wang, M. Wu, T. Zhao, Y. Yoneyama and N. Tsubaki, Fuel, 2013, 108, 430–438 CrossRef CAS PubMed.
- Q. Yang, P. X. Hou, S. Bai, M. Z. Wang and H. M. Cheng, Chem. Phys. Lett., 2001, 345, 18–24 CrossRef CAS.
- B. Li, J. Qiao, D. Yang, J. Zheng, J. Ma, J. Zhang and H. Wang, Electrochim. Acta, 2009, 54, 5614–5620 CrossRef CAS PubMed.
- K. Jurewicz, K. Babeł, R. Pietrzak, S. Delpeux and H. Wachowska, Carbon, 2006, 44, 2368–2375 CrossRef CAS PubMed.
- G. P. Anipsitakis, E. Stathatos and D. D. Dionysiou, J. Mater. Chem. B, 2005, 109, 13052–13055 CAS.
Footnote |
| † Electronic supplementary information (ESI) available: TEM images of o-MWCNTs and SEM images of CNTs–LDO-0.62. EDS mapping of CNTs–LDO-1.23, LDO, CNTs–LDH-1.23 and LDH. XRD patterns of CNTs–LDH and CNTs–LDO. Raman spectra of (a) CNTs–LDH and (b) CNTs–LDO. TOC removal on different catalytic. The adsorption of Co and Mn during the preparation of samples. See DOI: 10.1039/c4ra15339a |
| This journal is © The Royal Society of Chemistry 2015 |

