Effects of strongly aggregated silica nanoparticles on interfacial behaviour of water bound to lactic acid bacteria

Vladimir M. Gun'ko*a, Vladimir V. Turova, Tetyana V. Krupskaa, Magdalina D. Tsapkob, Jadwiga Skubiszewska-Ziębac, Barbara Charmasc and Roman Lebodac
aChuiko Institute of Surface Chemistry, General Naumov Street 17, 03164 Kiev, Ukraine. E-mail: vlad_gunko@ukr.net; Fax: +380 44 4243567; Tel: +380 44 4229627
bFaculty of Chemistry, Taras Shevchenko University, 01030 Kiev, Ukraine. E-mail: nmrlab2007@ukr.net
cFaculty of Chemistry, Maria Curie-Skłodowska University, 20-031 Lublin, Poland. E-mail: jskubisz@o2.pl

Received 25th November 2014 , Accepted 22nd December 2014

First published on 22nd December 2014


Abstract

The effects of changes in the hydration degree of lactic acid bacteria (LAB), dispersion media composition and interactions with silica TS 100 and silylated silica gel Sipernat 50 were analysed using 1H NMR and DSC methods. Several types of water were found in wetted LAB. There were strongly and weakly bound waters determined from their changes in the Gibbs free energy. Strongly and weakly associated waters were identified by changes in the chemical shifts of the proton resonance for hydroxyls participating in hydrogen bonds. Changes in the characteristics of water bound to LAB depend on the water content, dispersion medium and co-adsorbate types, and the presence of silica. In DSC thermograms, changes in the values of enthalpy for exotherms (upon cooling) and endotherms (upon heating) per gram of bound water were much lower than that for bulk water because of the freezing point depression characteristic for bound water, which, therefore, could not form ice crystallites.

Introduction

Lactic acid bacteria (LAB), as well as yeast cells, used in the food industry can be stored in a freeze-dried state.1 Freeze-drying (lyophilisation) is widely used to preserve thermo-sensitive active ingredients such as proteins or microorganisms.2 Freeze-dried microorganisms contain a small amount of residual intracellular water. The addition of water, sugar solution, milk or other nutrient media to them and increasing the temperature to an optimal one lead to renewal of bacterial activity.3 The activity of water (or nutrient media) in the mentioned processes depends on the amounts of water because at low content of bound (structured) water, the solubility of nutrients (as well as other compounds) in this water is low.4,5 The stronger the bonding of interfacial water, the lower the activity of this water as a solvent.

State of live microorganisms and state of water bound in them can be analysed in detail using nuclear magnetic resonance (NMR) spectroscopy5,6 and differential scanning calorimetry (DSC).7 Water bound to cells, macromolecules or inorganic materials strongly differs from bulk water in respect to its temperature behaviour, structure and activity as a solvent.4,5 This difference, e.g. reflecting in the freezing point depression and changes in the amounts of solutes dissolved in the interfacial water, depends on the amount of bound water, its organisation (confined space effects), and features of interactions with surroundings, not only with cellular structures but also with co-adsorbates and solutes (weakly polar, polar, or ionic).5 The concentration and temperature behaviour of intracellular water depending on the characteristics of the surroundings is of importance for renewal of activity of microorganisms. Note that interactions of fumed silica present in the aqueous media as individual nanoparticles can result in decomposition of cellular membranes.5 Therefore, TS 100 composed of nanoparticles strongly aggregated (by Si–O–Si bonding) in microparticles at ∼9.5 μm in average size is used in this study. The aim of this work was to study the characteristics of water bound to lactic acid bacteria depending on the water content, presence of a solute (trifluoroacetic acid), changes in the dispersion media (air, CDCl3, dimethylsulfoxide, n-decane), and presence of solid particles (thermal silica TS 100 or silylated silica gel Sipernat 50). This study was performed using low-temperature 1H NMR spectroscopy, cryoporometry, DSC, thermoporometry, infrared spectroscopy, microphotography, and thermogravimetry methods. A part of results is shown in the ESI file.

Experimental

Materials

Freeze-dry lactic acid bacteria, LAB (as a mixture of Lactococcus lactis subsp. actis Lactococcus lactis subsp. diacetylactis Lactococcus lactis subsp. cremoris Streptococcus salivarius subsp. thermophilus) used in production of sour cream contained less than 5 wt% of residual water. Certain amounts of distilled water were added to freeze-dry LAB equilibrated before NMR or DSC measurements. Then a certain amount of silica was added to differently hydrated LAB samples stirred to homogeneous state (or not stirred).

Commercial silica gel Sipernat 50 (Evonik, Germany, Si50, SBET = 503 m2 g−1, average size of particles d = 50 μm) was silylated by octadecyldimethylchlorosilane (Si50s, SBET = 261 m2 g−1, Vp = 1.217 cm3 g−1)8 and used in this study. The textural and structural characteristics of initial and silylated silica gels are given in the ESI file (Table S1, Fig. S1–S3). Used commercial thermal silica ACEMATT® TS 100 (Evonik, specific surface area ∼250 m2 g−1) is characterised by low content of adsorbed water, as well as silylated silica gel (Fig. S2). TS 100 is strongly agglomerated (due to treatment at high temperature) at ∼9.5 μm in average size of agglomerates9 (Fig. S4 in the ESI file). Note that the used silicas (TS 100 and silylated Sipernat 50) have close values of SBET but characterised by different morphology and texture of particles. Hydrophobised Sipernat 50 microparticles are larger and more durable than that of hydrophilic TS 100 agglomerates.

Deuterated organic compounds (solvents CDCl3 and (CD3)2SO) and trifluoroacetic acid F3CCOOD (TFAA) and non-deuterated n-decane were used in the measurements. Deuterated compounds were used to prevent their contribution into 1H NMR signals of water bound to LAB.

Microphotographs of samples were recorded using a Primo Star optical microscope (Carl Zeiss) at magnification ×400 or ×1000.

Methods

1H NMR spectra of static samples of LAB (placed into 5 mm NMR ampoules) with various amounts of water, co-adsorbates, and silica TS 100 in various dispersion media (air, CDCl3, CDCl3 + (CD3)2SO, or CDCl3 + (CD3)2SO + F3CCOOD) were recorded using a Varian 400 Mercury spectrometer (magnetic field 9.4 T, bandwidth 20 kHz) using eight 60° pulses of 1 μs duration. Relative mean errors were less than ±10% for 1H NMR signal intensity for overlapped signals, and ±5% for single signals. Temperature control was accurate and precise to within ±1 K. The accuracy of integral intensities was improved by compensating for phase distortion and zero line nonlinearity with the same intensity scale at different temperatures. To prevent supercooling of samples, the beginning of spectra recording was at T = 210 K. Samples precooled to this temperature for 10 min were then heated to 280 K at a rate of 5 K min−1 with steps ΔT = 10 K or 5 K at a heating rate of 5 K min−1 for 2 min. They were maintained at a fixed temperature for 9 min for data acquisition at each temperature for 1 min.5

The applications of the low-temperature 1H NMR spectroscopy and NMR cryoporometry, based on the freezing point depression of liquids located in pores depending on the pore size,10 to numerous objects were described in detail elsewhere.5,11 Note that high-molecular weight compounds do not contribute the 1H NMR spectra recorded here due to a large difference in the transverse relaxation time of liquid (mobile) small compounds (such as water, sugars, etc.) and macromolecules or solids and due to a narrow bandwidth (20 kHz) of the spectrometer.5

Differential scanning calorimetry (DSC) measurements of interactions of LAB with water, n-decane, and silylated silica gel Sipernat 50 were carried out using a PYRIS Diamond (Perkin Elmer Instruments, USA) differential scanning calorimeter at a constant heating/cooling rate of 10 °C min−1. PYRIS Diamond DSC was calibrated at different heating rates using such standard samples as distilled water (melting temperature Tm = 0 °C) and standard indium sample (Tm = 156.6 °C) supplied by the producer and using the standard calibration procedure recommended by the supplier.

Results and discussion

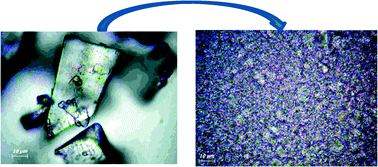
According to microphotos (see insert in Fig. 1 and S5 in the ESI file), suspending of freeze-dry LAB results in decomposition of aggregates of bacteria (10–100 μm in size, Fig. S5a in ESI). Individual LAB can be observed in the suspension (Fig. S5b in ESI). Suspended LAB demonstrate high mobility even after freezing of composites with silica at 210 K for 1.5 h and subsequent heating to room temperature. In the aqueous media, LAB can easily move from aggregates of wetted composite with TS 100 (Fig. S5c in ESI) into the liquid phase. Thus, addition of TS 100, which remains mainly in agglomerated state (Fig. S5c in ESI), does not lead to destroy of bacteria or diminution of their activity.
image file: c4ra15220d-f1.tif
Fig. 1 1H NMR spectra recorded at various temperatures of LAB at h = (a) 2 g/g and (b–d) 1 g/g pure ((a) and curves 1 (b)) or with addition of (b) 0.4 g/g TS 100 (curves 2–4) in air (2), CDCl3 (3) or CDCl3 with TFAA (6[thin space (1/6-em)]:[thin space (1/6-em)]1), (c) 0.2 g/g TFAA (curves 1), 0.2 g/g TFAA + 0.2 g/g CDCl3 (curves 2) or 0.2 g/g TFAA + 0.2 g/g CDCl3 + 0.2 g/g (CD3)2SO (curves 3 and (d)). Microphoto (insert, scale bar 10 μm) shows LAB in aqueous suspension.

The cell wall of Gram-positive bacteria, such as LAB, is a complex arrangement of macromolecules. It consists of a peptidoglycan sacculus that surrounds the cytoplasmic membrane and that is decorated with other glycopolymers, such as teichoic acids or polysaccharides, and proteins.12 Their interactions with a bare silica surface can be due to the formation of the hydrogen bonds between silanols and proton-acceptor or proton-donor functionalities of a LAB surface. A certain contribution to the silica/LAB bonding can be done by van-der-Waals (vdW) forces.4,5 In the case of hydrophobised silica surface, the LAB/silica interactions are mainly caused by the vdW forces. These features of interactions can affect the behavior of interfacial water.

For wetted LAB (hydration degree h = 2 g/g), there are several 1H NMR signals (Fig. 1a). Signal at the chemical shift of proton resonance δH = 4 ppm at 280 K and 5.5 ppm at 240 K (close to δH of bulk water) is due to the presence of strongly associated water (SAW). This water includes both weakly bound water (WBW, Table 1, Cwuw, Fig. 2a) frozen at 260 K < T < 273 K and strongly bound water (SBW, Table 1, Csuw) frozen at T < 260 K. A major fraction of water at h = 2 g/g is intracellular. The wetted LAB look like as a very thick viscous hydrogel. The major fraction of the water is unfrozen at T < 273 K (Table 1, Cwuw + Csuw and Vnano + Vmeso + Vmacro, Fig. 2a). A weaker complex 1H NMR signal at δH = 3.5 ppm (Fig. 1a) includes several lines. Some of them can be attributed to hydroxyls of saccharide molecules present in LAB lyophilisate as residual nutrients. There is 1H NMR signal at δH = 1 ppm. It can be assigned to methylene groups of phospholipids or other small mobile organic molecules and weakly associated water (WAW).5 Intensity of all 1H NMR signals of mobile molecules decreases with decreasing temperature due to partial freezing of water, saccharides and other mobile components.

Table 1 Characteristics of structures of unfrozen water bound in LAB at various surroundingsa
Additions h (g/g) Csuw (g/g) Cwuw (g/g) −ΔGs (kJ mol−1) γS (J g−1) Tm〉 (K) Snano (m2 g−1) Smeso (m2 g−1) Smacro (m2 g−1) Vnano (cm3 g−1) Vmeso (cm3 g−1) Vmacro (cm3 g−1)
a Note: h is the hydration degree of LAB (amounts of water in gram added per gram of freeze-dry LAB); Csuw and Cwuw are the amounts of weakly and strongly bound waters; ΔGs is the changes in the Gibbs free energy of water layer closely located to a surface of intracellular structures; γS is the modulus of the total changes in the Gibbs energy of bound water unfrozen at T < 273.15 K; 〈Tm〉 is the average melting temperature; Snano and Vnano, Smeso and Vmeso, and Smacro and Vmacro are the specific surface area and pore volume of nanopores at R < 1 nm, mesopores at 1 nm < R < 25 nm and macropores at R > 25 nm, respectively.
  2 0.707 1.053 1.26 25.5 265.7 0 82 5 0 1.666 0.094
  1 0.500 0.487 1.97 32.8 257.2 29 86 1 0.013 0.960 0.014
TS 100 (0.4 g/g) 1 0.500 0.422 1.97 32.6 256.1 61 73 1 0.027 0.878 0.017
TS 100/CDCl3 1 0.600 0.394 1.97 36.8 255.4 53 101 0.4 0.024 0.964 0.006
TS 100/CDCl3/TFAA 1 0.530 0.419 1.97 34.8 255.4 58 75 1 0.027 0.905 0.017
TFAA (0.2 g/g) 1 0.850 0.049 1.97 53.3 244.7 225 54 1 0.103 0.781 0.015
TFAA/CDCl3 1 0.720 0.118 1.97 46.5 246.3 248 49 2 0.113 0.700 0.025
TFAA/CDCl3/DMSO 1 0.750 0.206 1.97 53.7 246.0 324 60 2 0.146 0.786 0.024


image file: c4ra15220d-f2.tif
Fig. 2 (a and c) Relationship between the amounts of unfrozen water vs. temperature and changes in the Gibbs free energy of this water and (b and d) the corresponding size distributions of pores filled by unfrozen water (calculated using NMR-cryoporometry) at the hydration degree h = (a and b) 1 g/g (curves 1–4) and 2 g/g (curve 5) and (c and d) 1 g/g in various surroundings shown in (a) and (c). (b) Microphoto (insert, scale bar 10 μm) of a mixture of hydrated LAB (h = 1 g/g) interacting with TS 100 (0.4 g/g) (agglomerates of TS 100 are visible as particles of 5–10 μm in size).

In the case of a smaller amount of water (h = 1 g/g), 1H NMR signals are much broader (Fig. 1b–d) than that at h = 2 g/g (Fig. 1a). This can be explained by greater viscosity of the system at h = 1 g/g that results in decreased mobility of the molecules. Splitting of signals of water and saccharides disappears. Note that at h = 2 g/g, a fraction of water is extracellular in contrast to samples at h = 1 g/g, in which almost all water is intracellular. This difference reflects in the structural and thermodynamic characteristics of bound water unfrozen at T < 273 K (Table 1). For example, the free surface energy γS (determined as the modulus of the total changes in the Gibbs free energy of unfrozen water) is smaller, and ΔGs (changes in the Gibbs free energy of the first monolayer of bound water closely located to the surfaces of macromolecular structures of LAB) is less negative at h = 2 g/g due to weaker interaction of water with LAB than at h = 1 g/g (Table 1).

The volume of nanopores filed by unfrozen water (Table 1, Vnano) and related surface area (Snano) are greater at h = 1 g/g than at h = 2 g/g. However, the volumes of macropores (Vmacro) and mesopores (Vmeso), as well as Smacro, are greater at h = 2 g/g. Consequently, unfrozen water at h = 2 g/g (Fig. 2a) forms larger intracellular structures than at h = 1 g/g (Fig. 2b, compare curves 1 and 5). These structural features of water bound to LAB result in higher average melting temperature 〈Tm〉 (Table 1) at h = 2 g/g than at h = 1 g/g. In other words, the amounts of WBW (Cwuw) is greater at h = 2 g/g.

Addition of TS 100 to wetted LAB (h = 1 g/g) located in air medium or in CDCl3 weakly affects 1H NMR signals of water (Fig. 1b and 2a and b). This can be explained by the fact that the major fraction of water is intracellular. The intracellular water is inaccessible for silica microparticles (Fig. S4 and S5 in ESI) and poorly accessible for CDCl3 molecules because bacteria were completely hydrated and their surface is blocked by silica particles (i.e. bacteria are microencapsulated). Moreover, addition of TFAA (at the ratio 1[thin space (1/6-em)]:[thin space (1/6-em)]6 with CDCl3) weakly affects intracellular water (Fig. 1b, curves 4, Fig. 2a and b). In the case of interaction of F3CCOOD with water and due to fast H–D exchange, 1H NMR signal should demonstrate strong downfield shits. Concentrated non-deuterated TFAA gives signal at 11.5 ppm.13 Mixtures of TFAA with water can have signals between 11 and 6 ppm. However, these features are absent in the spectra (Fig. 1b). This effect can be explained by adsorption of TFAA onto agglomerated silica microparticles, which are characterised by significant textural porosity (Fig. S4 in ESI).

Addition of TFAA to hydrated LAB (without TS 100) results in changes in 1H NMR signals (Fig. 1c) in comparison with the system with TS 100 (Fig. 1b). This effect remains after addition of CDCl3 or CDCl3 + (CD3)2SO (Fig. 1c). Thus, in the absence of TS 100 (which can block the LAB surface), TFAA penetrating into LAB can more strongly interact with intracellular water. This results in the downfield shift of signal of water (containing a certain amount of TFAA) by 2–5 ppm (to 7–10 ppm) (Fig. 1c) and appearance of signal at δH = 11.5 ppm (Fig. 1d) characteristic for concentrated non-deuterated TFAA. Low-intensity signal at 4 ppm (whose position does not depend on temperature) can be attributed to mobile molecules of saccharides and other small organic molecules. Thus, from the spectral shape and intensity, one can conclude that TFAA can penetrate into LAB.

The entropy of water bound to LAB increases in the CDCl3 medium, especially after addition of TFAA, in comparison with the air dispersion medium (Fig. S6 in ESI). Addition of hydrophilic TS 100 weakly affects the entropy of the interfacial water in the air dispersion medium. These results correlate to changes in the values of γS (Table 1).

The DSC method is effective in quantitative characterisation of phase transition in complex materials and composites under isobaric conditions.7,14 Similar to NMR-cryoporometry, the DSC melting thermograms can be used in DSC thermoporometry for structural characterisation of the materials since bound liquids demonstrate the freezing–melting point depression in the DSC thermograms.15

The absence of a narrow freezing exotherm (Fig. 3a) and melting endotherm (Fig. 3b and c) at 0 °C characteristic for bulk water suggests that whole water is bound to LAB at the studied hydration degrees (Table 2). All observed exotherms (Fig. 3a) and endotherms (Fig. 3b and c) are linked to freezing or melting of bound water, respectively, since they are observed at T < 273 K. Certain contribution to these processes can be caused by cellular macromolecular structures and low-molecular weight compounds. Initial LAB or samples with added 0.1 or 0.2 g/g of water do not demonstrate clear phase transition of water, especially during freezing (Fig. 3a and S7). This can be explained by the fact that all intracellular water is strongly bound (structured) and cannot form ice crystallites, i.e. it remains amorphous after freezing. However, subtraction of the baseline and changes in the scale for curves 1–3 in Fig. 3b show broad melting endotherms but initial LAB does not demonstrate this feature (Fig. S7 in ESI).


image file: c4ra15220d-f3.tif
Fig. 3 DSC thermograms of (a) cooling and (b and c) heating runs of LAB samples at different amounts of added water (a and b) 0 (curves 1), 0.1 (2), 0.2 (3), 0.3 (4), 0.5 (5, 6) and 0.7 (7) g/g (details in Table 2), and (c) LAB interacting with silylated silica at CSi50s = 0.3 (curve 1), 0.4 (curves 2 and 3) and 0.5 (curves 4–6) g/g in various surroundings shown in Table 3. (d) Pore size distributions calculated using DSC thermoporometry for samples (a) 4 (curve 1 in (d)), 5 (2), 6 (3), 7 (4), and (c) 1 (curve 5 in (d)), 2 (6 in (d)), and 4 (7 in (d)). Microphoto (insert in (c), scale bar 10 μm) of freeze-dry LAB sample.
Table 2 DSC results for LAB at various content of water
No. h (g/g) ΔH/Tf or Tm (°C) (J g−1) m (mg) mw (mg)
a Cooling (exotherms).b Heating (endotherms), m is the mass of sample; mw is the amount of added water; Tf and Tm are the freezing and melting temperatures, respectively.
4a 0.3   −16.2/−45 18.807 5.642
5a 0.5 (run 1)   −69.3/−32 11.686 5.843
6a 0.5 (run 2)   −59.4/−35 11.686 5.843
7a 0.7 −17.4/−28 −208.4/−23 15.408 4.644
4b 0.3 19.3/−30 78.3/−18 18.807 5.642
5b 0.5 (run 1) 13.31/−32 78.1/−13 11.686 5.843
6b 0.5 (run 2) 12.29/−32 73.4/−12 11.686 5.843
7b 0.7 27.1/−30 217.5/−5 15.408 4.644


Bound water gives much smaller exothermic effects (Table 2, ΔH) than bulk water (ΔH = 330 J g−1). At h = 0.3 g/g, an exotherm appears at −45 °C (Fig. 3a). It shifts toward higher temperature with increasing water content because contribution of WBW increases. Freezing exotherm for wetted LAB at h = 0.7 g/g (Fig. 3a) and melting endotherms (Fig. 3b and c) show the presence of water structures of different sizes (Fig. 3d). These structures are characterised by different freezing or melting points according to the Gibbs–Thomson relation5,10,15 between freezing (melting) point depression and sizes of pores where this liquid is located. Note that the results of the first and second runs for sample at h = 0.5 g/g (Fig. 3a and b, curves 5 and 6, Table 2) are similar, i.e. LAB are stable during the used temperature treatments.

Addition (0.2 g/g) of nonpolar n-decane (melting point Tm,d = −30.5 to −29.2 °C) and silylated (hydrophobised) silica gel Si50s affected the shape of melting endotherms (Fig. 3c, Table 3) and structure of water (Fig. 3d). However, a melting peak of decane at temperature close to Tm,d is small. This can be explained by strong interaction of nonpolar n-decane with LAB and hydrophobic silica gel that results in freezing of decane at lower temperatures (due to the freezing point depression) and, therefore, broadening of its melting endotherm.

Table 3 DSC results (heating endotherms) for hydrated LAB with the presence of silylated silica gel and n-decane
No. CSS (g/g) ΔH/Tm (°C) (J g−1) m (mg) mw (mg)
a With addition of n-decane (0.2 g/g); CSS is the content of silylated silica gel; m is the mass of sample; and mw is the amount of added water.
1 0.30     28.1/−22 3.30 0.925
2 0.40   21.5/−30 86.3/−15 10.28 2.83
3a 0.40 21.6/−43 41.4/−25 57.7/−10 9.41 2.24
4 0.50   25.9/−30 148.9/−10 10.73 2.68
5a 0.50   20.2/−33 48.3/−13 8.63 1.96
6a 0.50 1.16/−43 5.21/−25 9.14/−10 4.12 0.93


The heat effects are sensitive to sample preparation. If decane is added to pre-stirred LAB at h = 0.5 g/g that total value of ΔH = 68.5 J g−1 (Table 3, sample 5). If a sample is stirred with added decane that the value of ΔH decreases (Table 3, sample 6), and the thermogram shape changes (Fig. 3c). This can be caused by displacement of water bound to LAB by decane. Note that the water amounts in samples of LAB with silylated silica gel are relatively small (Table 3), and this water is mainly intracellular. The water form relatively small structures (Fig. 3d). Additionally, the amounts of water in pores of hydrophobised silica gel can be small (Fig. S2 in ESI) and located in narrow mesopores of 1 nm < R < 3 nm in radius (Fig. 3d and S1). Consequently, main fraction of water is bound to LAB not to Si50s. Silylated silica gel microparticles, as well as hydrophilic agglomerated TS 100, can be used for microencapsulation of LAB without destroy of bacteria. Note that the silica envelope of the LAB can be varied from tens of nanometers (with non-agglomerated nanosilica5) to several microns (with agglomerated nanosilica). In the case of silica gel microparticles (d ≈ 50 μm), LAB can be considered as adsorbed onto larger particles to form a bacteria layer at their surface.

Conclusions

The structural and thermodynamic characteristics of intracellular liquids (water and organics) in lactic acid bacteria depend strongly on their contents and temperature, especially below freezing points of these liquids. This is due to significant changes in the properties of strongly and weakly liquids bound to bacteria in comparison with the bulk water. Penetration of small organic molecules (e.g. trifluoroacetic acid, chloroform) into LAB can be inhibited by particles of silica TS 100 encapsulating bacteria. In similar samples but without TS 100, TFAA penetration into bacteria occurs that is observed as appearance of corresponding 1H NMR signals of water–TFAA mixture absent in the presence of TS 100.

A certain portion of extracellular water is observed at the hydration degree h = 2 g of water per gram of freeze-dry LAB. At h ≤ 1 g/g, almost all water is intracellular. There are, at least, five types of intracellular and extracellular waters. There is strongly bound intracellular water (frozen at T < 260 K), which can be in states of weakly associated water (δH = 1–2 ppm) or strongly associated water (δH = 4–5 ppm). There is weakly bound intracellular and extracellular water (frozen at 260 K < T < 273 K), which can be both WAW and SAW. There is extracellular bulk water, which does not interact with bacteria. It can be observed in diluted suspensions of bacteria. The presence of both SBW and WBW results in diminution of the heat effects on cooling/heating of wetted LAB, since the values of ΔH for these waters are much smaller than that for bulk water. A low content of intracellular water prevents its crystallisation, therefore sharp freezing exotherm and melting endotherm are absent for LAB at h ≤ 2 g/g when the bulk water is absent. For storage of LAB, both hydrophilic agglomerated silica TS 100 and silylated silica gel Sipernat 50 can be used for microencapsulation of lactic acid bacteria without destroy of them.

Acknowledgements

The authors are grateful to European Community, Seventh Framework Programme (FP7/2007–2013), Marie Curie International Research Staff Exchange Scheme (IRSES grant no. 612484) for financial support of this project.

Notes and references

  1. (a) P. Gaspar, A. L. Carvalho, S. Vinga, H. Santos and A. R. Neves, Biotechnol. Adv., 2013, 31, 764 CrossRef CAS PubMed; (b) S. Crowley, J. Mahony and D. van Sinderen, Trends Food Sci. Technol., 2013, 33, 93 CrossRef CAS PubMed; (c) E. Tsakalidou and K. Papadimitriou, Stress responses of lactic acid bacteria, Springer Science & Business Media, 2011 Search PubMed; (d) K. Hofvendahl and B. Hahn–Hägerdal, Enzyme Microb. Technol., 2000, 26, 87 CrossRef CAS; (e) N. Toy, F. Özogul and Y. Özogul, Food Chem., 2015, 173, 45 CrossRef CAS PubMed.
  2. (a) T. A. Jennings, Lyophilization: Introduction and basic principles, Interpharm/CRC, Boca Raton, 1999 Search PubMed; (b) H. Bachmann, J. T. Pronk, M. Kleerebezem and B. Teusink, Curr. Opin. Biotechnol., 2015, 32, 1 CrossRef CAS PubMed; (c) C. Santivarangkna, U. Kulozik and P. Foerst, J. Appl. Microbiol., 2008, 105, 1 CrossRef CAS PubMed; (d) J. H. Crowe, J. F. Carpenter, L. M. Crowe and T. J. Anchordoguy, Cryobiology, 1990, 27, 219 CrossRef CAS; (e) R. F. Fakhrullin and R. T. Minullina, Langmuir, 2009, 25, 6617 CrossRef CAS PubMed; (f) F. Franks, Biophysics and biochemistry at low temperature, University Press, Cambridge, 1985 Search PubMed; (g) Z. Chen, L. Kang, Z. Wang, F. Xu, G. Gu, F. Cui and Z. Guo, RSC Adv., 2014, 4, 63807 RSC; (h) A. Mellati, S. Dai, J. Bi, B. Jin and H. Zhang, RSC Adv., 2014, 4, 63951 RSC.
  3. (a) Y.-C. Wang, R.-C. Yu and C.-C. Chou, Int. J. Food Microbiol., 2004, 93, 209 CrossRef CAS PubMed; (b) D. Berner and H. Viernstein, Sci. Pharm., 2006, 74, 137 CrossRef CAS; (c) S. Nanasombat, N. Sriwong and T. Ladkrabang, KMITL Science and Technology Journal, 2007, 7, 61 Search PubMed; (d) I. Coulibaly, R. Dubois-Dauphin, J. Destain, M.-L. Fauconnier, G. Lognay and P. Thonart, Int. J. Microbiol., 2010, 2010, 625239 Search PubMed; (e) A. A. Soro-Yao, S. Aka, P. Thonart and K. M. Djè, Open Biotechnol. J., 2014, 8, 1 CrossRef CAS; (f) M. Jiménez, E. Flores-Andrade, L. A. Pascual-Pineda and C. I. Beristain, Food Sci. Technol., 2015, 60, 346 Search PubMed.
  4. (a) M. Chaplin, Water structure and science, 2014, http://www.lsbu.ac.uk/water/ Search PubMed; (b) F. Henry, M. Gaudillat, L. C. Costa and F. Lakkis, Food Chem., 2003, 82, 29 CrossRef CAS.
  5. V. M. Gun'ko and V. V. Turov, Nuclear Magnetic Resonance Studies of Interfacial Phenomena, CRC Press, Boca Raton, 2013 Search PubMed.
  6. (a) A. R. Neves, W. A. Pool, J. Kok, O. P. Kuipers and H. Santos, FEMS Microbiol. Rev., 2005, 29, 531 CAS; (b) J.-P. Grivet and A.-M. Delort, Prog. Nucl. Magn. Reson. Spectrosc., 2009, 54, 1 CrossRef CAS PubMed; (c) M.-C. G. Chalbot and I. G. Kavouras, Environ. Pollut., 2014, 191, 232 CrossRef CAS PubMed; (d) L. Mannina, A. P. Sobolev and S. Viel, Prog. Nucl. Magn. Reson. Spectrosc., 2012, 66, 1 CrossRef CAS PubMed.
  7. (a) B. Wunderlich, Thermal analysis, Academic Press, New York, 1990 Search PubMed; (b) L. I. Mikhalovska, V. M. Gun'ko, A. A. Rugal, O. I. Oranska, Y. I. Gornikov, C. Morvan, C. Domas and S. V. Mikhalovsky, RSC Adv., 2012, 2, 2032 RSC; (c) V. A. Bershtein, V. M. Gun'ko, L. M. Egorova, Z. Wang, M. Illsley, E. F. Voronin, G. P. Prikhod'ko, P. N. Yakushev, R. Leboda, J. Skubiszewska-Zięba and S. V. Mikhalovsky, RSC Adv., 2012, 2, 1424 RSC; (d) V. A. Bershtein, V. M. Gun'ko, L. V. Karabanova, T. E. Sukhanova, P. N. Yakushev, L. M. Egorova, A. A. Turova, V. I. Zarko, E. M. Pakhlov, M. E. Vylegzhanina and S. V. Mikhalovsky, RSC Adv., 2013, 3, 14560 RSC.
  8. W. Tomaszewski, V. M. Gun'ko, J. Skubiszewska-Zieba and R. Leboda, Colloids Surf., A DOI:10.1016/j.colsurfa.2014.11.013 submitted for publication.
  9. Evonik Ind., ACEMATTR – Matting agents for the coatings industry, Technical Bulletin Fine Particles, 2014, no. 21.
  10. J. Mitchell, J. B. W. Webber and J. H. Strange, Phys. Rep., 2008, 461, 1 CrossRef CAS PubMed.
  11. (a) S. V. Mikhalovsky, V. M. Gun'ko, V. A. Bershtein, V. V. Turov, L. M. Egorova, C. Morvan and L. I. Mikhalovska, RSC Adv., 2012, 2, 2868 RSC; (b) I. N. Savina, V. M. Gun'ko, V. V. Turov, M. Dainiak, I. Yu. Galaev, G. J. Phillips and S. V. Mikhalovsky, Soft Matter, 2011, 7, 4276 RSC; (c) V. M. Gun'ko, V. V. Turov, V. M. Bogatyrev, V. I. Zarko, R. Leboda, E. V. Goncharuk, A. A. Novza, A. V. Turov and A. A. Chuiko, Adv. Colloid Interface Sci., 2005, 118, 125 Search PubMed; (d) T. V. Krupska, A. A. Turova, V. M. Gun'ko and V. V. Turov, Biopolym. Cell, 2009, 25, 290 CrossRef CAS.
  12. (a) W. N. Konings, O. P. Kuipers and J. H. J. Huis, Lactic acid bacteria: genetics, metabolism and applications, ed. i. Veld, Kluwer Academic Publisher, Dordrecht, 1999 Search PubMed; (b) S. A. F. T. van Hijum, S. Kralj, L. K. Ozimek, L. Dijkhuizen and I. G. H. van Geel-Schutten, Microbiol. Mol. Biol. Rev., 2006, 70, 157 CrossRef CAS PubMed; (c) M.-P. Chapot-Chartier and S. Kulakauskas, Microb. Cell Fact., 2014, 13(suppl. 1), S9 CrossRef PubMed.
  13. J. A. Pople, W. G. Schneider and H. J. Bernstein, High-resolution nuclear magnetic resonance, McGraw-Hill Book Company, New York, 1959 Search PubMed.
  14. M. Reading and D. J. Hourston, Modulated temperature differential scanning calorimetry: Theoretical and practical applications in polymer characterization, Springer Science & Business Media, 2006 Search PubMed.
  15. (a) J. N. Hay and P. R. Laity, Polymer, 2000, 41, 6171 CrossRef CAS; (b) M. R. Landry, Thermochim. Acta, 2005, 433, 27 CrossRef CAS PubMed.

Footnote

Electronic supplementary information (ESI) available. See DOI: 10.1039/c4ra15220d

This journal is © The Royal Society of Chemistry 2015