DOI:
10.1039/C4RA15085F
(Paper)
RSC Adv., 2015,
5, 16622-16630
Cerium functionalized PVA–chitosan composite nanofibers for effective remediation of ultra-low concentrations of Hg(II) in water†
Received
23rd November 2014
, Accepted 19th January 2015
First published on 20th January 2015
Abstract
Mercury contaminated drinking water significantly affects the central nervous system, kidneys and other organs in humans even at very low concentration. Higher concentration of mercury are reported to be effectively removed by adsorption and precipitation techniques. Reverse osmosis (RO) is a better known technique used for the removal of low concentration of Hg (<200 ppb). However, its limitations include low flux, high water rejection, high capital cost, in addition to being power dependent. The present study reports the fabrication of low cost, biodegradable, electrospun cerium functionalized PVA–chitosan (Ce–PVA–CHT) composite nanofibers for the effective removal of low concentrations of Hg(II) present in water. It adsorbs Hg(II) and purifies water up to safe potable limits as prescribed by WHO/US-EPA. The adsorption of Hg(II) over the surface of Ce–PVA–CHT is confirmed by SEM/EDAX, FTIR, XRD and XPS techniques. The adsorption studies are reported by varying parameters, viz. time, pH, adsorbent dose and varying contents of Ce in PVA–CHT nanofibers. Traceability is established by using SCP Science-U.K. made certified reference standard for the calibration of AAS-HG used for the determination of Hg(II). The kinetic data shows fast and efficient removal of Hg(II) and indicates to follow pseudo second order kinetics. The adsorption data is best fitted to the Langmuir isotherm and indicates monolayer adsorption of Hg(II).
1. Introduction
Mercury(II) is a highly reactive ion that binds to the amino acid cysteine proteins. It is considered to be a carcinogen, causing embryocidal, cytochemical, and histopathological events.1 On converting into methyl mercury, mercury and its compounds can affect the humans even at very low concentration.2,3 The main sources for mercury contamination of water are wastewater discharges from industries like chlor-alkali, paper and pulp, oil refining, paint, pharmaceuticals and batteries. The U.S. environmental protection agency (U.S. EPA) has set a very low discharge limit of 10 μg L−1 for Hg in wastewater.4 Various methods have been reported for the removal of Hg(II), including chemical precipitation, ion exchange, membrane filtration, electrochemical separation, reverse osmosis, solvent extraction and adsorption.5–7 Adsorption is considered to be a suitable option because it is rapid and economical, in addition to its lack of sludge by-product. Various non-conventional adsorbents have also been reported for Hg(II) remediation, including fly ash, iron oxide-dispersed activated carbon fibers,8 polymerized onion skin,9 peat moss,10 polymerized saw dust and cellulose.11 The presence of nitrogen in chitosan (CHT) is reported to show good affinity for Hg and other metallic elements. Therefore, nitrogen-rich polymers have been explored for Hg adsorption directly or as an adsorbent coating.12,13 CHT is considered as an excellent bio-adsorbent for the removal of metallic element cations at near-neutral pH, owing to the presence of a large number of amino groups. Hydrophilicity, the presence of large number of functional groups, high chemical reactivity, flexible polymer chains and biodegradability makes CHT a material of choice for the adsorption of metallic elements.14 The cationic behavior of CHT facilitates the attraction of metal anions due to the protonation of amino groups in an acidic medium.15 CHT composites have been reported for the removal of heavy metals. Chitin/cellulose composite membranes are reported for the effective removal of Hg(II).16 Chitosan as a modified magnetic chitosan,17 chitosan-coated magnetite nanoparticles,18 thiol-grafted chitosan,19 aminated chitosan beads,20 chitosan and chitosan derivatives grafted with poylacrylamide21 are reported as effective adsorbents for Hg(II). However, the removal of Hg(II) at low concentration is a challenging task. The literature indicates that most of the adsorbents require longer exposure time for effective removal. The present study attempts to eliminate the drawbacks associated with adsorbents previously reported by fabricating PVA–CHT composite nanofibers functionalized with Ce for efficient removal of Hg(II) from water present in low concentrations.
2. Experimental
2.1 Materials and apparatus
Chitosan powder (M.W; 100![[thin space (1/6-em)]](https://www.rsc.org/images/entities/char_2009.gif) 000–300000) from Across Organic, polyvinyl alcohol (M.W: approx. 125000) from CDH, formic acid, cerium(III) nitrate hexahydrate (M.W: 434.23) from Chemica-Biochemica reagents, and sodium borohydride (NaBH4), hydrochloric acid (HCl), ammonium hydroxide (NH4OH), potassium hydroxide (KOH), nitric acid (HNO3), and potassium nitrate (KNO3) from E. Merck India were used. Double distilled water was employed for all synthesis work, whereas deionized water (DI) of 18.2 mega Ω resistivity (Millipore, USA) was used for preparing samples for AAS-HG analysis.
000–300000) from Across Organic, polyvinyl alcohol (M.W: approx. 125000) from CDH, formic acid, cerium(III) nitrate hexahydrate (M.W: 434.23) from Chemica-Biochemica reagents, and sodium borohydride (NaBH4), hydrochloric acid (HCl), ammonium hydroxide (NH4OH), potassium hydroxide (KOH), nitric acid (HNO3), and potassium nitrate (KNO3) from E. Merck India were used. Double distilled water was employed for all synthesis work, whereas deionized water (DI) of 18.2 mega Ω resistivity (Millipore, USA) was used for preparing samples for AAS-HG analysis.
Electrospinning equipment (Physics Instrument Company, Chennai, India) was used to synthesize Ce–PVA–CHT composite nanofibers. The surface morphology and elemental distribution in Ce–PVA–CHT composite nanofibers were determined by scanning electron microscopy (SEM) (Model EVO M-1; Ziess), attached with energy dispersive X-ray spectroscopy (EDAX) for measuring elemental composition. A Fourier Transform Spectrophotometer (FTIR) (Model Nexus-47; Nicolet) was used to analyze functional groups, whereas X-ray diffraction (XRD) patterns of composite nanofibers were recorded on an Expert D6 model, Japan (λ-1.5404 Å). The un-adsorbed concentration of Hg(II) was determined on an AAS-HG (Vario-6-Analytik Jena, Germany). The adsorption studies for Hg(II) removal were carried out using reference standards (SCP Science, USA) after appropriate dilutions. X-ray photoelectron spectroscopy (XPS) spectra were recorded on a MULTILAB 2000 (Thermo Scientific, USA) using an X-ray (Mg Kα, radiation source) with a binding energy scan range of 0–1200 eV, and the work function of the spectrometer was 4.1 ± 0.1 eV. The collected high resolution XPS spectra were analyzed using an XPS peak fitting software program.
2.2 Fabrication of Ce–PVA–CHT composite nanofibers
Ce–PVA–CHT composite nanofibers were prepared by an electrospinning technique22 after optimizing the processing parameters. It has been observed from the various combinations of PVA and CHT ratio that bead free nanofibers were obtained at 7:3 ratio of PVA:CHT. Therefore, homogenous solutions of CHT powder (4 wt%) in 2 wt% formic acid and PVA (8 wt%) in 2 wt% acetic acid were prepared under magnetic stirring at room temperature. PVA and CHT solutions were mixed together in 7:3 ratios by magnetic stirring for 4–5 h to obtain a solution of desirable viscosity. Cerium(III) nitrate hexa-hydrate (0.5–5.0 w/w%) was then added and mixed until a clear solution was obtained. This solution was used for electrospinning using 2 mL syringe at 20 kV with flow rate of 0.2 mL h−1. A distance of 18–20 cm was maintained between syringe tip and collector. Aluminum foil was wrapped on the rotating collector to collect the composite nanofibers. Ce–PVA–CHT composite nanofibers were cured at ∼110 °C for 5 h prior to its use for Hg(II) adsorption studies.
2.3 pHPZC determination
The pHpzc determination of Ce–PVA–CHT composite nanofibers was carried out by the previously reported method.23 The composite nanofibers were suspended in 25 mL of 0.03 M KNO3 solution and kept overnight to stabilize the pH with continuous stirring followed by the addition of 0.1 mL of 1 M KOH. The pH value of the aforementioned solution was recorded after each addition of 0.1 M HNO3. Blank titration with 0.03 M KNO3 was also carried out following the same process to obtain a potentiometric curve between the pH and volume of HNO3 consumed. The intersection point in the potentiometric curve (Fig. 8(a)) was considered as the pHpzc of Ce–PVA–CHT composite nanofibers.
2.4 Adsorption studies
The batch adsorption studies were conducted by suspending composite nanofibers in Hg(II) solution. The stock solution of Hg(II) was diluted to desirable concentrations for adsorption studies, and pH was adjusted with the help of dilute hydrochloric acid or ammonium hydroxide solutions. Thus, the adsorbent was suspended in 100 mL of Hg(II) in beaker and stirred for 75 min on a magnetic stirrer (∼50 rpm; ambient temperature). After removing the adsorbent from the solution, the analyte concentration in the remnant was determined by AAS-HG.24,25
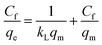
The adsorption capacity (qe) and efficiency were calculated using following equations, expressed as
| |
 | (1) |
and
| |
 | (2) |
where ‘
Ci’ and ‘
Cf’ (mg L
−1) are the initial and final concentrations of the Hg(
II) solution, respectively;
V is the volume (L) of the solution; ‘
m’ is the weight (g) of the Ce–PVA–CHT composite nanofibers.
A series of adsorption experiments were conducted by varying conditions like pH, adsorbent dosage and Ce content in Ce–PVA–CHT composite nanofibers for the adsorption of Hg(II). Kinetics and equilibrium studies were conducted for Langmuir and Freundlich isotherms at optimized conditions with varying concentrations (0.1–20 mg L−1) of Hg(II).
Recyclability and reuse of the Ce–PVA–CHT composite nanofibers used in Hg(II) adsorption was ascertained.26 Three cycles of regeneration were carried out by treating Hg-loaded Ce–PVA–CHT nanofibers with 0.01 M HCl. Thus, 15 mg of adsorbent was suspended in 100 mL of Hg(II) of 1000 (μg L−1) under magnetic stirring for 75 min at ∼50 rpm. After determining the concentration of Hg(II) in the remnant solution, the Hg-loaded adsorbent was treated with 50 mL solution 0.1 M HCl followed by thorough rinsing with DI water. The regenerated adsorbent was subjected to the second and third cycles of adsorption.
3. Results and discussion
3.1 SEM and EDAX
CHT is de-acetylated polymer of chitin, which is soluble in most acids as it becomes protonated in an acidic medium.27 Neat CHT solutions in acids are difficult to electrospun due their higher viscosities,28 whereas PVA solutions can be easily electrospun.29 For optimizing the solution parameters, various weight ratios of PVA and CHT (1–9:9–1) were investigated in the present course of work. Among the different experiments, it is observed that bead free nanofibers are obtained at a 7:3 weight ratio of PVA and CHT, which was ascertained by SEM observations. Therefore, to produce functionalized composite nanofibers in PVA and CHT solutions, cerium(III) nitrate hexahydrate (0.5–5.0%) was added to obtain a composite solution. When optimizing Ce content in PVA–CHT composite nanofibers, it was observed that Ce content between 0.5–3.5% produces continuous and bead free nanofibers, whereas Ce content >3.5% produces beaded, discontinuous nanofibers having droplets. On the basis of these observations, composite nanofibers with Ce content of 3.5% were prepared for adsorption studies.
SEM images and EDAX of Ce–PVA–CHT composite nanofibers, before and after adsorption, are depicted in the Fig. 1(a) and (b). Fig. 1(a) shows the nanofibers having a mat-like structure with smooth morphology without any beads, but there is some variation in nanofiber diameter. The elemental analysis by EDAX of composite nanofibers before adsorption shows the presence of C, Ce, and O only. There is change in surface morphology of Ce–PVA–CHT composite nanofibers after adsorption, as demonstrated in Fig. 1(b). The composite nanofibers appear to have swollen after exposure, possibly due to the absorption of water as a result of the hydrophilic nature of PVA polymer. EDAX analysis of the composite matrix after adsorption (Fig. 1(b)) establishes the presence Hg(II) along with that of Ce, C, and O.
 |
| | Fig. 1 SEM and EDAX of Ce–PVA–CHT composite nanofibers (a) before adsorption and (b) after adsorption of Hg(II). | |
The elemental mapping of Ce–PVA–CHT composite nanofibers shown in Fig. 2 illustrates the uniform distribution of adsorbed Hg(II) on the surface of composite nanofibers.
 |
| | Fig. 2 Elemental (C, O, N, Ce and Hg) mapping of Ce–PVA–CHT composite nanofibers after adsorption of Hg(II). | |
3.2 FTIR studies
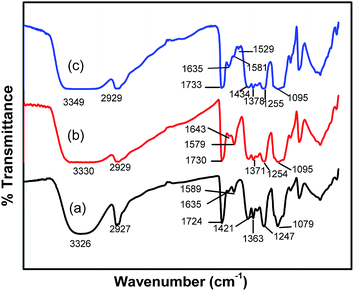
Fig. 3(a)–(c) illustrates FTIR spectra of PVA–CHT and Ce–PVA–CHT composite nanofibers with and without Hg(II), respectively.
 |
| | Fig. 3 FTIR spectra of (a) PVA–CHT, (b) Ce–PVA–CHT, and (c) Ce–PVA–CHT composite nanofibers after adsorption of Hg(II). | |
The spectrum of PVA–CHT nanofibers (Fig. 3(a)) shows the broad adsorption band at ∼3326 cm−1 indicating the –OH stretching of water and overlapping of –NH bands of CHT. The absorption band with maxima at 1724 cm−1 shows the presence of the O![[double bond, length as m-dash]](https://www.rsc.org/images/entities/char_e001.gif) C–NH group in PVA–CHT composite nanofibers, whereas the absorption at 1635 cm−1, 1589 cm−1 and 1363 cm−1 indicate the presence of amide groups, a characteristic of CHT.30 Bands with maxima at 1079 cm−1 and 1421 cm−1 are the stretching vibrations of CO and –OH in PVA, respectively. The interaction of the –NH group in CHT with Ce may be responsible for the shifting of adsorption peaks at 1363 cm−1 and 1075 cm−1 (Fig. 3(a)) to 1371 cm−1 and 1095 cm−1 (Fig. 3(b)), respectively.15 The C–H stretching vibrations are seen at 2929 cm−1 in each curve.31 Although peaks at 1643 cm−1 and 1579 cm−1 show shifts, the peak intensity at 1581 cm−1 is observed to increase (Fig. 3(b) and (c)). The respective shifting of absorption peaks at 1643 cm−1 and 1579 cm−1 (Fig. 3(b)) towards that of 1635 cm−1 and 1581 cm−1, along with formation of a new peak at 1529 cm−1 (Fig. 3(c)), may be attributed to the coordination of Hg(II) with nitrogen present in the composite nanofibers.17 Therefore, it can be concluded that –NH groups in CHT are mainly responsible for the interaction of Hg(II) on Ce–PVA–CHT composite nanofibers. The shifting of 3330 cm−1 to 3349 cm−1 also indicates the binding of Hg(II) with an oxygen atom of the hydroxyl groups as an adsorption site for Hg(II) removal.17 Previous studies suggest that –NH2 and –OH groups of chitosan are also involved in the adsorption of other metals like Co, Pb and Cr.32–34
C–NH group in PVA–CHT composite nanofibers, whereas the absorption at 1635 cm−1, 1589 cm−1 and 1363 cm−1 indicate the presence of amide groups, a characteristic of CHT.30 Bands with maxima at 1079 cm−1 and 1421 cm−1 are the stretching vibrations of CO and –OH in PVA, respectively. The interaction of the –NH group in CHT with Ce may be responsible for the shifting of adsorption peaks at 1363 cm−1 and 1075 cm−1 (Fig. 3(a)) to 1371 cm−1 and 1095 cm−1 (Fig. 3(b)), respectively.15 The C–H stretching vibrations are seen at 2929 cm−1 in each curve.31 Although peaks at 1643 cm−1 and 1579 cm−1 show shifts, the peak intensity at 1581 cm−1 is observed to increase (Fig. 3(b) and (c)). The respective shifting of absorption peaks at 1643 cm−1 and 1579 cm−1 (Fig. 3(b)) towards that of 1635 cm−1 and 1581 cm−1, along with formation of a new peak at 1529 cm−1 (Fig. 3(c)), may be attributed to the coordination of Hg(II) with nitrogen present in the composite nanofibers.17 Therefore, it can be concluded that –NH groups in CHT are mainly responsible for the interaction of Hg(II) on Ce–PVA–CHT composite nanofibers. The shifting of 3330 cm−1 to 3349 cm−1 also indicates the binding of Hg(II) with an oxygen atom of the hydroxyl groups as an adsorption site for Hg(II) removal.17 Previous studies suggest that –NH2 and –OH groups of chitosan are also involved in the adsorption of other metals like Co, Pb and Cr.32–34
3.3 XRD
The XRD patterns are illustrated to examine the adsorption behavior of Hg(II) over the surface of Ce–PVA–CHT composite nanofibers. The XRD pattern of CHT exhibits diffraction peaks at 2θ = 10.5°, 15.4° and 20.1° indicates semi-crystalline structure.35 Diffraction peaks at 2θ = 10.7° and 20.4° show inter- and intra-molecular hydrogen bonding in PVA.36 XRD patterns given in Fig. 4(a) and (b) show the appearances of two peaks at 2θ = 9.16° and 19.32°, whereas the peak at 15.4° disappears, indicating the interaction of PVA with CHT, which results in less crystalline structure of CHT. Diffraction peaks at around 38° and 44° are attributed to Ce complexation with PVA–CHT. However, after the adsorption of Hg(II) on the composite nanofibers, the peaks at 9.16° and 19.32° in Fig. 4(a) show a shift towards 2θ = 9.3° and 19.9° with an increase in intensity (Fig. 4(b)), indicating adsorption of Hg(II) on Ce–PVA–CHT composite nanofibers with increased crystallinity. The 2θ value 9.16° and 19.32° are related peaks of CHT, which indicates the interaction of Hg(II) with nitrogen present in it.
 |
| | Fig. 4 XRD pattern of Ce–PVA–CHT composite nanofibers (a) before and (b) after adsorption of Hg(II). | |
3.4 X-ray photon spectroscopy (XPS)
The interaction of Hg(II) with the surfaces of Ce–PVA–CHT composite nanofibers was studied by XPS. Wide-scan survey of Ce–PVA–CHT composite nanofibers before and after adsorption have been illustrated in Fig. 5. The spectrum shows two C1s peaks for the adsorbed composite sample (Fig. 5(b)) having binding energies of 284.9 and 289.5 eV. A doublet is also seen for the O1s peak having binding energies of 533.0 and 538.1 eV. These peaks could be assigned for –OH, –O–, and CO in composite nanofibers. Some other oxygen contamination forms such as CO and O–H of water might be associated. In addition, there is a possibility for oxygen contamination as a result of the reaction with atmospheric oxygen upon exposure of the composite nanofibers to air. The peak area between 850 to 895 eV belongs to the Ce 3d5/2. The doublet at 101 eV (Hg 4f5/2) and 104.5 eV (Hg 4f7/2) associated with Hg(II)37,38 is not well resolved due to contamination and significant noise in the Hg 4f region of XPS spectra. Because EDAX and elemental mapping indicates adsorbed Hg(II), the appearance of the peak at 102.5 eV can be considered as the Hg 4f peak for Hg(II).
 |
| | Fig. 5 XPS of Ce–PVA–CHT composite nanofibers before and after adsorption of Hg(II). | |
3.5 Adsorption kinetics
The efficiency of Hg(II) adsorption with time is carried out by exposing Ce–PVA–CHT composite nanofibers (15 mg) in a solution of Hg(II) (5.0 mg L−1) (pH, 5.3–6) at ambient temperature. Fig. 6(a) shows rapid adsorption of Hg(II) at initial stages, indicating the availability of more active sites for interaction. However, with the passage of time, adsorption decreases. The equilibrium is reached after 75 min, indicating that the composite nanofibers have reached the maximum adsorption capacity. To understand the characteristics of adsorption of Hg(II), pseudo first-order (3) and pseudo second-order (4) models were applied to fit the experimental data of the batch studies.39–42| | |
ln(qe − qt) = lnqe − k1t
| (3) |
| |
 | (4) |
 |
| | Fig. 6 (a) Effect of contact time on adsorption capacity (qe) of Hg(II); (b) pseudo second-order kinetics. | |
If time ‘t’ is zero, then the initial sorption rate ‘h’ becomes
where ‘
qe’ and ‘
qt’ (mg g
−1) represents the adsorption capacities at equilibrium and at time ‘
t’, respectively; ‘
h’ (mg g
−1 min
−1) is the initial adsorption rate; ‘
k’ (g mg
−1 min
−1) is the rate constant.
Fig. 6(a) shows the effect of time on adsorption capacity, whereas Fig. 6(b) illustrates the pseudo second-order kinetic model. The adsorption capacity (qe), rate constant (k) and coefficient of determination (R2) has been obtained from Fig. 6(b). The values of ‘qe’, ‘k’ and ‘R2’ calculated from slope and intercept are 31.25 mg g−1, 0.03 g mg−1 min−1 and 0.999, respectively. Fig. 7 shows pseudo first-order kinetics, which indicates poor fit to the data with k1 = 0.0121 (min−1) obtained from the plot of ln(qe − qt) vs. t. However, the experimental data deviates from calculated data in the case of a pseudo first-order model and also correlation coefficients, R2 = (0.826) is less than that of pseudo second-order R2 (0.999). These findings suggest that adsorption data does not follow pseudo first-order kinetics. The qe obtained from the pseudo second-order plot is very close to the experimental qe (31.26 mg g−1), and the correlation coefficient also exceeds 0.999. These results indicate that the pseudo second-order model closely fits to the data of Hg(II) adsorption. Other studies43,44 indicate that the pseudo second-order model gives better results using type-1 equation among other lineralized forms of pseudo second-order equation.
 |
| | Fig. 7 Pseudo first-order kinetics. | |
3.6 Influence of pH, dosage and Ce content on Hg(II) adsorption
pH plays an important role in the adsorption process for Hg(II) as it controls the surface charge of the adsorbent and the degree of ionization of adsorbate in an aqueous solution and facilitates the solid and liquid interface during the adsorption process. The adsorption behavior of Ce–PVA–CHT as a function of pH was examined by exposing 15 mg nanofibers in 100 mL of Hg solution (5.0 mg L−1) at different pH (2–10) (Fig. 8(b)). The adsorption of Hg(II) increases continuously from pH 2 to 5, whereas the adsorption of Hg(II) stabilizes at pH (5.3 to 6.0). At higher pH (>6.0), the adsorption of Hg(II) gradually decreases. The formation of metal hydroxide species such as soluble Hg(OH)+ or the insoluble precipitate of Hg(OH)2 could be the reason.45 The pHPZC of Ce–PVA–CHT composite nanofibers (Fig. 8(a)) was found in the range of 6.6–7.3. This is very close to the reported pHPZC of CHT, i.e. (6.4–7.2).46 The occurrence of adsorption at near neutral pH indicates the interaction of the amino groups of composite nanofibers with Hg(II). The free lone pair of electrons on the nitrogen atom of CHT participates in the coordination with the metal ion to give the corresponding CHT–metal complex. It has also been reported that at pH 5–6, the presence of the amino group in CHT (pKa = 6.5) becomes protonated, and H+ ions are produced in the presence of HCl, which leads to formation of anion complexes such as HgCl3−1. This anion is adsorbed on Ce–PVA–CHT composite nanofibers18,47 by a complex formation with amino and Ce present in composite nanofibers. No significant change in the pH value of the solution before and after Hg(II) adsorption was observed.
 |
| | Fig. 8 (a) pHPZC, (b) effect of pH, (c) effect of dose and (d) effect of Ce content in PVA–CHT Hg(II) adsorption. | |
The influence of adsorbent dosage on the adsorption of Hg(II) is carried out in 100 mL of 5.0 (mg L−1) Hg(II) solutions. The adsorbent dosage is varied from 5 to 20 mg. Fig. 8(c) shows the increase in % removal of Hg(II) with an increased adsorbent dosage. The observation indicates the increase in availability of free sites to bind Hg(II). With a further increase in dosage after achieving the maximum removal at 15 mg/100 mL, no increase in adsorption is observed. This indicates that some amount of Hg(II) ions remain in solution even after further addition of an adsorbent dosage.
The adsorption of Hg(II) as a function of Ce content in PVA–CHT is illustrated in Fig. 8(d). The adsorption of Hg(II) increases on the increase in Ce content from 0.5–3.5% in the PVA–CHT blend. The nanofibers with 3.5% of Ce content show the maximum adsorption. The higher concentration of Ce makes the solution more viscous, resulting in the formation of beaded and non-uniform nanofibers, and therefore, nanofibers with higher concentration of Ce are not prepared.
3.7 Adsorption isotherms
Adsorption isotherms are useful tools for understanding the adsorption process such as the equilibrium relationship between solid and liquid interfaces. Adsorption isotherms can be expressed in the form of Langmuir, Freundlich, Temkin and Dubinin–Radushkevich.48 Langmuir and Freundlich isotherms are the most commonly used adsorption isotherm models. The Langmuir isotherm, which describes the adsorption of the adsorbate onto the surface of the adsorbent is based on following assumptions: the adsorbent's surface is in contact with a solution having adsorbate attracted to the surface. The adsorbent's surface has a specific number of active sites to bind the solute's molecules. Only monolayer adsorption occurs on the surface of the adsorbent. However, the Freundlich isotherm commonly describes the adsorption characteristics for the heterogeneous surface or shows the multilayer's adsorption of the adsorbate onto the surface of the adsorbent.49
To investigate the effect of metal ion concentration on adsorption, the batch adsorption studies are carried out by exposing 15 mg of Ce–PVA–CHT composite nanofibers in 100 mL of Hg(II) solution under constant stirring for 75 min. The ion concentrations are varied from 0.1 to 20 mg L−1. After adsorption, the concentration ‘Cf’ of Hg(II) in solution is measured by AAS-HG. The results depicted in Fig. 9(a) and (b) indicate increases in Hg(II) adsorption capacity with an increase in concentration of Hg(II) while showing a decrease in adsorption in percentage terms. It is observed (Fig. 9(a)) that composite nanofibers effectively remove Hg(II) from 1000 μg L−1 to the level prescribed by WHO/U.S. EPA. It is also effective in removing even lower (<200 μg L−1) concentration of Hg(II). The highest adsorption ‘qm’ occurs at an Hg(II) concentration of 5000 μg L−1. The additional adsorption of Hg(II) is not observed after further increase in metal ion concentration. The saturation of all active sites of adsorbent with Hg(II) on the adsorbent surface would be the reason. The experimental data obtained from batch studies were applied to the Langmuir (6) and Freundlich (7) isotherms, expressed as
| |
 | (6) |
and
where ‘
qm’ and ‘
qe’ in mg g
−1 is the maximum adsorption capacity and adsorption capacity at equilibrium, respectively; ‘
Cf’ in mg L
−1 is the final concentration of Hg(
II) solution after adsorption;
KL in L mg
−1 is the reaction energy. The value of ‘
qm’ and ‘
KL’ are determined from slope and intercept of
Fig. 9(b). The valve of ‘
qm’, ‘
KL’ and ‘
R2’ are found to be 31.44 mg g
−1, 0.035 L mg
−1 and 0.999, respectively. The experimental data is well fitted to the Langmuir isotherm, which suggests monolayer adsorption over the surface of Ce–PVA–CHT composite nanofibers.
 |
| | Fig. 9 (a) Effect of initial concentration of Hg(II) on adsorption and (b) Langmuir adsorption isotherm. | |
The Langmuir isotherm can also be expressed by a dimensionless constant; the equilibrium parameter ‘RL’ (separation factor), which is very useful in predicting the feasibility and shape of the isotherm of the adsorption process by the equation
| |
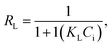 | (8) |
where ‘
KL’ is related to energy of adsorption called the Langmuir constant. On the basis of ‘
RL,’ nature of adsorption of Hg(
II) over Ce–PVA–CHT composite nanofibers can be predicted as unfavorable (>1), linear (=1), favorable (>0 or <1) or irreversible (=0). In the present investigation, ‘
RL’ value lies between zero and one,
i.e. (>0 or <1), indicating that the adsorption of Hg(
II) over Ce–PVA–CHT composite nanofibers is favorable.
Eqn (6) can also be represented as
| | |
logqe = logKf + 1/nlogCf.
| (9) |
The plot of ‘logqe’ vs. ‘logCi’ represents the applicability of the Freundlich isotherm, which is based on the assumption that adsorption occurs at the heterogeneous surfaces and any foreign material or pollutant can be allowed to adsorb in the multilayer of an adsorbent.50
Freundlich constants ‘Kf’ (L g−1) and ‘n’ are related to adsorption capacity and adsorption intensity, respectively. The values are calculated from the slope and intercept of Fig. 10. It also explains the dependence of adsorption on the initial concentration of Hg(II). If (1/n) < l, the bond energies increase with surface density; if (1/n) > l, the bond energies decrease with the surface density, and when n = 0, all surface sites are equivalent. The calculated value of n (=1.57 from Fig. 10) indicates favorable adsorption. It may be noted that if 1/n value is less than 1, adsorption follows the Langmuir isotherm, whereas if the value of 1/n is greater than 1, cooperative adsorption occurs.
 |
| | Fig. 10 Freundlich isotherms. | |
3.8 Removal of Hg(II) in the presence of diverse ions
Ce–PVA–CHT composite nanofibers effectively remove Hg(II) from 1000 ppb to safe potability limits prescribed by WHO/U.S. EPA. The experiments are carried out using municipal tap water spiked with a known concentration of Hg(II). The tap water contains Na, Ca up to 1000 ppm, K, Mg up to 150 ppm, Fe 2.5 ppm, chloride 30.5 ppm and TDS 550 ppm. It is observed that more than 99.0% of Hg(II) is effectively removed from the sample prepared in tap water. The individual effects of ions were also examined, and it is found that Na, Ca, K and Mg do not interfere significantly. However, the presence of Fe and Cl ions in water decreases the adsorption of Hg(II) up to 10%. Other metal ions, such as Zn, Pb, Cu, Ni, Cd and Mn also affect the adsorption on composite nanofibers and significantly interfere in Hg(II) removal (Table 1).
Table 1 Removal of Hg(II) in the presence of other metal ions
| S. n. |
Species |
Hg (μg L−1) |
Added species (μg L−1) |
Hg (μg L−1) left in solution |
| 1 |
Hg(II) |
1000 |
0.00 |
0.53 |
| 2 |
Zn |
1000 |
200 |
25.3 |
| 3 |
Pb |
1000 |
200 |
6.5 |
| 4 |
Cu |
1000 |
200 |
2.8 |
| 5 |
Ni |
1000 |
200 |
6.8 |
| 6 |
Cd |
1000 |
200 |
29.3 |
| 7 |
Mn |
1000 |
200 |
11.2 |
3.9 Recycling/regeneration of Ce–PVA–CHT
For ascertaining reusability, the Hg adsorbed composite nanofibers are subjected to regeneration by treating with 0.01 M HCl, followed by thorough washing with DI water and drying. The Ce–PVA–CHT used in first cycle shows removal of almost 1000 μg L−1 of Hg(II) whereas 68% and 38% is removed in the second and third cycles, respectively. Mild acidic conditions used for regeneration, coupled with the susceptibility of Ce–PVA–CHT to an acidic medium, could be responsible for reduced adsorption after successive cycles. The SEM examination indicates the deterioration of regenerated nanofiber morphology to a little bit rougher than neat nanofibers because of the surface etching by HCl. After the third cycle, the adsorption capacity of nanofibers is significantly reduced. This could be due to the significant stripping of CHT from the nanofibers or the ineffective removal of Hg(II) during its regeneration under mild acidic conditions.
4. Conclusions
A low cost, nontoxic, biodegradable Ce–PVA–CHT composite nanofibers has been fabricated by an electrospinning technique for the efficient removal of Hg(II). SEM-EDAX, FTIR, XRD and XPS studies confirm the adsorption of Hg(II) on Ce–PVA–CHT composite nanofibers. The functionalization of PVA–CHT by Ce is observed to improve the adsorption behavior as small ionic radii, high electrical charge and high potential energy of Ce helps in increasing the adsorption of Hg(II) on composite nanofibers. The maximum efficiency (31.44 mg g−1) for Hg(II) removal was observed at 3.5% of Ce content in PVA–CHT composite nanofibers. Ce–PVA–CHT works most efficiently in a pH range of 5.3–6.0. The kinetics of adsorption process indicates fast and efficient removal of Hg(II), while conforming to pseudo second-order kinetics model. The Langmuir isotherm exhibits monolayer adsorption. The fabricated composite nanofibers effectively remove Hg(II) at low-to-moderate concentrations. The adsorption studies, carried out on Hg(II) spiked municipal tap water containing several ionic species, shows the composite efficiently removes Hg to safe potable water limits as prescribed by WHO/U.S. EPA. Considering the nonwoven structure and its capacity to remove Hg(II) rapidly and even at low concentrations, the reported composite nanofibers could be a potential alternative for fast (high flux) and effective removal of Hg(II) from contaminated water.
References
- P. Miretzky and A. F. Cirelli, J. Hazard. Mater., 2009, 167, 10–23 CrossRef CAS PubMed
 .
. - J. G. Dorea and C. M. Donangelo, Clin. Nutr., 2006, 25, 369–376 CrossRef CAS PubMed .
- E. M. Nolan and S. J. Lippard, Chem. Rev., 2008, 108, 3443–3480 CrossRef CAS PubMed .
- K. H. Nam, S. Gomez-Salazar and L. L. Tavlarides, Ind. Eng. Chem. Res., 2003, 42, 1955–1964 CrossRef CAS .
- M. Monier, D. Ayad, Y. Wei and A. Sarhan, React. Funct. Polym., 2010, 70, 257–266 CrossRef CAS PubMed .
- F.-C. Wu, R.-L. Tseng and R.-S. Juang, Water Res., 2001, 35, 613–618 CrossRef CAS .
- F. Pérez-García, C. A. Galán-Vidal, J. G. Alvarado-Rodríguez, M. E. Páez-Hernández, N. Andrade-López and M. T. Ramírez Silva, Sep. Sci. Technol., 2013, 48, 736–740 CrossRef .
- W. Knocke and L. Hemphill, Water Res., 1981, 15, 275–282 CrossRef CAS .
- P. Kumar and S. Dara, J. Polym. Sci., Polym. Chem. Ed., 1981, 19, 397–402 CrossRef CAS .
- P. Brown, S. Gill and S. Allen, Water Res., 2000, 34, 3907–3916 CrossRef CAS .
- R. R. Navarro, K. Sumi, N. Fujii and M. Matsumura, Water Res., 1996, 30, 2488–2494 CrossRef CAS .
- S. Kagaya, H. Miyazaki, M. Ito, K. Tohda and T. Kanbara, J. Hazard. Mater., 2010, 175, 1113–1115 CrossRef CAS PubMed .
- G. Zong, H. Chen, R. Qu, C. Wang and N. Ji, J. Hazard. Mater., 2011, 186, 614–621 CrossRef CAS PubMed .
- G. Crini, Prog. Polym. Sci., 2005, 30, 38–70 CrossRef CAS PubMed .
- F. Wang and M. Ge, Text. Res. J., 2012 Search PubMed , 0040517512454188.
- H. Tang, C. Chang and L. Zhang, Chem. Eng. J., 2011, 173, 689–697 CrossRef CAS PubMed .
- G. Z. Kyzas and E. A. Deliyanni, Molecules, 2013, 18, 6193–6214 CrossRef CAS PubMed .
- N. Rahbar, A. Jahangiri, S. Boumi and M. J. Khodayar, Jundishapur Journal of Natural Pharmaceutical Products, 2014, 9(2), e15913 Search PubMed .
- J. D. Merrifield, W. G. Davids, J. D. MacRae and A. Amirbahman, Water Res., 2004, 38, 3132–3138 CrossRef CAS PubMed .
- C. Jeon and K. Ha Park, Water Res., 2005, 39, 3938–3944 CrossRef CAS PubMed .
- N. Li, R. Bai and C. Liu, Langmuir, 2005, 21, 11780–11787 CrossRef CAS PubMed .
- S. R. Dhakate, A. Gupta, A. Chaudhari, J. Tawale and R. B. Mathur, Synth. Met., 2011, 161, 411–419 CrossRef CAS PubMed .
- N. Fiol and I. Villaescusa, Environ. Chem. Lett., 2009, 7, 79–84 CrossRef CAS PubMed .
- N. Singh, T. Ahuja, V. N. Ojha, D. Soni, S. S. Tripathy and I. Leito, SpringerPlus, 2013, 2, 453 CrossRef PubMed .
- N. Singh and A. Sarkar, Asian J. Chem., 2003, 15, 1593–1597 CAS .
- S. Saber-Samandari and M. Gazi, Sep. Sci. Technol., 2013, 48, 1382–1390 CrossRef CAS .
- M. Rinaudo, G. Pavlov and J. Desbrieres, Polymer, 1999, 40, 7029–7032 CrossRef CAS .
- K. Sun and Z. Li, eXPRESS Polym. Lett., 2011, 5, 342–361 CrossRef CAS .
- S. Tripathi, G. Mehrotra and P. Dutta, Int. J. Biol. Macromol., 2009, 45, 372–376 CrossRef CAS PubMed .
- U. K. Parida, A. K. Nayak, B. K. Binhani and P. Nayak, J. Biomater. Nanobiotechnol., 2011, 2, 414 CrossRef CAS .
- A. Pawlak and M. Mucha, Thermochim. Acta, 2003, 396, 153–166 CrossRef CAS .
- C. Yuwei and W. Jianlong, Chem. Eng. J., 2011, 168, 286–292 CrossRef PubMed .
- L. Jin and R. Bai, Langmuir, 2002, 18, 9765–9770 CrossRef CAS .
- K. Vimala, M. M. Yallapu, K. Varaprasad, N. N. Reddy, S. Ravindra, N. S. Naidu and K. M. Raju, J. Biomater. Nanobiotechnol., 2011, 2, 55 CrossRef CAS .
- Y.-T. Jia, J. Gong, X.-H. Gu, H.-Y. Kim, J. Dong and X.-Y. Shen, Carbohydr. Polym., 2007, 67, 403–409 CrossRef CAS PubMed .
- K. Nakane, T. Yamashita, K. Iwakura and F. Suzuki, J. Appl. Polym. Sci., 1999, 74, 133–138 CrossRef CAS .
- K. Lisha, S. M. Maliyekkal and T. Pradeep, Chem. Eng. J., 2010, 160, 432–439 CrossRef CAS PubMed .
- H. Cui, Y. Qian, Q. Li, Q. Zhang and J. Zhai, Chem. Eng. J., 2012, 211, 216–223 CrossRef PubMed .
- B. Chen, Z. Zhu, J. Ma, Y. Qiu and J. Chen, J. Mater. Chem. A, 2013, 1, 11355–11367 CAS .
- P. K. Tripathi, M. Liu, Y. Zhao, X. Ma, L. Gan, O. Noonan and C. Yu, J. Mater. Chem. A, 2014, 2, 8534–8544 CAS .
- L. W. Low, T. T. Teng, A. Ahmad, N. Morad and Y. S. Wong, Water, Air, Soil Pollut., 2011, 218, 293–306 CrossRef CAS .
- Y.-S. Ho and G. McKay, Chem. Eng. J., 1998, 70, 115–124 CrossRef CAS .
- M. I. El-Khaiary, G. F. Malash and Y.-S. Ho, Desalination, 2010, 257, 93–101 CrossRef CAS PubMed .
- H. Ghoveisi, J. Farhoudi, M. Omid and A. M. Mazdeh, Journal of Civil Engineering and Urbanism, 2013, 3(2), 73–76 Search PubMed .
- A. M. Donia, A. A. Atia and K. Z. Elwakeel, J. Hazard. Mater., 2008, 151, 372–379 CrossRef CAS PubMed .
- L. Dambies, C. Guimon, S. Yiacoumi and E. Guibal, Colloids Surf., A, 2000, 177, 203–214 CrossRef .
- L. Zhou, Z. Liu, J. Liu and Q. Huang, Desalination, 2010, 258, 41–47 CrossRef CAS PubMed .
- C. Karthika and M. Sekar, Res. J. Environ. Sci., 2012, 1, 34–41 Search PubMed .
- I. Langmuir, J. Am. Chem. Soc., 1918, 40, 1361–1403 CrossRef CAS .
- P. K. Tripathi, M. Liu and L. Gan, RSC Adv., 2014, 4, 23853–23860 RSC .
Footnote |
| † Electronic supplementary information (ESI) available. See DOI: 10.1039/c4ra15085f |
|
| This journal is © The Royal Society of Chemistry 2015 |
Click here to see how this site uses Cookies. View our privacy policy here. 


