Directed synthesis, growth process and optical properties of monodispersed CaWO4 microspheres via a sonochemical route
Jira Janbuaa,
Jitkasem Mayamaea,
Supamas Wirunchita,
Rattanai Baitahea and
Naratip Vittayakorn*abc
aElectroceramic Research Laboratory, College of Nanotechnology, King Mongkut's Institute of Technology Ladkrabang, Bangkok 10520, Thailand. E-mail: naratipcmu@yahoo.com
bDepartment of Chemistry, Faculty of Science, King Mongkut's Institute of Technology Ladkrabang, Bangkok 10520, Thailand
cAdvanced Materials Science Research Unit, Faculty of Science, King Mongkut's Institute of Technology Ladkrabang, Bangkok 10520, Thailand
First published on 12th February 2015
Abstract
Monodispersed calcium tungstate (CaWO4) microspheres were synthesized successfully via a sonochemical process in deionized (DI) water. The functional group and phase formation analyses were carried out using Fourier transform infrared (FT-IR) and X-ray diffraction (XRD), respectively. XRD revealed that all samples were of pure tetragonal scheelite structure. FT-IR and Raman analysis exhibited a W–O stretching peak of molecular [WO4]2−, which related to the scheelite structure. The effect of ultrasonic irradiation times in the sonochemical process was investigated briefly for 1, 5, 15 and 30 min. The shape of the particles was revealed as spherically monodispersed with narrow size distribution and uniform features at the ultrasonic time of 5 min. This study also found that the spherical surface was composed of tightly packed nanosphere subunits. A possible mechanism for the formation of CaWO4 powders with a different ultrasonic time was discussed in detail. Optical properties showed blue light emission at a wavelength of around 420 nm and an optical energy gap (Eg) value of 3.32–3.36 eV.
Introduction
The tetragonal scheelite structure and space group I41/a of calcium tungstate (CaWO4) has a Ca2+ and W6+ ion in 8-fold, and tetrahedral site of oxygen coordination, respectively.1 It is well known that CaWO4 with a scheelite structure is a commercially important material with luminescence properties.1–3 It has been used as blue phosphor (433 nm) in laser host materials,4–6,7 quantum electronics, scintillators in medical devices,1,3–5 and oscilloscopes.1,3–5 Phosphors made up from monodispersed and microsized spherical morphology are known to be suitable for application because they have higher packing density, scattering and re-absorption of light than small spherical particles.8–10 As a result, their high resolution, screen brightness and efficiency provide better luminescence performance.However, an ideal morphology of phosphor particles demands a perfect spherical shape, narrow size distribution and non-agglomeration. Therefore, various preparation methods have been developed actively for controlling morphology, size and distribution. For instance, Pan et al.8 synthesized quasi-monodispersed AWO4 (A = Ca, Sr, and Ba) microspheres with a diameter of about 3 μm by a hydrothermal route at a temperature of 180 °C for 8 h in the presence of citric acid. Although this method uses a low reaction temperature, it has a long holding time in the synthesis process. Furthermore, monosized CaWO4 microspheres were obtained by Zhang et al.9 via a large scale solvothermal method (4.4 to 6.8 μm) with a surfactant-assisted solution route, in which either sodium dodecylbenzenesulfonate (SDS) or cetyltrimethyl ammonium bromide (CTAB) was used. Their method needed surfactant-assisted solution, which is an expensive reagent and not environmentally friendly, and surfactants must be removed completely to obtain a pure product. This makes the synthetic step more complicated. Over the past few years, the sonochemical process has been applied to applications for synthesizing and customizing micro- and nano-structured inorganic and organic materials. The mechanism in this process occurred from acoustic cavitation (the formation, growth, and implosive collapse of bubbles in a liquid). This process has advantages such as uncomplicated steps, low energy consumption, time saving and high purity.
This study reports the fast synthesis of CaWO4 microspheres almost monodispersed via the sonochemical route by using deionized (DI) water as intermediate solvent, which is environmentally friendly and has no assistance from surfactant or a template. The influence of different ultrasonic irradiation times, crystal structure, optical properties, and microstructure was investigated.
Experimental procedure
Calcium nitrate tetrahydrate (99% Ca(NO3)2·4H2O) and sodium tungstate dihydrate (99% Na2WO4·2H2O) were purchased from Sigma–Aldrich Reagents Co., Ltd. and used without further purification. In a typical procedure, each 0.0167 mole of Ca(NO3)2·4H2O and NaWO4·2H2O was dissolved separately in 50.00 ml of deionized (DI) water by stirring continuously until dissolved completely (transparent solution), without using an adjusted pH value of starting materials. After that, two solutions were added into the chamber and the ultrasonic probe (3 mm diameter; Ti-horn) was immersed with the frequency of pulsed ultrasound waves (conducted in the 2s mode; and a pause in 1s mode) at 20 kHz and 70 W cm−2. The influence of different ultrasonic irradiation times was applied in the chamber containing mixed substrate solution for 1, 5, 15, and 30 min by the following reaction:
 | (1) |
The white precipitate particles were washed with distilled water several times and then absolute ethanol before drying at 90 °C for 24 h. The X-ray diffraction (XRD) patterns of products were characterized by an X-ray diffractometer (D8 Advance). The morphology of products was obtained by scanning electron microscope (SEM). The vibration mode of the bond in molecules was obtained from Fourier transform infrared (FT-IR spectrum Gx, Perkin Elmer, America) spectra. The sample was recorded in a wavelength range of between 400 and 4000 cm−1, and a Raman spectrophotometer (DXR smart Raman, thermo scientific) with argon (Ar) laser recorded its wavelength range of between 200 and 1000 cm−1. The optical properties were investigated, and a portion of emission property was measured by a fluorescence spectrophotometer (Cary Eclipse model; Agilent Technologies, Varian, USA) with Xe lamp at room temperature, using an excitation wavelength (λex) of 235 nm. A solid sample holder was used as a coated sample. The optical absorbance spectrum was examined by a UV-Vis spectrophotometer (T60, PG Instruments Limited) in the wavelength range of between 200 and 900 nm. The solution samples were prepared via mixing the powder samples in hydrogen peroxide to form a concentrated solution of 2 mM.
Results and discussion
a) Crystal structure
All the diffraction peaks in XRD patterns of the as-prepared CaWO4 powders were synthesized by the sonochemical method at different ultrasonic irradiation times of 1, 5, 15 and 30 min, and could be indexed to a pure tetragonal scheelite structure (a = b ≠ c, α = β = γ = 90°) with space group I41/a, when compare to the Joint Committee on Powder Diffraction Standards (JCPDSs) card no. 41-1431. Diffraction peaks corresponding to the secondary phase were undetected, and not a shift peak at different sonication times. In addition, peak intensities could be found to increase when ultrasound treatment time increases, as compared to the curves of four products that indicate better crystallization.11 The percentage yield of the products obtained by this method was about 95%.The Rietveld refinement method of XRD patterns was performed for CaWO4 powders using the Fullprof program, as shown in Fig. 1. This technique is based on the least-squares method,12 where the theoretical peak patterns are adjusted upwards to converge with the result of measured patterns. It displays various advantages of typical quantitative analysis techniques, which comprise the use of pattern-fitting algorithms, and all lines of each crystallographic phase are considered explicitly. From structural refinement analysis, which provides various data on factors generally checked by quality algorithms of R-factors or chi-squared (χ2), the difference between the measured and theoretical simulation patterns is considered a way to verify success of the refinement. The χ2 value is the quality of fit, as the value distinguishes between theoretical simulations and the XRD pattern data result, which is more or less consistent, and this value should approach 1.
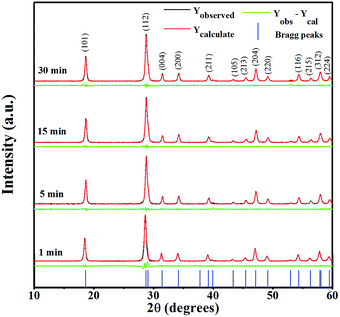 | ||
| Fig. 1 Rietveld analysis of XRD patterns of CaWO4 powders synthesized by the sonochemical method at different ultrasonic irradiation times. | ||
Upon inspection of the data, the tetragonal I41/a space group and parameters (a, b, c, α, β, and γ) acquired from JCPDS Card no. 41-1431 were chosen for the initial refinement of the model. The fit of the XRD pattern data gave an χ2 value of 1.27, 1.63, 2.11 and 2.34 for ultrasonic irradiation times of 1, 5, 15 and 30 min, respectively, which agreed well with acceptance for fitting the data. A large match of model intensities in peak variety, position and shape was assumed as correct from resulting refinement. This revealed that the selected space group and parameters were correct, and not that a completely pure phase of CaWO4 was obtained at a 1 min sonication time, thus suggesting this method be used for a very short time and utilized practically for synthesis of monodispersed CaWO4 microspheres in field applications. The lattice parameters were calculated by using the Fullprof program, and those obtained were seen as a tetragonal unit cell type with a and c parameter values, as shown in Table 1. When comparing these lattice parameter values with JCPDS Card no. 41-1431, and lattice values from other various methods,3,4,6,13 good and acceptable agreement is found. However, the method in this study has more precise cell parameters than in other techniques, with the least deviation observed.
| Methods | Time | Lattice parameters (Å) | χ2 | Ref. | |
|---|---|---|---|---|---|
| a | c | ||||
| Sonochemical | 1 min | 5.238 ± 0.002 | 11.389 ± 0.003 | 1.27 | This work |
| Sonochemical | 5 min | 5.243 ± 0.001 | 11.370 ± 0.004 | 1.63 | This work |
| Sonochemical | 15 min | 5.235 ± 0.001 | 11.369 ± 0.003 | 2.11 | This work |
| Sonochemical | 30 min | 5.240 ± 0.001 | 11.379 ± 0.005 | 2.34 | This work |
| Hydrothermal | 8 h | 5.252 | 11.388 | — | 8 |
| Solvothermal | 12 h | 5.46 | 12.04 | — | 9 |
The Fourier transform infrared (FT-IR) and Raman spectra were used to characterize the molecular structure of metal tungstate in order to verify the product structure. Typical CaWO4 had a primitive cell of scheelite structure, which was characterized in its molecule consisting of [WO4]2− molecular ionic groups (W metal in the tetrahedral site of O), with a strongly covalent W–O bond. The bonding between the [WO4]2− molecular ionic groups and Ca2+ cations indicated loosely coupled bonds that were isolated from each other, while the Ca2+ was surrounded by eight oxygen ions. CaWO4 presented a tetragonal structure of the symmetry,C64h, at room temperature. The group theory calculation presented 26 different lattice vibrations for the CaWO4 in a unit cell, where a zero wave vector can be described by the following equation.3,13–15
| Γ = 3Ag + 5Au + 5Bg + 3Bu + 5Eg + 5Eu | (2) |
| Γ = 3Ag + 5Bg + 5Eg + 4Au + 4Eu | (3) |
All even vibrations (Ag, Bg and Eg) are Raman-active modes, while the odd modes (Au and Eu) are active only in the infrared frequency range. Therefore, a 13 zone-center was expected in the Raman-active modes of CaWO4, as presented in the following equation.3,15
| Γ = 3Ag + 5Bg + 5Eg | (4) |
From the literature, the vibrational modes found in the Raman spectra of CaWO4 can be classified into two groups consisting of internal and external modes. Internal vibrations correspond to vibrations inside the [WO4]2− molecular ionic group, which is considered as a stationary mass center. The lattice phonons or external vibrations are related to motion of the Ca2+ cations and rigidly molecular ionic [WO4]2−. In free space, [WO4]2− tetrahedrons have a cubic point symmetry Td,3,14,15 in which their vibrations are composed of four internal modes, ν1(A1), ν2(E1), ν3(F2) and ν4(F2), with one free rotation mode, νf.r.(F1), and one translation mode (F2).3,14,15
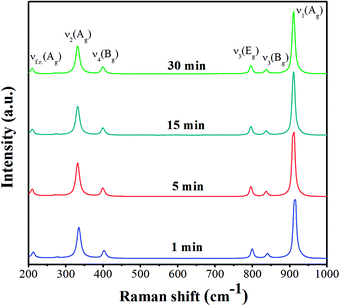
Raman spectra of CaWO4 powders were obtained at different ultrasonic irradiation times (1, 5, 15 and 30 min), and operated in the wavenumber range of 200–1000 cm−1 by using Ar laser as an excitation source, as shown in Fig. 2. The graph shows six different modes of ν1(Ag), ν3(Bg), ν3(Eg), ν4(Bg), ν2(Ag), and the free rotation of the z axis [νf.r.(Ag)], occurring at about 914, 842, 798, 404, 333 and 212 cm−1, respectively. The vibration modes in the Raman spectrum are Ag, Bg and Eg with peaks found mainly in internal modes, with W–O symmetric stretching vibration in molecular ionic [WO4]2−.3
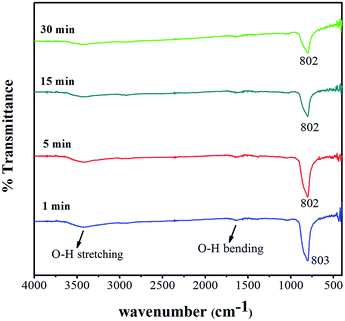
FT-IR spectra of CaWO4 powders obtained at different ultrasonic irradiation times (1, 5, 15 and 30 min), and operated at the wavenumber range of 400–4000 cm−1 are shown in Fig. 3. The FT-IR spectrum demonstrated a strong peak at about 802–803 cm−1, which is in accordance with W–O asymmetric stretching vibration in molecular ionic [WO4]2−,3 and weak W–O bending at about 430–460 cm−1. Furthermore, O–H stretching and O–H bending vibration of residual water were detected in powder products at 3070–3690 cm−1 and 1620 cm−1,3,16 respectively.
b) Optical properties
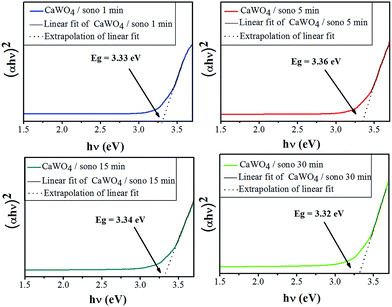
The optical energy gap (Eg) of CaWO4 powders was obtained from the calculation of their absorbance spectrum in UV-visible range by using Wood and Tauc's equation,3,16 which proposed the following:| αhν = (hν − Eg)n | (5) |
α = −ln![[thin space (1/6-em)]](https://www.rsc.org/images/entities/char_2009.gif) T/d T/d
| (6) |
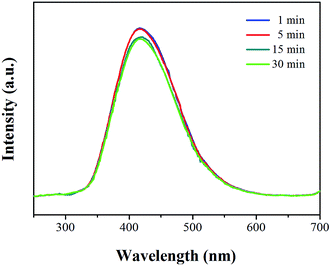
A fluorescence spectrophotometer was used to confirm the light emission spectrum of CaWO4 powders. Fig. 5 shows the fluorescence spectra of CaWO4 microsphere powder samples obtained at different sonication times by using an excitation wavelength (λex) of 235 nm. The broad peak emission positioned at a wavelength of around 420 nm indicates the direct transition gap of CaWO4 microparticles. The blue light emission occurred from the 1T2 → 1A1 transition intrinsic molecular anion [WO4]2−group cluster.3 The fluorescence spectrum discovered different intensities that could be the result of various particle sizes and crystallinity.11 When comparing with the peak position of emission in bulk CaWO4, the tetragonal (scheelite) structure has a wavelength of 433 nm (2.87 eV),18 where good acceptable agreement is found.
c) Microstructure
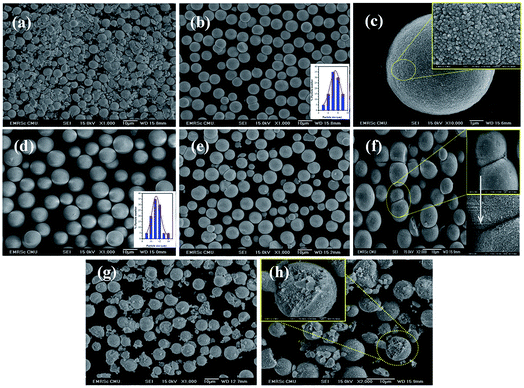
Fig. 6(a) shows the products prepared from mixing substance solution, then leaving it until precipitation occurs (without ultrasonic irradiation). The morphology obtained varied greatly, with broad size distribution. The particle sizes were difficult to measure, due to the random aggregation of mixed powder that appeared between spherical particles and spread nanoparticles. Fig. 6(b)–(h) show CaWO4 powders synthesized under different ultrasonic irradiations. Near spherical shape and narrow particle size distribution, with a micron size of the powders, were observed clearly at a radiation time of 1 min [Fig. 6(b)]. The average size of the microsphere was about 7.59 ± 1.20 μm. When enlarging the image of only one particle [Fig. 6(c)], the texture of microspheres was composed of aggregated small nanoparticles, with an average particle size of 52.87 ± 1.39 nm. The mono size with spherical shape was observed clearly at a sonication time of 5 min [Fig. 6(d)]. The average diameter of the spheres increased to about 11.20 ± 1.07 μm. Furthermore, the morphology obtained at the sonication time of 15 min was a mixture of small and large microsphere particles and rarely spherical-shaped ones [Fig. 6(e)]. Evidently, the neck between the microsphere particles was observed from this condition. Fig. 6(f) shows expansion of the neck with melted nanoparticles on the surface area. When the reaction time increased to 30 min, a very rough surface of microparticles was obtained, as shown in Fig. 6(g). Furthermore, neck point breaking is shown between microspheres, with small clusters of particles that had broken off [Fig. 6(h)].Possible growth process and effect of ultrasonic irradiation time
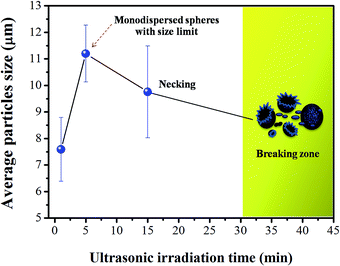
Fig. 7 shows a schematic illustration of the growth process of monodispersed CaWO4 microspheres via the sonochemical process by ultrasonic time-dependent experiments. The precursor solid (as the calcium and tungstate ion source) was hydrolyzed immediately in DI water as solvent in order to create Ca2+ and WO42− ions. Additionally, Ca2+ and WO42− species were attracted at the initial formation stage by electrostatic interaction, and formed numerous CaWO4 nuclei. Subsequently, the mixed solution was irradiated with high-intensity ultrasound (70 W cm−2, 20 kHz). Precipitation in the liquid–solid heterogeneous system was accelerated completely by ultrasonic irradiation, which resulted from the acoustic cavitation process (the formation, growth, and implosive collapse of bubbles in a liquid). At the initial state (0 min), primary nanoparticles appeared and tended to aggregate into soft nanoparticle clusters in order to reduce each other's surface energy. With the ultrasonic time at 1 min, CaWO4 microspheres were assembled by unstable nanoparticle cluster orientation. As seen, each microsphere consisted of numerous tightly packed nanospheres resulting in rough surfaces. It is known that collapsing bubbles create OH˙ and H˙ radical species via the sonolysis of water in an aqueous solution, and preferably yield formation of H2O2, H2O etc. From previous observation,19 hydroxyl groups (–OH) were produced from radical species that prefer to react with oxygen ions, and also, H2O2 was likely to decompose on the surface of metal oxide particles. These hydroxyl groups on the surface of CaWO4 nanoparticles promote self-attachment between unstable nanoparticles, thus resulting in aggregation of single microspheres on a surface consisting of nanospheres. This study considered that high-intensity ultrasound irradiation also plays an important role in the formation of products leading to the microspherization process.20,21 The result of this study is similar to that of Xu et al.,21,23 in which prepared polysaccharide-based and chitosan microspheres used the single-step sonochemical method. However, the morphology of CaWO4 in this work was quite different from that reported by Yang et al.22 The difference in morphology might be attributed to varied synthesis parameters such as ultrasonic frequency, pH value and ultrasonication mode.22 At 5 min sonication time, stable monodispersed microspheres would steadily aggregate in mostly narrow particle size distribution. The diameter of these particles became larger simultaneously to an unsurpassable critical size limit, of which the microsphere particles in this work were about 11.20 ± 1.07 μm. The critical size limit of these particles strongly depends on many factors such as ultrasonic frequency, velocity of interparticle collisions and shock waves generated by cavitation in liquids irradiated with ultrasound.24 These shock waves can induce physical effect, especially by increasing mass transport. Shock waves through the microsphere particles can expedite and drive microparticles suspended in liquid into one another, and the impact velocity of these collisions between particles can be estimated at around one hundred meters per second.23 This physical effect causes changes in surface composition, distribution of particle size and particle morphology.23 Additionally, a short-lived localized hot-spot that produces enormous volumes of temperature at ∼5000 K, pressure of ∼1000 atm and heating and cooling rates of >1010 K s−1 can be generated during cavitations.24,25 As a result, necking occurred at 15 min between microsphere particles, which was similar to the initial stage of the solid-state sintering process. It is believed that this heat energy occurrence can make surface diffusion, as the melting point started from the surface area of nanoparticles on the microsphere particles. Surface diffusion is a typical mass transport in the sintering mechanism that produces surface smoothing, particle joining, grain boundary formation, neck growth, and pore rounding.26,27 However, volume shrinkage and densification was not found, due to the sonochemical method generating local thermal energy, which is different from thermal energy of the sintering process. When increasing the sonication time to 30 min, the necking and unsmooth surface broke into a large number of particle scraps, with no single monodispered microspheres. As a result, impact from high speed microjets on the surface led to the phenomena of morphological transformations, including particles breaking and erosion of material.23,28 Furthermore, the average particle sizes, as a function of ultrasonic irradiation time, are plotted in Fig. 8. Increasing time gradually increases microsphere particles to an average size of 11.20 ± 1.07 μm and narrow standard deviation at 5 min, which is suitable for producing uniformed spherical morphology. A broad size deviation was observed as the time increased to 15 and 30 min, due to difficulty in finding the particle sizes after necking and microsphere breakage. Based on the results obtained at different ultrasonic times, formation of the monodispersed CaWO4 microsphere can be controlled easily by only one single parameter in a simple sonochemical process.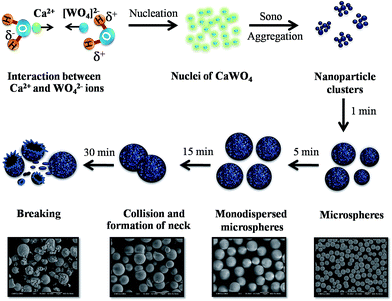 | ||
| Fig. 7 Schematic illustration of the growth process of monodispersed CaWO4 microspheres via the sonochemical process of ultrasonic irradiation time-dependent experiments. | ||
Conclusion
Nearly monodispersed CaWO4 microspheres were accomplished via the sonochemical process by using deionized (DI) water as intermediate solvent at an ultrasonic irradiation time of 5 min. XRD results exhibited CaWO4 powders as a tetragonal scheelite structure. SEM images showed the morphology as monodispersed CaWO4 microspheres of 11.20 ± 1.07 μm. The growth mechanism was performed carefully by brief ultrasonic time-dependence. The fluorescence spectra of CaWO4 microspheres obtained a blue light that was emitted at a wavelength of around 420 nm. The Eg values obtained results of the absorbance spectrum at 3.32–3.36 eV. This synthesized method for monodispersed CaWO4 microspheres presents advantages such as uncomplicated steps, low energy consumption, high purity, time-saving and suitable application.Acknowledgements
This work was supported by the Thailand Research Fund (TRF) under Grant no. BRG5680006. The authors would like to thank Dr. Jakrapong Kaewkhao for the support of Photoluminescence measurement.References
- L. Sun, M. Cao, Y. Wang, G. Sun and C. Hu, J. Cryst. Growth, 2006, 289, 231–235 CrossRef CAS PubMed.
- J. Liu, Q. Wu and Y. Ding, J. Cryst. Growth, 2005, 279, 410–414 CrossRef CAS PubMed.
- T. Thongtem, S. Kungwankunakorn, B. Kuntalue, A. Phuruangrat and S. Thongtem, J. Alloys Compd., 2010, 506, 475–481 CrossRef CAS PubMed.
- Y. Tian, Y. Liu, R. Hua, L. Na and B. Chen, Mater. Res. Bull., 2012, 47, 59–62 CrossRef CAS PubMed.
- Y. Wang, J. Ma, J. Tao, X. Zhu, J. Zhou, Z. Zhao, L. Xie and H. Tian, Mater. Lett., 2006, 60, 291–293 CrossRef CAS PubMed.
- S. J. Chen, J. Li, X. T. Chen, J.-M. Hong, Z. Xue and X.-Z. You, J. Cryst. Growth, 2003, 253, 361–365 CrossRef CAS.
- P. Parhi, T. N. Karthik and V. Manivannan, J. Alloys Compd., 2008, 465, 380–386 CrossRef CAS PubMed.
- H. Pan, M. Hojamberdiev and G. Zhu, J. Mater. Sci., 2012, 47, 746–753 CrossRef CAS.
- Q. Zhang, W. T. Yao, X. Chen, L. Zhu, Y. Fu, G. Zhang, L. Sheng and S. H. Yu, Cryst. Growth Des., 2007, 7, 1423–1431 CAS.
- G. Jia, D. Dong, C. Song, L. Li, C. Huang and C. Zhang, Mater. Lett., 2014, 120, 251–254 CrossRef CAS PubMed.
- J. Geng, J. J. Zhu and H. Y. Chen, Cryst. Growth Des., 2006, 6, 321–326 CAS.
- J. E. Post and D. L. Bish, Am. Mineral., 1993, 78, 932–940 Search PubMed.
- S. Vidya, S. Solomon and J. K. Thomas, J. Electron. Mater., 2013, 42, 129–137 CrossRef CAS.
- J. C. Sczancoski, L. S. Cavalcante, M. R. Joya, J. W. M. Espinosa, P. S. Pizani, J. A. Varela and E. Longo, J. Colloid Interface Sci., 2009, 330, 227–236 CrossRef CAS PubMed.
- L. S. Cavalcante, J. C. Sczancoski, J. W. M. Espinosa, J. A. Varela, P. S. Pizani and E. Longo, J. Alloys Compd., 2009, 474, 195–200 CrossRef CAS PubMed.
- J. Liao, B. Qiu, H. Wen and W. You, Opt. Mater., 2009, 31, 1513–1516 CrossRef CAS PubMed.
- J. C. Sezancoski, M. D. R. Bomio, L. S. Cavalcante, M. R. Joya, P. S. Pizani, J. A. Varela, E. Longo, M. S. Li and J. A. Andrés, J. Phys. Chem. C, 2009, 113, 5812–5822 Search PubMed.
- M. J. Weber and W. M. Yen, Inorganic phosphors: Compositions, Preparation, and Optical Properties, 1932, p 194 Search PubMed.
- S. J. Chang, W. S. Liao, C. J. Ciou, J. T. Lee and C. C. Li, J. Colloid Interface Sci., 2009, 329, 300–305 CrossRef CAS PubMed.
- N. Skirtenko, T. Tzanov, A. Gedanken and S. Rahimipour, Chem.–Eur. J., 2010, 16, 562–567 CrossRef CAS PubMed.
- R. Silva, H. Ferreira and A. Cavaco-Paulo, Biomacromolecules, 2011, 12, 3353–3368 CrossRef CAS PubMed.
- L. Yang, Y. Wang, Y. Wang, X. Wang and G. Han, Adv. Powder Technol., 2013, 24, 721–726 CrossRef CAS PubMed.
- X. Hangxun, B. W. Zeiger and K. S. Suslick, Chem. Soc. Rev., 2013, 42, 2555–2567 RSC.
- K. S. Suslick and S. J. Docktycz, Adv. Sonochem., 1990, 1, 197–230 CAS.
- K. S. Suslick, Sci. Am., 1989, 80–86 CrossRef CAS PubMed.
- J. S. Reed, Principles of ceramics processing, A Wiley-Interscience Publication, 1995, pp. 594–606 Search PubMed.
- S.-J. L. Kang, Sintering: Densification, Grain Growth, and Microstructure, 2005 Search PubMed.
- L. Zhang, V. Belova, H. Wang, W. Dong and H. Möhwald, Chem. Mater., 2014, 26, 2244–2248 CrossRef CAS.
| This journal is © The Royal Society of Chemistry 2015 |

