Removal of cadmium and lead from aqueous solutions using nitrilotriacetic acid anhydride modified ligno-cellulosic material

Yuanqing Huangac, Chunping Yang*abc, Zhichao Sunac, Guangming Zengac and Huijun Heac
aCollege of Environmental Science and Engineering, Hunan University, Changsha 410082, P. R. China. E-mail: yangc@hnu.edu.cn
bZhejiang Provincial Key Laboratory of Solid Waste Treatment and Recycling, College of Environmental Science and Engineering, Zhejiang Gongshang University, Hangzhou, Zhejiang 310012, P. R. China
cKey Laboratory of Environmental Biology and Pollution Control (Hunan University), Ministry of Education, Changsha 410082, P. R. China

Received 19th November 2014 , Accepted 12th January 2015

First published on 12th January 2015


Abstract

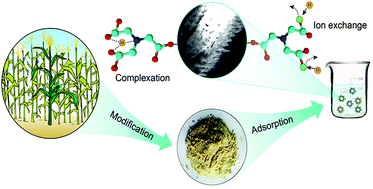
Cadmium (Cd2+) and lead (Pb2+) posed severe health risks worldwide. To remove these contaminants from aqueous solution, a nitrilotriacetic acid anhydride (NTAA) modified ligno-cellulosic material (NTAA-LCM) was prepared and characterized. Batch sorption experiments were performed to evaluate the influences of various factors such as contact time, pH, ionic strength, temperature and initial metal concentration on the sorption of metals. Results from elemental analysis and FTIR suggested that ester bonds and amine groups were successfully introduced into NTAA-LCM. Fast adsorption rates were observed, and the maximum sorption capacities of NTAA-LCM for Cd2+ and Pb2+ reached 143.4 and 303.5 mg g−1 at 298 K, respectively. Both the pseudo-second-order model and the Langmuir model described the adsorption extremely well. Thermodynamic analysis showed that the sorption was endothermic but spontaneous. The sorption was a chemical process involving surface chelation and ion exchange; this was reflected in the metal/NTA ratio. Additionally, NTAA-LCM retained high metal sorption capacity after seven cycles of regeneration by HNO3.
1 Introduction

Heavy metal pollution inflicts adverse effects on organisms and humans and is considered a global environmental issue.1 Heavy metals such as cadmium (Cd2+) and lead (Pb2+) are among the most common pollutants found in industrial effluents. Conventional methods employed for the removal of heavy metals from effluents mainly include chemical precipitation, ion exchange, membrane separation, reverse osmosis, and electrolysis. Most of these methods are costly or ineffective. Adsorption is considered to be one of the most convenient and cost-efficient methods.2–5 Activated carbon,6,7 clay minerals,8 synthetic inorganic materials,9 synthetic nano-particles10 and others have been utilized as adsorbents.11 Most of these methods are costly, ineffective, or both. Thus, novel adsorbents with high adsorption capacity, abundant availability are increasingly needed for the removal of heavy metals.

Recently, natural materials have attracted increasing attention as adsorbents for heavy metals because of their renewable and biodegradable properties. For example, wheat straw has been treated with citric acid to remove copper ion,12 and biodegradable chitosan-coated sand has been developed for removal of Cu(II) and Pb(II) in aqueous solution.13 Surface modification with anhydrides received great interest for its fast kinetics, high adsorption capacity and chemical stability among various modification methods.5,14 This kind of modification introduces carboxylic acid functional groups by esterification reaction. Succinic, maleic, phtalic, EDTA, and DTPA are examples of cyclic anhydrides that have been used for modification of ligno-cellulosic materials.5,14–16

Corn is one of the largest grain crops in the world, especially in China and USA. As one of the common agricultural residues, cornstalk was usually burnt directly in the field without effective utilization, which causes serious air pollution. However, these residues have been proved to be potential adsorbents in the treatment of pollutants.15,17–20 The main components of cornstalk are cellulose (38.92%), hemicellulose (20.87%), and lignin (21.52%).21 Cellulose has primary and secondary hydroxyl groups, and lignin has hydroxyl phenolic groups. Therefore, ligno-cellulosic materials such as cornstalk can, through their hydroxyl functions, react chemically and produce new materials with novel properties. To date, there have been several studies reported on the preparation of cornstalk materials with different modifiers. For example, in Zheng's work, the maximum adsorption capacity of acrylonitrile-modified cornstalk for Cd(II) was three times higher than that of the unmodified cornstalk.19 However, until now, there is no study with respect to the removal of heavy metals with the utilization of chelator modified cornstalk material. Nitrilotriacetic acid (NTA) is a powerful chelating agent with three carboxyl groups, which has shown excellent metal binding properties. As a low-cost and biodegradable chelating agent which was primarily reported as magnetic nanoparticles modifier to anchor proteins,22–24 NTA can be used to synthesize NTA anhydride (NTAA) and further modify ligno-cellulosic materials.25 Additionally, NTAA is a liquid anhydride which can thoroughly react with the material, and the use of NTAA as a modifier, which to the best of our knowledge, is reported for the first time.

Therefore, the NTAA-modified cornstalk has the potential to be an excellent novel material because it is inexpensive and biodegradable in comparison to other chelating materials. In this study, dewaxed cornstalk (LCM) was chemically modified with NTAA, and the characteristics of the novel material were analyzed. Also, the adsorption behavior of NTAA-LCM for Cd2+ and Pb2+ from aqueous solutions was evaluated by batch tests, and the interaction mechanisms between metals and NTAA-LCM were explored.

2 Materials and methods

2.1 Materials

The cornstalk was collected from Hunan Province, Southeast China. NTA, acetic anhydride, pyridine and N,N′-dimethylformamide (DMF) were purchased from Aladdin Shanghai/China and used without further purification. Sodium hydroxide (NaOH), acetone, sodium hydrogen carbonate (NaHCO3), 95% ethanol, n-hexane, Cd(NO3)2·4H2O, Pb(NO3)2 and nitric acid were of analytical reagent grade and purchased from Kermel Tianjin/China. Milli-Q ultrapure water (18.2 MΩ cm) was used throughout the study.

2.2 Preparation of LCM

After being cut to 2–4 cm, the cornstalk was washed with ultrapure water, dried at 80 °C in an oven for approximately 24 h, and then the cornstalk was milled through a 60-mesh sieve. Then, 10 g of dried powder was washed in a Soxhlet apparatus with 60 mL of n-hexane at 50 °C for 4 h and then dried at 80 °C in an oven and stored in a desiccator prior to use. The obtained material was LCM.

2.3 Synthesis of NTAA and NTAA-LCM

In order to improve the synthesis yield of NTAA-LCM, we optimized the modification time and the LCM/NTA ratio by two steps.

Step 1: effect of modification time.

6 mL of pyridine, 6 mL of DMF, and 4 g of NTA were placed in a 150 mL Erlenmeyer flask, and then 6 mL of acetic anhydride was added dropwise. The mixtures were agitated strongly at 65 °C for 24 h and NTAA was obtained.25,26 Then 500 mg of LCM and 6 mL of DMF were added to the mixture solution containing NTAA, and the suspension was shaken and heated at 75 °C for 20 h.

The same procedure was carried up for reaction times of 10 and 30 h. After filtration, the obtained new material were washed with acetic anhydride, DMF, deionized water, saturated sodium bicarbonate solution, deionized water, ethanol 95%, acetone, and then dried in an vacuum at 80 °C for 2 h and left to cool in a desiccator. After cooling, the mass percent gains were calculated.

Step 2: effect of the LCM/NTA ratio.

3 mL of pyridine, 3 mL of DMF, and 2 g of NTA were placed in a 150 mL Erlenmeyer flask, and then 3 mL of acetic anhydride was added dropwise. The mixtures were agitated strongly at 65 °C for 24 h. Then 500 mg of LCM and 3 mL of DMF were added to the mixture solution, and the suspension was shaken and heated at 75 °C for 20 h.

The same procedure was carried out at constant anhydride/solvent ratio. The amounts of NTA and volumes of each organic reagent were 3 g/4.5 mL, 4 g/6 mL, and 6 g/9 mL, respectively. After modification, the materials were treated as described above, and the mass percent gain were also calculated. Air was isolated with plastic wraps during each shock process to prevent water from entering into the flasks.

2.4 Characterization of NTAA-LCM

NTAA-LCM was characterized by weight gain, elemental analysis, FTIR and EDAX. Elemental content was analyzed by an Elementar Vario ELIII elemental analyzer with ± 0.3% accuracy (Germany). The Fourier transform infrared spectrophotometer (Nico-let, Nexus-670 FTIR) spectra of the materials were recorded in the range of 4000–800 cm−1. Energy-dispersive X-ray analysis (EDAX) of the materials were conducted by an FEI Quanta 200 environmental scanning electron microscope coupled with EDAX genesis xm-2 EDS. Nitrogen adsorption measurements at 77 K were performed using an TRISTAR II 3020 V1.03 volumetric adsorption analyzer. BET analyzes were used to determine the surface area.

2.5 Adsorption experiments

2.5.1 Adsorption kinetics. Metal ion adsorption capacities were investigated as a function of time to determine the adsorption equilibrium time. The equilibrium time was one of the parameters for economical wastewater treatment plant applications. 50 mg of NTAA-LCM were placed in 150 mL Erlenmeyer flasks containing 50 mL of 200 mg L−1 Cd2+ or Pb2+ solution. The experiments were done at pH 4.0 for Cd2+ and 3.8 for Pb2+ by adding dilute HNO3 or NaOH. The flasks were shaken at constant speed (150 rpm) at 25 °C, and the time intervals used were from 1 to 120 min. At each adsorption time, samples were subjected to centrifugation at 4000 rpm for 10 min and the suspensions were filtered, diluted, and measured using atomic absorption spectroscopy (Analyst 700, Perkin Elmer, USA). All adsorption experiments were performed in duplicate, and the relative errors were about 5%. The amount of metals adsorbed by NTAA-LCM in the period of time was calculated using the following equation.
 
image file: c4ra14859b-t1.tif(1)
where qt (mg g−1) is the amount of metal ion adsorbed on the NTAA-LCM at any time, m (g) is the dry weight of NTAA-LCM, V (mL) is the volume of metal solution, C0 (mg L−1) is the initial metal concentration. When t equals to the equilibrium contact time, qt represents the amount of metal ion adsorbed at equilibrium.
2.5.2 Effects of pH and ionic strength on metals adsorption. The effects of pH and ionic strength on metals adsorption was studied by a series of experiments at varying concentrations of CaCl2 solutions. 50 mg of NTAA-LCM were added to 150 mL Erlenmeyer flasks containing 50 mL of 200.0 mg L−1 Cd2+ or Pb2+ solution with various concentrations of CaCl2. Solubility product constants (7.2 × 10⁻¹⁵ for Cd(OH)2 and 1.43 × 10⁻²⁰ for Pb(OH)2) and concentrations of Cd2+ and Pb2+ were used to calculate the maximum pH where these ions may not occur as hydrolyzed species.14 Calculated maximum pH for Cd2+ and Pb2+ were 8.3 and 5.5, respectively. This procedure was necessary to ensure that only Cd2+ or Pb2+ would be adsorbed. The pH value was adjusted to 2.0–8.0 and 1.0–6.0 for Cd2+ and Pb2+, respectively. The flasks were shaken at constant speed (150 rpm) at 25 °C for 60 min. After filtration and diluted, the metal ion concentration was determined using atomic absorption spectroscopy (Analyst 700, Perkin Elmer, USA).
2.5.3 Adsorption isotherms of NTAA-LCM. To evaluate the effect of initial metal ion concentration on the adsorption of metals onto NTAA-LCM, 50 mg each material were added to 150 mL Erlenmeyer flasks with 50 mL of metal ion solution at specific concentration (from 20 to 500 mg L−1 for Cd2+, and from 20 to 600 mg L−1 for Pb2+). The flasks were agitated at 150 rpm for 60 min (pH = 4.0) at different temperatures (298, 303, and 313 K). The metal ion concentration was determined using atomic absorption spectroscopy (Analyst 700, Perkin Elmer, USA).

2.6 Regeneration studies

To evaluate the reusability, regeneration of NTAA-LCM was studied. 1 g of adsorbent was loaded by 100 mL of 200 mg L−1 Cd2+ or Pb2+ solution. After attaining equilibrium, the exhausted adsorbent was centrifuged and filtered. Then metal ions were eluted by 200 mL of 1.0 M HNO3 solution at contact time of 60 min. After desorption, adsorbent was then rinsed twice with distilled water and was reemployed in metal ion removal. This adsorption/desorption cycle was repeated 7 times to test the reusability of the adsorbent. The regeneration efficiency (RE) of the material was calculated as follows:
 
image file: c4ra14859b-t2.tif(2)
where q0 and qn (mg g−1) are the adsorption capacities of the material before and after regeneration, respectively.

3 Results and discussion

3.1 Synthesis of NTAA-LCM

Fig. 1 illustrated the synthesis route used to prepare NTAA-LCM and a suggested mechanism for Cd2+ or Pb2+ adsorbed to NTAA-LCM. Before the modification, the powdered cornstalk sample was washed thoroughly with n-hexane to remove the hydrophobic botanic wax on the surface.27 Treatment with n-hexane and modification with NTAA improved the hydrophilicity of the adsorbent, so the adsorbent could fully contact with heavy metals in the adsorption process. Additionally, the dewaxing process exposed the functional groups such as phenolic, hydroxyl, carboxyl, benzyl alcohol, methoxyl, and aldehyde groups.2 As shown in Fig. 1, pyridine was used as an activating agent to introduce NTA through formation of an interval carboxylic acid anhydride. NTAA molecular could be broken by DMF, and then could react with hydroxyl groups of LCM.14 Saturated NaHCO3 solution was used to convert the carboxylic group into carboxylate function for a better chelating function.
image file: c4ra14859b-f1.tif
Fig. 1 Synthesis route of NTAA-LCM.

The mass percent gain (mpg) was calculated using the following equation.

 
image file: c4ra14859b-t3.tif(3)
where mb (mg) and mf (mg) are masses of the adsorbent before and after the modification, respectively.

The effect of modification time was evaluated to verify the minimum reaction time necessary to introduce the defined amount of NTA into NTAA-LCM. For this, time intervals of 10, 20, and 30 h were used. The mass percent gains were calculated and used to evaluate the synthesis yield. The obtained results were shown in Table 1. As shown in Table 1, the largest mass percent gain (28.3%) was obtained at the reaction time of 20 h. Between 20 and 30 h a mass percent loss was noticed. This result was possible due to crosslink reaction between the carboxyl function of NTA and non-esterified hydroxyl groups from LCM.14

Table 1 Effect of reaction time and the amount of NTA on the mass percent gain of NTAA-LCM
Synthesized material Reaction time (h) NTA (g) mpg (%)
NTAA-LCM 10 4 24.5
0.5 g 30   26.3
  20   28.3
    2 20.4
    3 26.9
    4 28.3
    6 28.3


The effect of NTA amount was evaluated to determine the minimum amount of NTA necessary to obtain the largest mass percent gain at the reaction time of 20 h. In order to perform the study, NTA amounts of 2, 3, 4, and 6 g were chosen with fixed NTA/solvent ratio which can be seen from the Section 2.3. The NTA/solvent ratio is considered to be a very important variable and its variation may affect the synthesis yield. As shown in Table 1, the mass percent gain reached a plateau when at least 4 g NTA was used in the modification of LCM. In this reaction condition the mpg was found to be 28.3%. Therefore, the optimized reaction condition was prepared by using 4 g NTA and reaction time of 20 h.

3.2 Characterization of NTAA-LCM

A quantitative analysis of carbon, hydrogen, and nitrogen was performed by an elemental analyzer for the unmodified and best obtained material. The NTA-groups on NTAA-LCM was calculated from the difference of nitrogen content in LCM (1.015%), NTAA-LCM (1.975%) and NTA (7.320%) by the following equation:1
 
WNTAA-LCM = WNTA × NTA% + WLCM(1 − NTA%) (4)
where WNTAA-LCM, WNTA, and WLCM are the nitrogen content of NTAA-LCM, NTA, and LCM, respectively; NTA% is the content of the NTA groups in NTAA-LCM. The calculated result showed that the content of the NTA groups in the modified material was 15.23%, i.e., 152.3 mg (0.797 mmol) of NTA was present in 1 g of the resultant NTAA-LCM. The calculated content of NTA in the material was 0.797 mmol g−1 (Table 2).
Table 2 Results of elemental analysis for dewaxed cornstalk before and after NTAA-modification
Sample Elemental content (wt%) NTA% (wt%) Loading of NTA (mmol g−1)
C H N
LCM 45.79 7.029 1.015 0 0
NTAA-LCM 43.34 6.107 1.975 15.23 0.797


The spectra of LCM, NTAA-LCM and NTAA-LCM-Cd were shown in Fig. 2. A strong band at 1734 cm−1 appeared in the spectrum of NTAA-LCM. The new peak indicated that ester bond and carboxyl were introduced into NTAA-LCM after modification with NTAA,5 which corresponded to the elemental analysis results. The peak at 1734 cm−1 in the spectrum of NTAA-LCM-Cd was much weaker than that of NTAA-LCM, which could be explained by the fact that carboxyl groups and heavy metals participated in the chelating reaction.28 The bands at 3455 and 1061 cm−1 were characteristics of cellulose or hemi-cellulose.5 The peaks at 1642 and 897 cm−1 were indicative of hemicelluloses,29 whereas the peak at 1421 cm−1 was attributed to asymmetric and symmetric axial deformations of carboxylate ions.16


image file: c4ra14859b-f2.tif
Fig. 2 FTIR spectra of LCM, NTAA-LCM and NTAA-LCM-Cd.

The energy dispersive X-ray analysis (EDXA) spectra of NTAA-LCM before and after interaction with Cd2+ or Pb2+ were shown in Fig. 3. The spectra showed the presence of various elements and their atom weight percentage. The major elements present in NTAA-LCM were C, O, Na+, N, Si, respectively (Fig. 3a). The interaction between NTAA-LCM with Cd2+ (Pb2+) was depicted in Fig. 3b (Fig. 3c), indicating that metals reacted with carboxyl groups of NTAA-LCM. Na+ was replaced by Cd2+ or Pb2+ after adsorption, suggesting that adsorption took place by surface chelation and ion exchange.


image file: c4ra14859b-f3.tif
Fig. 3 EDAX spectra of (a) NTAA-LCM before metal adsorption; (b) NTAA-LCM after Cd2+ adsorption; (c) NTAA-LCM after Pb2+ adsorption.

Nitrogen adsorption/desorption isotherms were recorded to investigate the surface and pore texture of the materials. The isotherm curve of NTAA-LCM showed an unclosed hysteresis loop in the P/P0 range 0.05–0.2, indicating that the shape and size of pores of the present material was uneven. This unevenness was further supported by several pore size distributions centers. New peaks were not founded after LCM modified with NTA (Fig. 4). The BET surface areas of NTAA-LCM and LCM were 1.8006 and 2.4470 m2 g−1, respectively. And the pore sizes of NTAA-LCM and LCM were 8.9278 and 11.7910 nm, respectively. The decrease of BET surface area and pore size might attribute to the introduction of NTA groups.


image file: c4ra14859b-f4.tif
Fig. 4 Nitrogen adsorption/desorption isotherms and pore size distribution of LCM and NTAA-LCM.

3.3 Adsorption kinetics

Adsorption experiments were performed to investigate the effect of contact time on metal ion uptake and determine adsorption equilibrium time for NTAA-LCM. Fig. 5 showed the adsorption kinetics of Cd2+ and Pb2+ on the modified material. It could be observed that the adsorption equilibrium was reached within 5 min for Cd2+ and Pb2+ (Fig. 5a). Therefore, the time was set to 60 min for pH and concentration-dependent experiments. During the first minute, the adsorption of Cd2+ and Pb2+ sharply increased, with more than 95% of the total ions being adsorbed by NTAA-LCM. The adsorption amounts of Cd2+ and Pb2+ were 98.80 and 159.91 mg g−1, respectively.
image file: c4ra14859b-f5.tif
Fig. 5 Adsorption of Cd2+ and Pb2+ by NTAA-LCM as a function of time (a); pseudo-second-order adsorption kinetics of Cd2+ and Pb2+ (b). Reaction conditions: 200 mg L−1 Cd2+ and Pb2+ solution, NTAA-LCM dosage = 1 g L−1 at 25 °C, pH 4.0 for Cd2+ and 3.8 for Pb2+, respectively.

The pseudo-second-order model, based on the assumption that the rate-limiting step might be chemical sorption or chemisorption involving valency forces,30 was applied to get further insights into the mechanisms of sorption reactions. Kinetic data were calculated with the following equation:

 
image file: c4ra14859b-t4.tif(5)
 
h = kqe2 (6)
where qt (mg g−1) is the adsorption amount at time t (min), qe (mg g−1) is the calculated value of the adsorption at equilibrium, k (g mg−1 min−1) is the rate constant of pseudo-second-order, h (mg g−1 min−1) is the initial sorption rate.

The value of k, qe, and h could be calculated from the slope and the intercept of the straight line (Fig. 5b), and the values were listed in Table 3. The results showed that the calculated qe was equal to the experimental value of adsorption capacity (q), demonstrating that pseudo-second-order model fitted perfectly the experimental data. Therefore, the adsorption of Cd2+ and Pb2+ by NTAA-LCM was a chemical process.5,31 The initial adsorption rate of Cd2+ and Pb2+ were 684.0 and 699.3 mg g−1 min−1, respectively, suggesting an initial fast adsorption. The k values for Cd2+ and Pb2+ adsorption were calculated to be 0.0701 and 0.0275 k g mg−1 min−1, respectively. The low value of rate constant (k) suggested that the adsorption rate decreased with the increase in time and the adsorption rate was proportional to the number of unoccupied sites.

Table 3 Pseudo-second-order kinetic and intra-particle diffusion constants for the adsorption of ions by NTAA-LCM
Ions Pseudo-second-order model Intra-particle diffusion model
k (g mg−1 min−1) qe (mg g−1) q (mg g−1) h (mg g−1 min−1) R2 ki (mg g−1 min−1/2) L (mg g−1) R2
Cd2+ 0.0701 98.81 98.80 684.0 1 0.6544 152.89 0.931
Pb2+ 0.0275 159.49 159.91 699.3 0.999 0.3701 95.75 0.938


Because the above equation could not give definite mechanism, the intra-particle diffusion model was tested. Weber and Morris32 indicated that the fraction of solute adsorbed can be expressed in terms of the square root of time. A plot of fraction of solute absorbed against t1/2 may be used to estimate the intra-particle diffusion rate in the linear range. The equation was listed as follows:

 
qt = kit0.5 + L (7)
where ki (mg g−1 min−1/2) is the intra-particle diffusion rate constant and L (mg g−1) is a constant related with the thickness of boundary layer. As shown in Fig. 6, the relationship between qt and t0.5 was linear over the whole time range, but the linear plots did not pass through the origin, which indicated that intra-particle diffusion may not be the controlling factor in determining the kinetics of the process.32 The ki values for Cd2+ and Pb2+ adsorption were calculated to be 0.6544 and 0.3701 mg g−1 min−1/2, respectively. These results indicated that the adsorption took place in two stages: a very rapid surface adsorption and slow intra-particle diffusion.


image file: c4ra14859b-f6.tif
Fig. 6 Linear fit of experimental data for intra-particle diffusion model.

3.4 Effects of pH and ionic strength on metals adsorption

Solution pH was one of the most important variables affecting the adsorption process due to the pH affected the aqueous chemistry and surface binding-sites of the adsorbent. It was also well known that industrial wastewater contained not only pollutants but also high concentrations of salts, which might affect the removal of pollutants. The effects of pH and ionic strength on Cd2+ or Pb2+ uptake were investigated by conducting batch experiments at different concentrations of CaCl2, and the results were shown in Fig. 7. The solution pH influenced on the adsorption because it affected the activity of functional groups (carboxyl, amine groups), as well as the competition of metal ions for the free binding sites. The adsorption of Cd2+ or Pb2+ on NTAA-LCM increased slowly with the increased pH in the absence and presence of CaCl2. At lower pH values, functional groups of NTAA-LCM were closely associated with hydronium ions (H3O+) and restricted the approach of metals as a result of the repulsive force. While the pH increased, the adsorption surface became deprotonated, thus increasing the amount of metals adsorbed.14 Over the pH range from 6.5 to 1.5, the adsorption capacities for Cd2+ and Pb2+ decreased slowly from 103.2 and 157.3 mg g−1 to 85.5 and 143.0 mg g−1 in the absence CaCl2, respectively. Most published literatures had reported that the adsorption of metal ions changed greatly at various pHs.15,33 Compared with these results, the adsorption capacity of NTAA-LCM was changed little over the pH range from 6.5 to 1.5, which indicating that the complex between metal ions and the carboxyl and amine groups of the adsorbent was stable.16 And the advantage of NTAA-LCM material was that NTAA-LCM could be promising in the elimination of heavy metals from acidic or neutral wastewater. However, the increases in the concentrations of CaCl2 from 0 to 0.01 mol L−1 resulted in a significant decrease of the Cd2+ or Pb2+ adsorption onto NTAA-LCM, which might be attributed to the following reasons: (i) the ionic strength of solution influenced the activity coefficient of Cd2+ or Pb2+, which limited their transfer to the NTAA-LCM surface;34 (ii) competition of Ca2+ with the Cd2+ or Pb2+ for adsorption sites of NTAA-LCM resulted in the observed decrease in the uptake capacities with increasing CaCl2 concentration. Rosenberg and his coworkers35 have reported that NTA anhydride modified silica polyamine composite materials (BP-NT and WP-NT) had the ability to remove divalent metals from low pH aqueous solutions, and the selectivity for metals was Cu2+ > Ni2+ > Zn2+ > Co2+. These results were consistent with our reports of NTAA-LCM.
image file: c4ra14859b-f7.tif
Fig. 7 Effects of pH and ionic strength on metals adsorption. Reaction conditions: 200 mg L−1 Cd2+ and Pb2+ solution, NTAA-LCM dosage = 1 g L−1 at 25 °C, within 60 min, C0(CaCl2) = 0, 0.001, and 0.01 M.

3.5 Adsorption isotherms

The Langmuir model (L type, based on monolayer adsorption of solute, eqn (8)) and the Freundlich model (F type, developed for heterogeneous surfaces, eqn (10)) are widely used in literatures.36 These two models were used to evaluate the adsorption capacity of the modified and unmodified material for Cd2+ and Pb2+ (Fig. 8). The contact time used was 60 min. The adsorption studies were conducted at pH 4.0 for Cd2+ and 3.8 for Pb2+, respectively. The initial concentration of metal ions were from 20 to 500 mg L−1 for Cd2+ and 20 to 600 mg L−1 for Pb2+, respectively.
 
image file: c4ra14859b-t5.tif(8)
 
image file: c4ra14859b-t6.tif(9)
where qm (mg g−1) is the maximum adsorption capacity, b (L mg−1) is a Langmuir constant related to the bond energy of the sorption reaction between metal ions and adsorbents, and qe (mg g−1) is the equilibrium adsorption capacity. RL is the equilibrium parameter which can be applied to predict whether the adsorption is favorable.
 
image file: c4ra14859b-t7.tif(10)
where Kf (L g−1) and n are Freundlich constants representing the adsorption capacity and the adsorption intensity, respectively.37

image file: c4ra14859b-f8.tif
Fig. 8 Adsorption isotherms for Cd2+ and Pb2+ onto NTAA-LCM at various temperatures. Reaction conditions: Cd2+ from 20 to 500 mg L−1, pH 4.0; Pb2+ from 20 to 600 mg L−1, pH 3.8; NTAA-LCM dosage = 1 g L−1 at 25 °C, within 60 min.

The relative parameters calculated from the Langmuir and Freundlich isotherm models were listed in Table 4. Adsorption isotherms were better fitted by the Langmuir model rather than the Freundlich model with relatively higher correlation coefficients, which suggested that metals sorption on NTAA-LCM was similar to monolayer adsorption.15 Generally, the isotherm-fitting between the experimental data and models was merely a mathematical model and could not provide any strong evidence of the actual sorption mechanism.15 Nonetheless, parameters such as qm, RL, and b were important to optimize sorption system design. The maximum adsorption capacities (qm) calculated by the Langmuir model were 143.4 and 303.5 mg g−1 for Cd2+ and Pb2+ at 298 K, respectively. Both b and qm increased with the increase of temperature, indicating that the bond energy between the surface sites and metal ions was larger at higher temperature and sorption on the modified material is promoted at higher temperature. Additionally, the adsorption was favorable at different temperatures with the value of RL range from 0.048 to 0.816 (Table 4). Compared with other cornstalk materials, NTAA-LCM exhibited better performance (Table 5). The adsorption mechanism of metals on NTAA-LCM might mainly include chelation and ion exchange. Simple calculations showed that the maximum adsorption capacities of NTAA-LCM reached 1.276 and 1.465 mmol g−1 for Cd2+ and Pb2+ at 298 K, respectively (Table 4), and the content of the NTA-groups introduced to the surface of NTAA-LCM was 0.797 mmol g−1 (Table 2). These results demonstrated that the ratio between the amount of Cd2+ (Pb2+) adsorbed and that of introduced NTA was 1.6[thin space (1/6-em)]:[thin space (1/6-em)]1 (1.8[thin space (1/6-em)]:[thin space (1/6-em)]1). As shown in Fig. 1, some metals were coordinated via 2 carboxyl groups and 1 amine nitrogen, and the others were adsorbed by carboxyl groups through ion exchange. These results demonstrated that NTAA-LCM, which has porous structure and high functional sites, was a promising adsorbent for the removal of metal ions from waste water.

Table 4 Isotherm constants for metal ions onto NTAA-LCM at various temperatures
Metal T (K) Langmuir model Freundlich model
qm (mg g−1) b (L mg−1) RL R2 Kf (L g−1) n R2
Cd2+ 298 143.44 0.011 0.151–0.816 0.998 8.540 2.221 0.967
303 151.71 0.016 0.111–0.758 0.999 12.573 2.458 0.952
313 162.99 0.024 0.076–0.673 0.995 19.649 2.815 0.956
Pb2+ 298 303.52 0.015 0.098–0.766 0.990 23.749 2.401 0.983
303 309.28 0.021 0.072–0.701 0.992 30.418 2.572 0.977
313 325.60 0.033 0.048–0.601 0.991 42.433 2.828 0.954


Table 5 Adsorption capacities of cornstalk modified by different methods
Adsorbent Modifying method Metal Qmax (mg g−1) Equilibrium time (min) Optimal pH Source
Maize Polyurethane Pb2+ 12.5 4.0 17
Corn stalk Acrylonitrile Cd2+ 12.73 7.0 19
Zea mays NaCl solution Cd2+ 62.96 200 4.0 20
Sponge   Pb2+ 65.82 100    
Maize stalk sponge Pb2+ 80.0 120 6.0 18
Corn stalk Nitrolotriacetic acid anhydride Cd2+ 143.4 5 5–7 In this study
Pb2+ 303.5   3.5–5.5  


3.6 Thermodynamic study

In our study, three important thermodynamic parameters, ΔG0, ΔH0, and ΔS0 were taken into account to determine the spontaneous nature of the processes. The Gibbs free energy ΔG0 can be calculated from the following equation:
 
ΔG0 = −RT[thin space (1/6-em)]ln[thin space (1/6-em)]K (11)
 
image file: c4ra14859b-t8.tif(12)
where R (8.314 J mol−1 K−1) and T (K) are the universal gas constant and the temperature in Kelvin, respectively. The sorption equilibrium constant K was calculated by plotting ln[thin space (1/6-em)]Kd versus Ce and extrapolating Ce to zero.38 As shown in Table 6, the negative ΔG0 values indicated that the sorption of Cd2+ and Pb2+ on NTAA-LCM was spontaneous under the experimental conditions. The decrease in ΔG0 with increasing temperature demonstrated more efficient sorption at higher temperatures. Additionally, enthalpy ΔH0, entropy ΔS0 were calculated by the following equation:
 
image file: c4ra14859b-t9.tif(13)
Table 6 Thermodynamic parameters for the adsorption of metal ions onto NTAA-LCM at various temperatures
Metal T (K) ΔG0 (kJ mol−1) ΔS0 (J mol−1 K−1) ΔH0 (kJ mol−1) R2
Cd2+ 298 −0.368 35.910 10.320 0.990
303 −0.582      
313 −0.913      
Pb2+ 298 −2.085 27.250 6.029 0.994
303 −2.237      
313 −2.497      


ΔH0 and ΔS0 could be calculated from the slope and intercept of ln[thin space (1/6-em)]K versus 1/T. The positive value of ΔH0 indicated that metals sorption on NTAA-LCM was an endothermic process. Meanwhile, the positive value of ΔS0 suggested an increased randomness during the adsorption process.

3.7 Regeneration studies

Regeneration experiment is necessary to evaluate the stability of the material and recover valuable metals from wastewater. Desorption was carried out with HNO3 solution and the process repeated 7 times. The results were shown in Fig. 9. The N content of NTAA-LCM remained relatively stable, suggesting that 1 M HNO3 had little influence on ester bond between LCM and NTA. HNO3 could effectively regenerate the adsorbent with regeneration efficiencies ranging from 85% to 99%. These results demonstrated that NTAA-LCM could be effectively regenerated by HNO3 solution. Rosenberg and his coworkers35 have also reported that BP-NT and WP-NT could be effectively regenerated by acid solution without evident amide bond hydrolysis.
image file: c4ra14859b-f9.tif
Fig. 9 Content of N (obtained from elemental analysis) and reusability efficiency of NTAA-LCM after 7 cycles of regeneration. Reaction conditions: 200 mg L−1 Cd2+ and Pb2+ solution, pH 4.0 for Cd2+ and 3.8 for Pb2+, NTAA-LCM dosage = 1 g L−1 at 25 °C, within 60 min.

4 Conclusions

A novel bio-adsorbent, NTAA-LCM, was successfully prepared through a simple procedure. This material exhibited fast adsorption for metals; the adsorption equilibrium was reached within 5 min for both Cd2+ and Pb2+. The maximum adsorption capacities of NTAA-LCM for Cd2+ and Pb2+ reached 143.4 and 303.5 mg g−1 at 298 K, respectively. Results from elemental analysis and the presence of a strong band at 1734 cm−1 in the spectrum of NTAA-LCM confirmed the introduction of NTA-groups into the cornstalk; specifically, 0.797 mmol g−1 of NTA was introduced. Competition of Ca2+ with the Cd2+ or Pb2+ for adsorption sites of NTAA-LCM resulted in the observed decrease in the uptake capacities with increasing CaCl2 concentration. The regeneration efficiency of NTAA-LCM remained relatively high after seven cycles of regeneration. On the whole, this cost-effective material could be promising in the elimination of heavy metals from acidic or neutral wastewater.

Acknowledgements

Financial support from the National Natural Science Foundation of China (Grant no. 51278464 and 51478172) is highly appreciated.

References

  1. F. Zhao, E. Repo, D. Yin and M. E. Sillanpaa, J. Colloid Interface Sci., 2013, 409, 174–182 CrossRef CAS PubMed.
  2. X. Guo, S. Zhang and X. Q. Shan, J. Hazard. Mater., 2008, 151, 134–142 CrossRef CAS PubMed.
  3. W. Wan Ngah and M. A. K. M. Hanafiah, Bioresour. Technol., 2008, 99, 3935–3948 CrossRef CAS PubMed.
  4. Q. Peng, Y. Liu, G. Zeng, W. Xu, C. Yang and J. Zhang, J. Hazard. Mater., 2010, 177, 676–682 CrossRef CAS PubMed.
  5. C. Duan, N. Zhao, X. Yu, X. Zhang and J. Xu, Cellulose, 2013, 20, 849–860 CrossRef CAS.
  6. J. A. Arcibar-Orozco, D.-B. Josue, J. C. Rios-Hurtado and J. R. Rangel-Mendez, Chem. Eng. J., 2014, 249, 201–209 CrossRef CAS PubMed.
  7. Z. Song, F. Lian, Z. Yu, L. Zhu, B. Xing and W. Qiu, Chem. Eng. J., 2014, 242, 36–42 CrossRef CAS PubMed.
  8. D. Ozdes, C. Duran and H. B. Senturk, J. Environ. Manage., 2011, 92, 3082–3090 CrossRef CAS PubMed.
  9. L. Tang, G. D. Yang, G. M. Zeng, Y. Cai, S. S. Li, Y. Y. Zhou, Y. Pang, Y. Y. Liu, Y. Zhang and B. Luna, Chem. Eng. J., 2014, 239, 114–122 CrossRef CAS PubMed.
  10. J. F. Liu, Z. S. Zhao and G. B. Jiang, Environ. Sci. Technol., 2008, 42, 6949–6954 CrossRef CAS.
  11. X. J. Tong, J. Y. Li, J. H. Yuan and R. K. Xu, Chem. Eng. J., 2011, 172, 828–834 CrossRef CAS PubMed.
  12. R. Han, L. Zhang, C. Song, M. Zhang, H. Zhu and L. Zhang, Carbohydr. Polym., 2010, 79, 1140–1149 CrossRef CAS PubMed.
  13. M. W. Wan, C. C. Kan, B. D. Rogel and M. L. P. Dalida, Carbohydr. Polym., 2010, 80, 891–899 CrossRef CAS PubMed.
  14. L. V. Gurgel and L. F. Gil, Water Res., 2009, 43, 4479–4488 CrossRef CAS PubMed.
  15. J. Wang and C. Chen, Biotechnol. Adv., 2006, 24, 427–451 CrossRef CAS PubMed.
  16. J. Yu, M. Tong, X. Sun and B. Li, Bioresour. Technol., 2008, 99, 2588–2593 CrossRef CAS PubMed.
  17. Y. Zhang and C. Banks, Water Res., 2006, 40, 788–798 CrossRef CAS PubMed.
  18. G. García-Rosales and A. Colín-Cruz, J. Environ. Manage., 2010, 91, 2079–2086 CrossRef PubMed.
  19. L. Zheng, Z. Dang, X. Yi and H. Zhang, J. Hazard. Mater., 2010, 176, 650–656 CrossRef CAS PubMed.
  20. G. García-Rosales, M. Olguin, A. Colín-Cruz and E. Romero-Guzmán, Environ. Sci. Pollut. Res., 2012, 19, 177–185 CrossRef PubMed.
  21. M. L. Zhang, Y. T. Fan, Y. Xing, C. M. Pan, G. S. Zhang and J. J. Lay, Biomass Bioenergy, 2007, 31, 250–254 CrossRef CAS PubMed.
  22. C. Xu, K. Xu, H. Gu, X. Zhong, Z. Guo, R. Zheng, X. Zhang and B. Xu, J. Am. Chem. Soc., 2004, 126, 3392–3393 CrossRef CAS PubMed.
  23. Y. C. Li, Y. S. Lin, P. J. Tsai, C. T. Chen, W. Y. Chen and Y. C. Chen, Anal. Chem., 2007, 79, 7519–7525 CrossRef CAS PubMed.
  24. H. Y. Xie, R. Zhen, B. Wang, Y. J. Feng, P. Chen and J. Hao, J. Phys. Chem. C, 2010, 114, 4825–4830 CAS.
  25. A. Capretta, R. B. Maharajh and R. A. Bell, Carbohydr. Res., 1995, 267, 49–63 CrossRef CAS.
  26. L. R. Chervu, B. Sundoro and M. D. Blaufox, J. Nucl. Med., 1984, 25, 1111–1115 CAS.
  27. P. D. Smith, G. W. Liesegang, R. L. Berger, G. Czerlinski and R. J. Podolsky, Anal. Biochem., 1984, 143, 188–195 CrossRef CAS.
  28. Y. Akama and T. Ueda, Cellul. Chem. Technol., 2013, 47, 479–486 CAS.
  29. L. Y. Mwaikambo and M. P. Ansell, J. Appl. Polym. Sci., 2002, 84, 2222–2234 CrossRef CAS.
  30. Y. S. Ho and G. McKay, Process Biochem., 1999, 34, 451–465 CrossRef CAS.
  31. D. Zhou, L. Zhang and S. Guo, Water Res., 2005, 39, 3755–3762 CrossRef CAS PubMed.
  32. W. J. Weber and J. C. Morris, J. Sanit. Eng. Div., Am. Soc. Civ. Eng., 1963, 89, 31–59 Search PubMed.
  33. M. A. Khosa, J. Wu and A. Ullah, RSC Adv., 2013, 3, 20800–20810 RSC.
  34. X. J. Hu, Y. G. Liu, G. M. Zeng, S. H. You, H. Wang, X. Hu, Y. M. Guo, X. F. Tan and F. Y. Guo, J. Colloid Interface Sci., 2014, 435C, 138–144 CrossRef PubMed.
  35. M. A. Hughes, J. Wood and E. Rosenberg, Ind. Eng. Chem. Res., 2008, 47, 6765–6774 CrossRef CAS.
  36. J. Wang and C. Chen, Biotechnol. Adv., 2009, 27, 195–226 CrossRef CAS PubMed.
  37. J. Wang, Q. Yi, N. Horan and E. Stentiford, Bioresour. Technol., 2000, 75, 157–161 CrossRef CAS.
  38. G. Zhao, J. Li, X. Ren, C. Chen and X. Wang, Environ. Sci. Technol., 2011, 45, 10454–10462 CrossRef CAS PubMed.

This journal is © The Royal Society of Chemistry 2015
Click here to see how this site uses Cookies. View our privacy policy here.