
Enhanced electrochemical reduction of carbon dioxide to formic acid using a two-layer gas diffusion electrode in a microbial electrolysis cell†
Qinian Wang,
Heng Dong*,
Hongbing Yu*,
Han Yu and
Minghui Liu
College of Environmental Science and Engineering, Nankai University, No. 94 Weijin Road, Nankai District, Tianjin 300071, China. E-mail: dongheng@nankai.edu.cn; hongbingyu1130@sina.com; Fax: +86-22-23502756; Tel: +86-22-23502756
First published on 7th January 2015
Abstract
Electrochemical reduction of CO2 to formic acid (ERCF) is mainly hindered by CO2 mass transfer and high energy consumption. This work developed a two-layer rolled Sn-loaded gas diffusion electrode (SGDE), consisting of a gas diffusion layer and a Sn-loaded brass mesh to improve ERCF in a microbial electrolysis cell (MEC). The morphology and chemical composition of the SGDE were characterized by scanning electron microscopy, X-ray diffraction, energy dispersive X-ray spectroscopy and X-ray photoelectron spectroscopy. The electrochemical behavior of the SGDE for ERCF was assessed by cyclic voltammetry and electrochemical impedance spectroscopy. The Faraday efficiency and production yield of formic acid were measured in order to evaluate ERCF. The electrochemical measurements exhibited the advantages of the SGDE, including higher ERCF current and lower charge transfer resistance, owing to the increase in the working concentration of CO2 in the vicinity of the electrocatalytically active sites. The use of the SGDE in MEC improved Faraday efficiency and production yield of formic acid by 36.1% and 30.6%, respectively. Whereas the energy consumption for ERCF was reduced by approximately 67.2–73.6%.
1. Introduction
Electrochemical reduction of CO2 to formic acid (ERCF) has gained great attention since it is a technically feasible and economically viable technique for valuable materials production and CO2 offset.1–7 To trigger ERCF in a common electrolytic cell (CEC) at the cathode where the anodic reaction is water oxidation, a minimum input voltage of ca. 2.5 V is needed.8 A microbial electrolysis cell (MEC) has recently been proposed as a novel and sustainable technology for the renewable and sustainable production of biofuels or valuable chemicals from waste organic materials.9–11 It consists of an anode and a cathode, which are typically separated by a proton exchange membrane (PEM). Different from the undesired water oxidation in CEC, an oxidized elimination of substrate by the bacteria accompanied with the release of electrons and protons occurs on the bioanode in MEC. The electrons are then transferred to the cathode through an external circuit, while the protons diffuse to the cathode through the PEM. Finally, those electrons and protons are utilized in the reduction reactions of an electron acceptor at the cathode.12,13 In most cases of MECs, with the assistance of the potential generated from substrate oxidation at the bioanode, less power supply is needed for the cathodic reactions than that in CEC. Take the hydrogen evolution reaction (HER) at the cathode in MEC as an example, the bacteria at the anode consume organic matter and produce a potential of ca. −0.3 V vs. NHE, while HER requires a potential of −0.41 V vs. NHE at pH 7.0, requiring a theoretical input voltage of 0.11 V. This voltage is substantially lower than that needed for HER from the electrolysis of water (1.21 V at pH 7.0 (ref. 14)). ERCF has been preliminary realized in MEC with an input voltage of ca. 1.2–1.5 V,15,16 where Pb plates were used as the cathodes and CO2 was provided by sparging in the catholyte bulk. As the solubility of CO2 in water at ambient conditions is relatively low (ca. 0.033 M), CO2 mass transfer from the bulk to the cathode surface is definitely a significant barrier for achieving an efficient ERCF in MEC. Several studies of ERCF in CEC have proposed gas diffusion electrodes (GDEs) as an effective method to alleviate CO2 mass transfer limitation.17–20 The fabricated GDEs were all of typical three-layer structure consisting of a gas diffusion layer (GDL), a current collector and a catalyst layer (CL). The CL was made of catalyst and binder, where ERCF occurred. Hydrophilic Nafion and hydrophobic polytetrafluoroethylene (PTFE) were the primary binders widely adopted in those GDEs.17–20 The electron conduction and CO2 diffusion in the CL are both very essential to ERCF.21 However, Nafion and PTFE are non-conductor. Moreover, CO2 diffusion in a Nafion-binded CL is insufficient since hydrophilic Nafion is unable to provide gas channel for CO2 therein by itself.21 Although using those typical GDEs have improved ERCF to a certain extent, the aforementioned problems concerning the CL have not be solved properly yet. In addition, it has been reported that the cost of cathode material accounts for about 47% of overall investment in a bioelectrochemical system (e.g. MEC).22 Hence there is urgent need to develop a GDE with low-cost and high performance for ERCF in MEC.In this work, a two-layer Sn-loaded GDE (SGDE) without the traditional CL (e.g. without binder) was developed. The SGDE consists merely of a GDL and a brass mesh plated with Sn. We used Sn as the catalyst due to its high selectivity to ERCF and low risk to the environment and human health.19,23 Cyclic voltammetry (CV) and electrochemical impedance spectroscopy (EIS) were applied to assess its electrochemical behavior for ERCF. Constant potential electrolysis was adopted to evaluate ERCF in MEC. The Sn-loaded brass mesh (SE) without GDL was studied as control.
2. Experimental
2.1 Electrode preparation
The SGDE consisted of a GDL and a Sn-loaded brass mesh. The GDL was prepared as follows: conductive carbon black (Jinqiushi Chemical Co. Ltd., Tianjin, China) was distributed in a beaker with an appropriate amount of ethanol and ultrasonically agitated for 20 min. Then a PTFE suspension (60 wt%, Hesen, Shanghai, China) was dripped slowly into the beaker to form a blend. The mass ratio of conductive carbon black and PTFE was 3![[thin space (1/6-em)]](https://www.rsc.org/images/entities/char_2009.gif) :7. This step was completed for 20 min. Then, the blend was stirred at 353 K to give a dough-like paste. The paste was then rolled to form a gas diffusion film of 0.15 mm thickness. The Sn-loaded brass mesh was made as follows: the brass mesh (60 mesh) was first immersed in acetone for 24 h and then etched in hydrochloric acid (10%). Then, it was immersed in an electroless acidic tin plating bath, containing 0.02 M stannous sulphate, 0.22 M sulfuric acid and 0.6 M thiourea, for 4 min at 319 K. The weights of the brass mesh before and after the loading process were also measured to control the loading of Sn catalyst and make the result more consistent. Finally, the Sn-loaded brass mesh was rolled on the GDL and sintered for 20 min at 613 K to obtain the final electrode of ca. 0.2 mm thickness.
:7. This step was completed for 20 min. Then, the blend was stirred at 353 K to give a dough-like paste. The paste was then rolled to form a gas diffusion film of 0.15 mm thickness. The Sn-loaded brass mesh was made as follows: the brass mesh (60 mesh) was first immersed in acetone for 24 h and then etched in hydrochloric acid (10%). Then, it was immersed in an electroless acidic tin plating bath, containing 0.02 M stannous sulphate, 0.22 M sulfuric acid and 0.6 M thiourea, for 4 min at 319 K. The weights of the brass mesh before and after the loading process were also measured to control the loading of Sn catalyst and make the result more consistent. Finally, the Sn-loaded brass mesh was rolled on the GDL and sintered for 20 min at 613 K to obtain the final electrode of ca. 0.2 mm thickness.
2.2 MEC reactor construction and setup
The MEC reactor was derived from a two-chambered MFC reactor, which was constructed as previously described.24,25 The two compartments were separated by a PEM (Nafion 117, Dupont, USA). The MFC was inoculated using a pre-acclimated bacterial suspension from MFCs which were operated for over one year. The reactor was fed with 50 mM phosphate buffer solution (PBS, Na2HPO4 4.09 g L−1, NaH2PO4·H2O 2.93 g L−1), trace minerals 12.5 mL L−1, vitamins 5 mL L−1 and 1 g L−1 sodium acetate as substrate.26 The external resistance was fixed at 1000 Ω by using a resistor box, except as indicated.When the voltage of the two-chambered MFC became stable, the MFC operation was changed into MEC operation by replacing the cathode with the tested electrode (SGDE or SE, 7 cm2) and the catholyte with 0.5 M KHCO3 solution. The schematic overview of the MEC systems employed in this work is shown in the ESI (Fig. S1†). For the SGDE, a gas chamber was specially designed (Fig. S1b†). The cathode and the bioanode were connected to the working electrode and the counter electrode of an electrochemical workstation (CHI600D, Shanghai Chenhua Instruments Co., China), respectively. The reference electrode was a Ag/AgCl electrode (sat. KCl, Tianjin Aidahengsheng Technology Co. Ltd., China) and was electrolytically connected to the working electrode solution through a Luggin capillary.
2.3 ERCF in MEC
ERCF test in MEC was done under constant potential at 303 ± 1 K, using an electrochemical workstation (CHI600D, Shanghai Chenhua Instruments Co., China). The electrolyte was circulated using a peristaltic pump (BT-yz1515, Tianjin Sabo Instruments Co., China) at a flow rate of 25 mL min−1. The flow rate of CO2 (99.99%, Tianjin Sizhi gas Co. Ltd., China) was 30 mL min−1. The duration of each electrolysis run was 2 h. The catholyte was sampled for analysis after each run.2.4 Analysis and calculations
The morphology of the SGDE was observed by SEM (S-3500N, Hitachi Limited, Japan). The crystal structure of the SGDE was characterized by XRD (Rigaku D/MAX-2500, Japan). The surface chemical composition of the SGDE was examined by EDX (IX2F-550I, EDAX Co., USA) and XPS (Axis Ultra DLD, Kratos Analytical Ltd., UK). The XPS data were analyzed by CasaXPS software.The electrochemical behavior of the SGDE and SE for ERCF were assessed by CV and EIS, using an electrochemical workstation (CHI600D, Shanghai Chenhua Instruments Co., China). The experiments were carried out at ∼298 K in a CEC, which was constructed as shown in Fig. S1† except that a Pt sheet (1 cm2, Tianjin Aidahengsheng Technology Co. Ltd., China) was used as counter electrode. The electrolyte in the cathodic chamber and anodic chamber was 0.5 M KHCO3 solution. Before each measurement, where either the SGDE or the SE was used as working electrode and the electrolyte was degassed with N2 (99.99%, Tianjin Sizhi gas Co. Ltd., China) for 30 min to obtain a baseline. During each measurement where the SE was used as working electrode, N2 or CO2 was continuously sparged in the electrolyte. When the SGDE was working electrode, N2 or CO2 was continuously fed into the gas chamber during the measurement. CV was conducted between 0 V and −2 V vs. Ag/AgCl at a scan rate of 0.1 V s−1.19,27 EIS was performed over a frequency range of 100 kHz to 0.1 Hz with the AC signal amplitude of 0.005 V superimposed on different dc potentials of −1.2 V and −1.3 V vs. Ag/AgCl. The EIS data were analyzed using the Zsimpwin software (ver. 3.10).
The electrolytic production of formic acid was determined using a high performance liquid chromatography (HPLC, Beijing Puxitongyong Instruments Co., China) equipped with a C18 reversed phase column (250 mm × 4.6 mm × 5 μm) by using UV detector at 210 nm. The Faraday efficiency of formic acid production was calculated as previously described.15
3. Results
3.1 SGDE characterization
SEM images of the SGDE show that the Sn-loaded brass mesh partially submerged in the GDL (Fig. 1a). The Sn catalyst particles size was about 0.1–0.5 μm (Fig. 1b) and the Sn film thickness was about 2–5 μm (Fig. 1c). The XRD pattern of the SGDE (Fig. S2†) clearly showed the phase of Sn (JCPDS Card no. 65-5224) and SnO2 (JCPDS Card no. 50-1429). SnO2 was probably formed during the electrode annealing process. The Sn content in the Sn-loaded brass mesh of the SGDE was 6.45% (1.48 mg cm−2), as determined by EDX analysis (Fig. S3†). The XPS spectrum of Sn3d exhibited peaks at binding energies 495.3 eV and 486.8 eV which can be assigned to Sn3d3/2 and Sn3d5/2, respectively (Fig. S4†). These energies are consistent with Sn(IV) bound to oxygen in SnO2.28 Therefore Sn catalyst on the SGDE existed in the forms of SnO2 and Sn, the former being in the external of the Sn-loaded brass mesh and the latter in the internal.29 The SnO2 layer is very essential for ERCF by assisting to thermodynamically stabilize CO2− intermediates as well as inhibit HER.29 | ||
| Fig. 1 SEM images of the SGDE (a), catalyst particles (b), and crossover section of the Sn-loaded brass mesh (c). | ||
3.2 Electrochemical measurements
CVs obtained with the SGDE and the SE in N2 environment are shown in Fig. 2a. The reduction peaks appeared at −0.94 V and −1.28 V in turn while the oxidation peaks appeared at −0.92 V and −1.06 V. This should be caused by the irreversible redox reactions between Sn and tin oxides.30,31 It can be seen that the redox peak obtained from the SGDE was more obvious and broader than that from the SE, and the redox current from the SGDE was higher than that from the SE. This is possibly due to a higher electrochemically active species concentration for the redox reactions by using the SGDE than that by using the SE.19 When scanning to the negative end of the voltammograms, a rapidly increase in the reduction currents can be observed for both electrodes, which should be caused by HER.32 In the case of the SE, HER occurred at a potential more negative than ca. −1.4 V, which was by 0.3 V more positive than that in the case of the SGDE (ca. −1.7 V). This suggests that a higher overpotential was needed for HER with the SGDE than that with the SE. The HER current using the SGDE was 35.7–41.5% lower than that using the SE (Fig. S5†). The growing rate of HER obtained from the SGDE was also lower than that from the SE. These indicate that HER was hindered on the SGDE compared to the SE. When in CO2 environment (Fig. 2b), the rapidly increased currents were obtained from both electrodes at potentials more negative than ca. −1.2 V which should be contributed by both ERCF and HER.32 The reduction current for the SGDE was higher than that for the SE at a potential more positive than −1.48 V. When the potential was negative than −1.48 V, the reduction current for the SGDE was lower than that for the SE. It can be seen that the growing rate of the reduction reactions for the SGDE increased when the potential shifted from −1.2 V to −1.3 V, but it decreased when the potential further shifted to more negative value (Fig. S5†). This should be attributed to the difference in HER for the SGDE and SE. Thus, it can be inferred that HER did not occur for both electrodes at a potential more positive than −1.3 V, and the reduction current in potential region from −1.2 V to −1.3 V should be caused by ERCF. The ERCF current for the SGDE was 19.5–62.7% higher than that for the SE, which implies that the use of the SGDE can promote ERCF. | ||
| Fig. 2 CVs obtained with the SGDE and the SE in 0.5 M KHCO3 in N2 environment (a) and CO2 environment (b) at a scan rate of 0.1 V s−1. The inserted plots show the oxidation peaks between −0.8 V and −1.1 V obtained with the SE in N2 environment. | ||
In order to further explore the electrochemical behavior of the SGDE and SE as it concerns ERCF, EIS measurements in CO2 environment were carried out (Fig. 3). All Nyquist plots consisted of two semicircles, indicating two time constants. The first one located at high frequencies (HF) and the second one at low frequencies (LF). It is clear to see that the HF semicircle was independent on the applied potential, whereas the diameter of LF semicircle considerably decreased as the applied potential was decreased. Therefore, the HF semicircle probably represented the resistance of ionic migration through the electrolyte film formed on the electrode/electrolyte interface and the inner active sites. Whereas the LF semicircle, reflected the charge transfer resistance of ERCF, which was dependent on the kinetics of reaction. All the Nyquist plots have been modeled by the same equivalent circuit (Fig. S6†). According to this equivalent circuit, the potential independent HF time constant was described by the interfacial ohmic resistance (R1) and constant phase element (CPE1) connected in parallel, whereas the potential dependent LF time constant was described by charge transfer resistance (R2) and CPE2 connected in parallel. The parameters obtained from the EIS fitting procedure are shown in Table S1.† Just as expected, R1 values at different applied potentials for the SGDE and the SE were similar, respectively. On the contrary, R2 values were obviously different for the compared electrodes. The values obtained for the SGDE were 22.7% and 10.5% lower than those for the SE at the applied potentials of −1.2 V and −1.3 V, respectively. In addition to the resistances, the values of capacitances Q1 and Q2 obtained from the SGDE were approximately two to three times higher than that from the SE, respectively. It suggests that a larger electrochemically active surface area could be provided by the SGDE compared to the SE for ERCF.33 Taking into account the structural changes from SE to SGDE, the decrease in R2 value and increase in capacitances may be related with an enhanced CO2 working concentration in the vicinity of the electrocatalytically active sites.
 | ||
| Fig. 3 Nyquist plots for the SGDE and the SE at an applied potential of −1.2 V and −1.3 V. | ||
3.3 ERCF in MEC
As already mentioned, the MEC reactor was a two-chambered MFC operating in electrolysis mode. The performance characteristics of this MFC are presented in Fig. S7.† The open circuit voltage (OCV) and the maximum power density were 0.638 V and 745 mW m−2, respectively. These values are comparable to those obtained with similar configurations in other studies.25,34In MEC mode, both electrodes are compared as it concerns ERCF according to the Faraday efficiency (FEHCOOH) and production yield of formic acid. It can be seen that ERCF occurred with both electrodes when the applied cathode potential was negative than −1.0 V (Fig. 4). In addition, the SGDE performed better than the SE for ERCF over the entire range of the applied cathode potentials. The maximum FEHCOOH value of 40.09 ± 3.91% and formic acid production yield of 0.064 ± 0.006 mol m−2 were both obtained with the SGDE at the applied cathode potential of −1.2 V. They were 36.1% and 30.6% higher than those obtained with the SE (FEHCOOH value: 29.45 ± 2.21%, production yield: 0.049 ± 0.005 mol m−2). Comparing with the SE (i.e. a metal cathode), the SGDE could significantly promote ERCF in MEC, which is reported here for the first time.
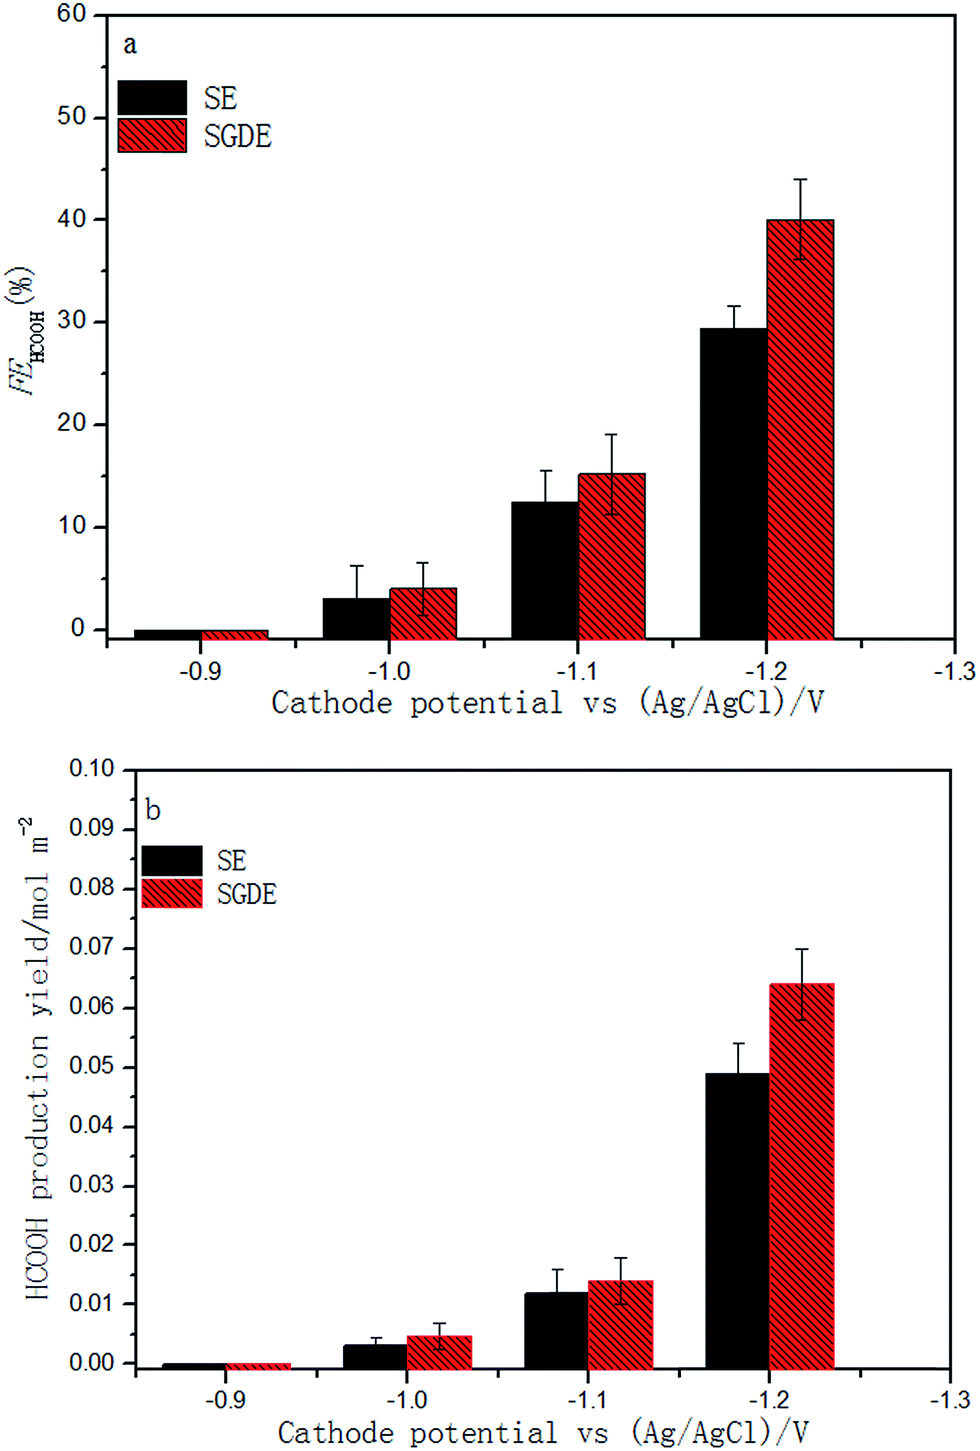 | ||
| Fig. 4 Dependence of Faraday efficiency and formic acid production yield on applied cathode potential in MEC mode. | ||
4. Discussion
When the SE cathode is used for ERCF in aqueous electrolyte, CO2 is provided by sparging in the catholyte bulk. In that case, the absorbed CO2 (ad), as the main reactant of ERCF will be limited by the low solubility of CO2 in water (ca. 0.033 M) (formation path of CO2 (ad): CO2 (g) → CO2 (aq) → CO2 (ad)). Moreover, the species CO2 (aq) reacts with OH− to produce HCO3− and CO32− ions, decreasing the CO2 (ad) concentration.35 The aforementioned limitation of CO2 mass transfer (e.g. low CO2 (ad) concentration) can be greatly broken by using the SGDE, where a direct formation path of CO2 (ad) from the gaseous state (CO2 (g) → CO2 (ad)) is allowed (see Fig. S8†). So that an effective increase in the concentration of CO2 (ad) at the electrochemically active sites can be achieved.35 It was confirmed by the results of CV and EIS in this work where a higher ERCF current and lower charge transfer resistance were obtained by using the SGDE compared to the SE. The advantages of the SGDE are also supported by the results of the ERCF experiments in MEC, where the FEHCOOH value and production yield of formic acid were enhanced by 36.1% and 30.6%, respectively when using the SGDE cathode to replace the SE cathode. In order to explore the performance of the SGDE without consideration of the bioanode activity, ERCF experiments in CEC were also carried out using a more negative potential region (from −1.2 V to −2.0 V) (Fig. S9†). The maximum FEHCOOH value of 79.27 ± 1.52% and current density of 17.57 ± 1.05 mA cm−2 were obtained from the SGDE, which were higher than those from the SE by 25.4% and 61.5%, respectively. The FEHCOOH value of 79.27 ± 1.52% is the highest reported in literature when using Sn electrodes under the same conditions.5,18,36–39 It is clear that the CO2 mass transfer limitation was indeed alleviated by using the SGDE. Other than the CO2 mass transfer limitation, high energy consumption is also a significant barrier of ERCF in the current studies. In our experiments, by using the SGDE cathode for ERCF in MEC, the input voltage reached 0.66–0.82 V during electrolytic period of 2 h at the applied cathode potential of −1.0 V (Fig. S10†), approximately 67.2–73.6% lower than the value by using a typical Sn GDE cathode in CEC at ambient pressure (ca. 2.5 V (ref. 8)). Obviously, the energy consumption for ERCF is greatly reduced by the use of SGDE as well as MEC.It has been explained that why the typical GDEs in the current studies in ERCF are incapable of good electron conduction and CO2 diffusion. Then we developed the two-layer structure of the SGDE, anticipating an improvement in the current collection by using the brass mesh and in CO2 diffusion by decreasing the thickness of the catalyst film. In order to confirm that, ERCF tests in CEC with a typical three-layer Sn GDE cathode were also carried out at the cathode potential of −1.8 V. The GDL of this Sn GDE was the same as that of the SGDE. The CL of this Sn GDE was prepared by spraying the as-prepared Sn catalyst ink onto the GDL, described in our previous work.27 The FEHCOOH value of 63.48 ± 3.31% and current density of 10.56 ± 3.12 mA cm−2 obtained from the Sn GDE were 19.9% and 39.9% lower than that obtained from the SGDE, respectively. This indicates that the novel SGDE indeed alleviates the problems of electron conduction and CO2 diffusion found in ERCF with the typical Sn GDE of three-layer structure. Other advantages of the SGDE such as low fabrication cost (ca. 30 % m−2) and simple fabrication procedure are undoubtedly favorable for the future industrial application.
In this work, the high energy consumption and CO2 mass transfer limitation for ERCF are greatly reduced owing to the MEC with SGDE cathode. In that system, industrial waste gases could act as CO2 sources at SGDE cathode and the CO2 released from the biodegradation process of the organic matters in real wastewaters at the bioanode could be recovered. Most importantly, by using a SGDE cathode in a MEC, ERCF can work favorably while wastewaters can be effectively treated.
5. Conclusions
A two-layer rolled Sn-loaded gas diffusion electrode (SGDE) consisting of a gas diffusion layer and Sn-loaded brass mesh was developed to improve electrochemical reduction of CO2 to formic acid (ERCF) in microbial electrolysis cell (MEC). Sn catalyst existed in the forms of SnO2 and Sn, in the external and the internal of the Sn-loaded brass mesh, respectively. Compared to the Sn-loaded brass mesh (SE), the SGDE has advantages, including higher ERCF current and lower charge transfer resistance. A maximum Faraday efficiency of 40.09 ± 3.91% and a production yield of 0.064 ± 0.006 mol m−2 were achieved in MEC with the SGDE cathode, which were 36.1% and 30.6% higher than those obtained in MEC with the SE cathode. This enhanced performance can be attributed to the unique structure of the SGDE which alleviates the CO2 mass transfer and electron conduction limitations. Other advantages of the SGDE, such as the low fabrication cost (ca. 30 % m−2) and the simple fabrication procedure are also beneficial for its industrial application. Using the SGDE in a MEC, ERCF can be carried out favorably with low energy consumption while wastewaters can be effectively treated. In a following work, long-term experiments will be carried out to make ERCF in MEC with SGDE cathode more reliable for CO2 conversion.Acknowledgements
The authors gratefully acknowledge financial support by the Major National Science & Technology Projects of China on Water Pollution Control and Treatment (2012ZX07501002-001) and Research Project of Tianjin City for Application Foundation and Advanced Technology (BE026071).References
- Y. Chen and M. W. Kanan, J. Am. Chem. Soc., 2012, 134, 1986–1989 CrossRef CAS PubMed.
- J. H. Jeon, P. M. Mareeswaran, C. H. Choi and S. I. Woo, RSC Adv., 2014, 4, 3016 RSC.
- Y. Koo, R. Malik, N. Alvarez, L. White, V. N. Shanov, M. Schulz, B. Collins, J. Sankar and Y. Yun, RSC Adv., 2014, 4, 16362 RSC.
- Y. Kwon and J. Lee, Electrocatalysis, 2010, 1, 108–115 CrossRef CAS.
- C. Oloman and H. Li, ChemSusChem, 2008, 1, 385–391 CrossRef CAS PubMed.
- J. Qiao, P. Jiang, J. Liu and J. Zhang, Electrochem. Commun., 2014, 38, 8–11 CrossRef CAS PubMed.
- H. Zhao, Y. Zhang, B. Zhao, Y. Chang and Z. Li, Environ. Sci. Technol., 2012, 46, 5198–5204 CrossRef CAS PubMed.
- D. T. Whipple, E. C. Finke and P. J. Kenis, Electrochem. Solid-State Lett., 2010, 13, B109–B111 CrossRef CAS PubMed.
- Y. Jiang, M. Su, Y. Zhang, G. Zhan, Y. Tao and D. Li, Int. J. Hydrogen Energy, 2013, 38, 3497–3502 CrossRef CAS PubMed.
- B. E. Logan, ChemSusChem, 2012, 5, 988–994 CrossRef CAS PubMed.
- B. E. Logan, B. Hamelers, R. Rozendal, U. Schröder, J. Keller, S. Freguia, P. Aelterman, W. Verstraete and K. Rabaey, Environ. Sci. Technol., 2006, 40, 5181–5192 CrossRef CAS.
- A. W. Jeremiasse, H. V. M. Hamelers, E. Croese and C. J. N. Buisman, Biotechnol. Bioeng., 2012, 109, 657–664 CrossRef CAS PubMed.
- L. Lu, D. Xing, T. Xie, N. Ren and B. E. Logan, Biosens. Bioelectron., 2010, 25, 2690–2695 CrossRef CAS PubMed.
- S. Cheng, D. Xing, D. F. Call and B. E. Logan, Environ. Sci. Technol., 2009, 43, 3953–3958 CrossRef CAS.
- H.-Z. Zhao, Y. Zhang, Y.-Y. Chang and Z.-S. Li, J. Power Sources, 2012, 217, 59–64 CrossRef CAS PubMed.
- B. Y. Chen, Aerosol Air Qual. Res., 2013, 13, 266–274 CAS.
- A. Li, H. Wang, J. Han and L. Liu, Front. Chem. Sci. Eng., 2012, 6, 381–388 CrossRef CAS PubMed.
- R. L. Machunda, H. Ju and J. Lee, Curr. Appl. Phys., 2011, 11, 986–988 CrossRef PubMed.
- G. K. S. Prakash, F. A. Viva and G. A. Olah, J. Power Sources, 2013, 223, 68–73 CrossRef CAS PubMed.
- M. Mahmood, D. Masheder and C. Harty, J. Appl. Electrochem., 1987, 17, 1159–1170 CrossRef CAS.
- J. Wu, P. P. Sharma, B. H. Harris and X.-D. Zhou, J. Power Sources, 2014, 258, 189–194 CrossRef CAS PubMed.
- R. A. Rozendal, H. V. Hamelers, K. Rabaey, J. Keller and C. J. Buisman, Trends Biotechnol., 2008, 26, 450–459 CrossRef CAS PubMed.
- W. Lv, R. Zhang, P. Gao, C. Gong and L. Lei, J. Solid State Electrochem., 2013, 17, 2789–2794 CrossRef CAS PubMed.
- H. Dong, H. Yu, X. Wang, Q. Zhou and J. Feng, Water Res., 2012, 46, 5777–5787 CrossRef CAS PubMed.
- X. Peng, H. Yu, X. Wang, N. Gao, L. Geng and L. Ai, J. Power Sources, 2012, 223, 94–99 CrossRef PubMed.
- X. Wang, S. A. Cheng, Y. J. Feng, M. D. Merrill, T. Saito and B. E. Logan, Environ. Sci. Technol., 2009, 43, 6870–6874 CrossRef CAS.
- Q. Wang, H. Dong and H. Yu, RSC Adv., 2014, 104, 59970–59976 RSC.
- S. Zhang, P. Kang and T. J. Meyer, J. Am. Chem. Soc., 2014, 136, 1734–1737 CrossRef CAS PubMed.
- Y. Chen and M. W. Kanan, J. Am. Chem. Soc., 2012, 134, 1986–1989 CrossRef CAS PubMed.
- S. Kapusta and N. Hackerman, Electrochim. Acta, 1980, 25, 1625–1639 CrossRef CAS.
- Fu. Wang, F. Xie and R. Hu, Anal. Bioanal. Chem., 2007, 387, 933–939 CrossRef PubMed.
- W. Lv, R. Zhang, P. Gao and L. Lei, J. Power Sources, 2014, 253, 276–281 CrossRef CAS PubMed.
- M. Mirzaeian and P. J. Hall, J. Power Sources, 2010, 195, 6817–6824 CrossRef CAS PubMed.
- X. Peng, H. Yu, X. Wang, Q. Zhou, S. Zhang, L. Geng, J. Sun and Z. Cai, Bioresour. Technol., 2012, 121, 450–453 CrossRef CAS PubMed.
- R. Chaplin and A. Wragg, J. Appl. Electrochem., 2003, 33, 1107–1123 CrossRef CAS.
- J. Qiao, Y. Liu, F. Hong and J. Zhang, Chem. Soc. Rev., 2014, 43, 631–675 RSC.
- A. S. Agarwal, Y. Zhai, D. Hill and N. Sridhar, ChemSusChem, 2011, 4, 1301–1310 CrossRef CAS PubMed.
- M. Alvarez-Guerra, S. Quintanilla and A. Irabien, Chem. Eng. J., 2012, 207–208, 278–284 CrossRef CAS PubMed.
- J. Wu, F. G. Risalvato, F. S. Ke, P. J. Pellechia and X. D. Zhou, J. Electrochem. Soc., 2012, 159, F353–F359 CrossRef CAS PubMed.
Footnote |
| † Electronic supplementary information (ESI) available. See DOI: 10.1039/c4ra14535f |
| This journal is © The Royal Society of Chemistry 2015 |