
Mechanism of a green graphene oxide reduction with reusable potassium carbonate†
Dongning Heac,
Zheng Peng*a,
Wei Gonga,
Yongyue Luoa,
Pengfei Zhaoa and
Lingxue Kong*b
aChinese Agricultural Ministry Key Laboratory of Tropical Crop Product Processing, Agricultural Product Processing Research Institute, Chinese Academy of Tropical Agricultural Sciences, Zhanjiang 524001, PR China. E-mail: zpengcatas@126.com; Tel: +86 759 2286933
bInstitute for Frontier Materials, Deakin University, Waurn Ponds, VIC 3216, Australia. E-mail: lingxue.kong@deakin.edu.au
cCentre of Excellence in Engineered Fibre Composites, Faculty of Health, Engineering and Sciences, University of Southern Queensland, Toowoomba 4350, Australia
First published on 14th January 2015
Abstract
A green method for the deoxygenation of graphene oxide (GO) was developed using K2CO3 as a reusable reduction agent. The size and thickness of the reduced GO are less than 1 μm and around 0.85 nm, respectively. Carbon dioxide is the only byproduct during this process. The reduction mechanism of the graphene oxide includes two reduction steps. On the one hand, ionic oxygen generated from the electrochemical reaction between hydroxyl ions and oxygen in the presence of K2CO3 reacts with carbonyl groups attached to the GO layers at 50 °C. On the other hand, ionic oxygen attacks hydroxyl and epoxide groups, which become carbonyl groups and then are converted to carbon dioxide by K2CO3 at 90 °C. These oxygenous groups are finally converted to CO2 from graphene layers, leading to the formation of graphene sheets. Headspace solid-phase microextraction and gas chromatography-mass spectrometry detected the existence of n-dodecanal and 4-ethylbenzoic acid cyclopentyl ester during the reduction, suggesting that oxygen functional groups on the GO layers are not only aligned, but randomly dispersed in some areas based on the proposed mechanism.
1. Introduction
Graphene has many applications in electronics,1 optoelectronics,2 and mass and energy transport3 due to its outstanding electrical,4 thermal,5 mechanical,6 and chemical properties.7 Micromechanical cleavage of graphite oxide was used successfully to prepare graphene. However, a variety of chemicals are required in this synthesis method, which limits the production on a large scale. It a great challenge to develop a simple and green route to fabricate graphene.The preparation of graphene from graphite mainly involves mechanical8 and chemical exfoliation.9 Mechanical exfoliation, such as “Scotch tape”, liquid/gas phase-based exfoliation of graphite and micromechanical cleavage using raw graphite or exfoliated graphite as precursors and is a simple process that produces graphene of high quality.10 However, mechanical exfoliation has the obviously disadvantages of low yield and long production time and is therefore not suitable for large-scale production.11 Moreover, mechanically produced graphene easily self-aggregates, limiting its further applications.
Chemical exfoliation, including chemical vapor deposition,12 epitaxial growth13 and the creation of colloidal suspensions,14 is a promising method, particularly for preparing graphene in an industrial scale. One of the popular chemical exfoliation methods is colloidal suspension, where graphite is exhaustively oxidized using the methods developed by Brodie,15 Staudenmaier,16 or Hummers.17 Strong acids and oxidants have to be applied to produce exfoliated graphene oxide (GO) because the hydroxyl, carboxyl, and epoxide groups are decorated on the GO surface which have to be deoxidized before converting GO to graphene. The conventional chemical reductants for converting GO to graphene include hydrazine hydrate,9 H2,18 hydroquinone,19 NaBH4,20 Na/CH3OH,21 propylene carbonate,22 vitamin C,23 aluminum powder,24 and molten halide salts25 which are either hazardous, unrecyclable, or high cost. Therefore, it is essential to explore a green chemical exfoliation process for graphene production. Recently, benzylamine,26 poly(diallyldimethylammonium chloride),27 tea polyphenols28 and others29 were employed for the environmental friendly approaches to synthesis of graphene. The green fabrication of graphene become a new research hot spot.
In the paper, we report a new and efficient method to deoxidize exfoliated GO using K2CO3, which is more eco-friendly compared with conventional methods those use strong alkaline agents at high temperature.30 The resulting deoxygenation process is green, simple and easy to scale-up. In addition, the deoxygenation agent is recyclable and the only byproduct of the process is carbon dioxide.
2. Materials and methods
2.1. Materials
Graphite (natural graphite powder, particle size less than 45 μm), sodium nitrate (NaNO3, analytical grade), hydrogen peroxide (H2O2, 30%), sulfuric acid (H2SO4, 98%), potassium carbonate (K2CO3, analytical grade), potassium permanganate (KMnO4, analytical grade) were obtained from the Sinopharm Chemical Reagent Co., Ltd. All aqueous solutions were prepared using purified water produced by an ultrapure water manufacturer (ABW-2001-V, Chongqing Ailepu, China).2.2. Preparation of deoxygenated graphene oxide (DGO)
GO was prepared according to the modified Hummers method.17 Briefly, H2SO4 (100 g) was added to a flask immersed under an ice-bath. The flask contained flaked natural graphite powder (4 g) and NaNO3 (2 g). After 30 min, KMnO4 (18 g) was added gradually. The reaction mixture was stirred for 10 h at 30 °C. As the reaction progressed, the suspension became paste-like and brownish. Purified water (300 ml) was then added slowly, causing the mixture to boil. The mixture was stirred for a further 15 min. The diluted suspension, now brown in color, was treated with a mixture of 30% H2O2 (90 ml) to reduce the residual permanganate and MnO2 to soluble MnSO4; the color changed to light yellow. The suspension was filtered and washed three times with water and three times with HCl (5%), and finally washed to pH 7 with water. The suspension was collected and exfoliated ultrasonically, and freeze-dried suspension (1 mg ml−1) was obtained by dispersing purified GO in purified water with the aid of sonication (200 W, 40 kHz, 10 min). 75 ml of brown exfoliated-GO suspension and 75 ml K2CO3 solution (4 M) were added into a flask with water bath with mild sonication (9 W, 50 kHz). After heating at 90 °C for 2 h, the mixture was cooled down to room temperature. The obtained solid was purified by purified water for 15 times and followed by centrifugation and freeze-dried. DGO could be prepared by simply heating exfoliated-GO suspension with carbonate at a temperature of 90 °C. Typically, 50 ml of exfoliated-GO suspension and 50 ml K2CO3 solution (4 M) were added into a flask and then placed in an ultrasonic (9 W, 50 kHz) bath basin. The temperature was accurately controlled to ensure a precise reaction temperature and homogenous dispersion of the suspension. The color of the suspension changed from brown to dark brown and finally to black during deoxygenation (Fig. S1†).2.3. Characterization
The morphology of the sample was observed by scanning electron microscope (SEM) on an S4800 (Hitachi, Japan). Raman spectroscopy was performed on a JY-T64000 Raman spectrometer (Horiba, Japan) with a wavelength of 514.5 nm and an Ar+ ion laser. The changes of the oxygen-containing groups were measured with Fourier transform infrared spectroscopy (FTIR) with a wave scan range of 4000–400 cm−1 (PE, USA). X-ray diffraction (XRD) was carried out on a Bruker D8 ADVANCE (Bruker AXS, Karlsruhe, Germany) with Cu Kα radiation to determine the structure of the specimen. The thermal stability of graphene and graphene oxide was tested with a thermogravimetric analysis (TGA) and differential scanning calorimetry (DSC) with a NETZSCH STA 449 thermoanalyzer (NETZSCH, Germany) under pure nitrogen or air flow with a heating rate of 2 °C min−1. Atomic force microscopy (AFM) was performed with a SPI4000 probe station (SIINT Instruments Co., Japan) to determine the thickness and morphology of DGO. The bond signal of the sample was observed by X-ray photoelectron spectroscopy analysis (XPS) on a XSAM800 (KRATOS, UK). Headspace solid-phase microextraction-gas chromatography-mass spectroscopy (HS-SPME-GC-MS) results were collected from a GCMS-5050A (SHIMADZU, Japan) to monitor gas effusion from the heating procedure. The structures of the GO and DGO were also characterized by 13C-NMR (Bruker-500) and positron lifetime spectroscopy (WUHAN UNIVERSITY, China).3. Results and discussion
The FTIR spectrum of GO (Fig. 1) shows abundant hydroxyl, carboxyl, and epoxide groups, as indicated by the characteristic peaks of the C![[double bond, length as m-dash]](https://www.rsc.org/images/entities/char_e001.gif) O stretching vibration at 1733 cm−1, the O–H deformation at 1404 cm−1, the C–O (epoxy) stretching vibration at 1227 cm−1, the C–O (alkoxy) stretching vibration at 1049 cm−1, and the epoxy or peroxide group peak at 957 cm−1 respectively. After reduction by K2CO3, the intensities of the oxygenous groups significantly decrease while the peak at 1624 cm−1, which corresponds to unoxidized graphitic domains and remains.
O stretching vibration at 1733 cm−1, the O–H deformation at 1404 cm−1, the C–O (epoxy) stretching vibration at 1227 cm−1, the C–O (alkoxy) stretching vibration at 1049 cm−1, and the epoxy or peroxide group peak at 957 cm−1 respectively. After reduction by K2CO3, the intensities of the oxygenous groups significantly decrease while the peak at 1624 cm−1, which corresponds to unoxidized graphitic domains and remains.
 | ||
| Fig. 1 FTIR spectra of graphene oxide (GO) and deoxygenated graphene oxide (DGO). | ||
SEM image in Fig. 2a shows that the GO flakes are relatively large. However, they become smaller DGO flakes after reduction by K2CO3 (Fig. 2b). Although DGO tends to self-aggregate when it is dried on a mica wafer, the AFM results show that the DGO fragments have similar dimensions to the SEM observation with a size much less than 1 μm (Fig. 2c) and a thickness around 0.85 nm (Fig. 2c′). This indicates that the DGO fragments consist of two or three graphene layers because the graphene d-spacing is 0.334 nm.31 The formation of graphene is also confirmed by the XPS, where an increase of the number of sp2 carbon atoms is accompanied by a significant decrease of C–O groups and a slight increase of CO and C(O)O groups (Fig. 3). The formation of graphene is also confirmed by XRD and TGA (Fig. S2 and S3†).
 | ||
| Fig. 2 SEM images of (a) graphene oxide (GO) and (b) deoxygenated graphene oxide (DGO) flakes. AFM images of DGO sheets: (c) 3D representation of 5 μm × 5 μm AFM scan showing the morphology of the graphene flaks and (c′) AFM topography image showing sheets of DGO flakes. | ||
 | ||
| Fig. 3 XPS of graphene oxide (GO) and deoxygenated graphene oxide (DGO). (a) XPS of carbon in GO and (b) XPS of carbon in DGO. | ||
Oxygenous groups on the carbon sheets have high reaction activity even at lower temperature.32 When the reaction is specifically controlled under mild conditions, ionic oxygen (all possible kinds of ionic oxygen in the system; Oxx−) reacts with the oxygenous groups (COx) of GO but doesn't destroy the carbon backbone. The reaction of GO is proposed in Fig. 4. Firstly, ionic oxygen attacks the carbon atoms with oxygen functional groups (hydroxyl, carboxyl, and epoxide groups) (Fig. 4a), and then the groups are removed from the graphene layer in the form of carbon dioxide (Fig. 4b), leading to the formation of sheet defects on graphene (Fig. 4c).
 | ||
| Fig. 4 Reaction procedure of graphene oxide (GO) deoxygenation by potassium carbonate: (a) the structure of GO; (b) ionic oxygen attacks the oxygen functional groups on GO; and (c) graphene is formed with defects. | ||
To understand the mechanism of the deoxygenation of GO, it is critical to identify the source of Oxx−, which could include oxygen dissolving in water, oxygen attaching on the surface of the graphene oxide with π–π conjugate bonds, and reactions between the ionic carbonate or hydroxyl groups. In controlled experiments (Fig. S4†), there is no Oxx− from oxygen dissolved in water or oxygen attached to the GO surface. Oxx− is only formed in the reaction between OH− and O2 when K2CO3 is introduced (eqn (1)–(3)).33 The reaction of K2CO3 under anaerobic condition is described as below: (eqn (4)).33,34
| O2 + 4OH− → 2O22− + 2H2O | (1) |
| 3O2 + 4OH− → 4O2− + 2H2O | (2) |
| 6OH− → 3O2− + 3H2O | (3) |
| CO32− ↔ CO2 + O2− | (4) |
Interestingly, DSC temperature scanning model indicates that Oxx− attacks GO in the form of two-step reduction because there are two peaks at 50 °C and 90 °C in the DSC curve (Fig. 5a). The FTIR recorded at 50 °C (the first deoxygenation step) shows that the carbonyl group is gone while the hydroxyl and epoxides groups appear (Fig. 5b), suggesting the first step is the elimination reaction of the carbonyl group on GO attacked by Oxx−, with carbon dioxide released (eqn (5)). The peaks of the hydroxyl and epoxide groups decrease, as expected, and the carbonyl group appears at the second deoxygenation step at 90 °C (Fig. 5c). This is due to that the hydroxyl and epoxide groups converted to the carbonyl group before they were finally converted to carbon dioxide (eqn (6) and (7)), which is similar to the mechanism proposed by Vicente for the direct carbon fuel cell (DCFC) system.35 The corrosion allowance of the carbon materials in the DCFC system, was completely converted to carbon dioxide.36–38 The reaction products of deoxygenation of GO were carbon dioxide and conjugated carbon residua.
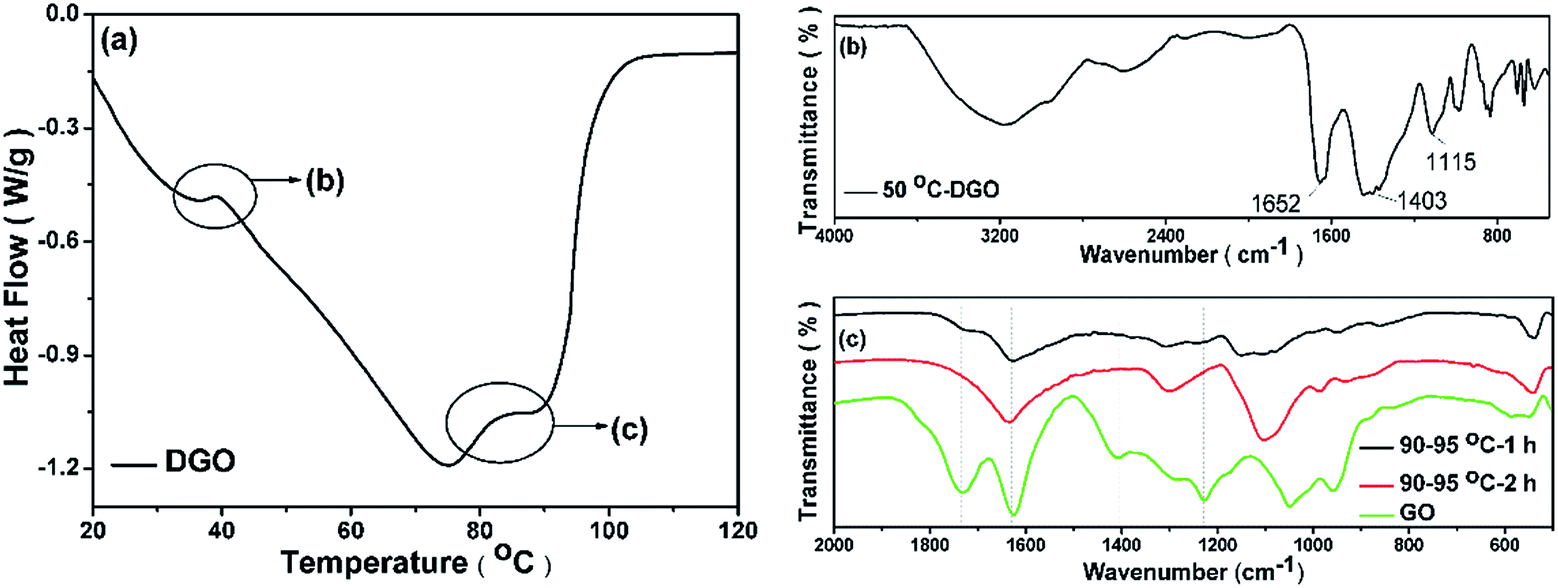 | ||
| Fig. 5 Two-step deoxygenation of graphene oxide (GO): (a) DSC curve of GO-K2CO3 suspension heated with a rate of 2 °C min−1 from 20–120 °C; (b) FTIR spectrum of the suspension heated at 50 °C for 2 h; and (c) FTIR spectra of pure GO (green) and the suspension heated at around 90 °C for 1 h (black) and 2 h (red). | ||
Accordingly, a two-step deoxygenation can be described by the following equations:
 | (5) |
 | (6) |
 | (7) |
Eqn (6) and (7) can be integrated and expressed as
 | (8) |
After carbon dioxide is released, a defect appears on graphene. The D mode in the Raman spectra increases because DGO has vacancies. There is an empirical correlation between the ratio of the D mode to the G mode (ID/IG) and the number of defects in GO.39 For DGO, ID/IG is greater than one, as shown in Fig. 6a, which means that DGO has a lot of defects. The reduction process results in the production of carbon dioxide, and leaves a defect on DGO.
 | ||
| Fig. 6 The Raman and FTIR spectra of DGO that deoxygenated with recycle K2CO3. The Raman spectroscopy and the FTIR show the recycle time of K2CO3 has no impact on the structure of DGO, indicating that K2CO3 as the deoxygenation agent can be reused, and the present process is a green one compared to other reduction processes where strong acid or basic agents are usually employed. | ||
The final products of deoxygenation are graphene and CO2. The CO2 is absorbed by K2CO3 to convert to KHCO3, as indicated in the ESI (Fig. S5†). The KHCO3 then generates K2CO3 for further deoxygenation of GO (Fig. S5†). The HS-SPME-GC-MS results confirm the formation of CO2 and graphene (Fig. 8). N-Dodecanal appears when deoxygenation is processing, indicating that the oxygen functional groups are aligned near the edge of GO (Fig. 8c).40 However, the appearance of 4-ethylbenzoic acid cyclopentyl ester is also observed (Fig. 8b), suggesting that oxygen functional groups on GO are not only aligned but also randomly dispersed in some areas based on the mechanism proposed in Fig. 4.
Fig. 7 presents the 13C NMR spectra collected before and after reduction of GO by K2CO3. The 13C NMR spectra of GO (Fig. 7) demonstrate the presence of abundant epoxide and hydroxyl groups,18 with carboxyl groups located at the edges. The peaks at 130 ppm belong to the sp2 carbon atoms of unoxidized double bonds under different conditions. After the reaction at 90 °C for 1 h, the number of carboxyl groups increase while the number of epoxide and hydroxyl groups decrease. Finally, only a few carboxyl groups remain after reduction for 2 h at 90 °C. The tests show a significant decrease in the number of epoxide and hydroxyl groups, which means those groups are converted to carboxyl groups. Finally, they are reduced. The increase in the peak at 90–150 ppm indicates that the percentage of sp2 carbon atoms increase, suggesting the formation of graphene-based materials.
 | ||
| Fig. 7 13C-NMR results: (a) 13C-NMR result of graphene oxide (GO); (b) 13C-NMR of GO sample treated with K2CO3 at 90 °C for 1 h; and (c) 13C-NMR of GO sample treated with K2CO3 at 90 °C for 2 h. | ||
 | ||
| Fig. 8 HS-SPME-GC-MS analysis of deoxygenation procedure of graphene oxide (GO): (a) HS-SPME-GC-MS spectrum of the deoxygenation process of GO; (b) products at the retention time of 6.270 min; and (c) products at the retention time of 14.315 min. | ||
Compared with other deoxygenating agents, K2CO3 is much easier to be reused. The concentrated K2CO3 was obtained through centrifugation of reaction mixture, followed by vacuum distillation. The recycled K2CO3 solution was then applied to react with GO to evaluate its catalyzing activity. The Fig. 6a indicates that the K2CO3 may be recycled for 4 times. The FTIR spectra of the inducted DGO under different reused K2CO3 show no difference. During reduction reaction, the CO2 was released from GO, with defection remaining on the DGO, as shown in Fig. 6b. All Raman spectra are similar and the ID/IG ratio is significantly larger than one. Due to the recyclability, K2CO3 makes it possible to produce the pilot-scale of graphene.
The positron lifetime spectra were analyzed in terms of discrete components (finite-term analysis) using the computer programs parfait.41–43 After the background and source correction were subtracted in the finite-term analysis, the spectra of the four samples were easily resolved into two well-isolated components, with the error of each component less than 5%, as shown in Table 1. From the short-lived component results, it was found that τ1 = 185–266 ps and I1 = 5–30%, whereas the second lifetime component was found to be τ2 = 337–397 ps and I2 = 70–94%. According to Wang et al.,44 the natural graphite bulk lifetime is 180 ± 20 ps. Therefore, it is evident that vacancy-like defects exist in the GO and its reduced derivatives, and τ2 is the lifetime of positrons trapped at defect sites. As the decomposition of positron lifetime spectra in the GO samples is always difficult, we calculated the average lifetime (τm) by
| τm = I1τ1 + I2τ2 | (9) |
| Samples | τ1 (ps) | I1 (%) | τ2 (ps) | I2 (%) | τm (ps) | I2/I1 |
|---|---|---|---|---|---|---|
| Graphite | 183.4 ± 5.1 | 29.84 ± 1.47 | 375.1 ± 2.5 | 70.16 ± 1.45 | 317.7 | 2.351 |
| GO | 265.9 ± 24.3 | 18.95 ± 1.32 | 397.9 ± 6.4 | 81.05 ± 1.41 | 373.55 | 4.277 |
| DGO | 193.2 ± 7.5 | 5.22 ± 0.24 | 337.6 ± 4.4 | 94.78 ± 5.29 | 329.8 | 18.16 |
This parameter is more accurate, and even a small change in this value can reliably reflect the change of defect characteristics.45
Apart from a very small contribution from para-positronium (singlet positronium), where τ1 = 125 ps, the short-lived component represents free positron annihilation in the non-surface (bulk) regions of GO. In Table 1, the measured value of τ1 was found to be basically the same in the GO samples at around 265 ps, which is much higher than that of natural graphite (183.4 ps) and DGO (193.2 ps). Change in the τ1 value suggests a change in the bulk electron density. A decrease of the τ1 value indicates an increase in the electron density seen by positrons that annihilate “deep” in the bulk of the substrate. This is associated with the expansion of the graphite lattice. The highest electron density probed by positron annihilation is mainly attributed to the depressed d-spacing between the layers and highly reduced oxygen groups, because the existence of oxygen-containing groups would result in a dramatic decrease in electron density. This situation corresponds to the mechanism we proposed: oxygen groups in GO are eliminated from the system as carbon dioxide, and the defects increase in size until the whole crystalline grain crashes into a smaller one.
Table 1 shows that the I1 value of DGO is less than that of the GO and graphite samples. The crystalline grain crashed into a smaller one, and there is decreased probability of annihilation of positrons in the graphene bulk. This situation can induce the increase of defects, which further decreases the probability of annihilation of positrons in the graphene bulk. I2 value of the DGO increasing confirms that the concentration of the defects increases. I1 and τ1 indicate that oxygen groups are removed between the layers and the crystalline grains crashed in the DGO deoxygenation process. The XRD and SEM tests have similar results.
The second lifetime component with mean lifetime τ2 and relative intensity I2 results from annihilation of positron sampling electron density at or near the surface. The values of τ2 correspond to the positron lifetime in vacancy-like defects on the surface of graphite according to Wang et al.44 A direct correlation between I2 and surface area was found: the higher the surface area, the larger the I2 value. However, only a very slight expansion of the graphite lattice was observed by XRD for the graphite, GO and DGO samples. The effect of surface area on the lifetime intensity could be negligible in this region. In addition, the variation of defect concentration may also change the observed I2 value. In the current situation, the change of defect concentration dominates the variation of the I2 value.
Compared with the other samples, a significant increase in I2 was observed in the DGO, which indicates that the deoxygenation process results in a large increase of vacancy-like defects on the outer surface. Because the average numbers of aromatic layers in the investigated samples are approximately two or three layers from AFM, τ2 and I2 can be directly correlated with the annihilation of positrons in the defects of the graphene “bulk”. In addition, a large decrease in the τ2 value was observed, which indicates a slight decrease in defect size. This can be attributed to the hydroxyl and epoxide groups on the surface of the GO, which will be converted into carbon dioxide and remove carbon atom from the surface, generating small defects. Furthermore, the observed intensity ratios I2![[thin space (1/6-em)]](https://www.rsc.org/images/entities/char_2009.gif) :I1 of the three samples gradually increased with increasing defects on each crystalline grain. Such behavior can be attributed to decreased particle sizes and increased numbers of defects. The peaks in the XRD pattern of DGO significantly decrease and the half-peak width significantly increases, which is equivalent to the crystalline grain becoming smaller. The size of GO decreases to a hundred nanometers when it was deoxygenated to DGO, as SEM image showed. τm is sensitive to uncertainties in the decomposition. For GO, the average lifetime was 373.55 ps, which is much greater than that in DGO. This provides strong evidence of the existence of large vacancy-type defects in the GO samples, and small vacancy-type defects in the DGO sample.
:I1 of the three samples gradually increased with increasing defects on each crystalline grain. Such behavior can be attributed to decreased particle sizes and increased numbers of defects. The peaks in the XRD pattern of DGO significantly decrease and the half-peak width significantly increases, which is equivalent to the crystalline grain becoming smaller. The size of GO decreases to a hundred nanometers when it was deoxygenated to DGO, as SEM image showed. τm is sensitive to uncertainties in the decomposition. For GO, the average lifetime was 373.55 ps, which is much greater than that in DGO. This provides strong evidence of the existence of large vacancy-type defects in the GO samples, and small vacancy-type defects in the DGO sample.
DGO has a crashed crystalline grain with the scale of the defects in the bulk material similar to graphite. The process of deoxygenation first occurs from the edge of the defects, and the bigger defects break which the crystalline grain crashes into a smaller one. The deoxygenation process decreases the concentration of oxygen groups. This situation causes the annihilation of positron sampling electron in the defect areas, because the oxygen groups around defects will disturb the annihilation of the positron sampling electron density.46 This results in an increase in I2. In addition, the hydroxyl and epoxide groups on the surface of the GO will generate new defects, which correspond to the proposed mechanism.
4. Conclusions
In this study, DGO was successfully fabricated by K2CO3 as a deoxygenation agent, and K2CO3 was also confirmed to be recyclable. AFM characterization proves that DGO has 2 to 3 layers of hundred nm in width. No significant evident graphitization tendency was observed from X-ray diffraction measurement. The Raman spectrum and positron lifetime spectrometer show the defection remaining on the DGO due to the oxygen function groups decomposition. Also the oxygen functional groups are almost completely reduced by K2CO3 even for recycled K2CO3. The by-production (CO2) was completely adsorbed by K2CO3 solution, avoiding the release to air. The mechanism was studied as well. AFM and positron lifetime spectrometer reveals the deoxygenation led the GO particles splitted smaller pieces, which was also be observed by SEM. It was demonstrated that the K2CO3 reduction reaction starts from the edge of the defects generated by the oxygen functional groups in GO. Due to the low reaction temperature and the free of strong acids and bases, such an eco- and environmental-friendly K2CO3 induction is possible for the large scale production of grapheme in the future.Acknowledgements
This work was supported by the National Program on Key Basic Research Project of China (973 Program) (Grant no: 2010CB635109) and the Fundamental Scientific Research Funds for Chinese Academy of Tropical Agricultural Sciences (Project no. 1630062013011) and Natural Science Foundation of Hainan Province, China (Project no. 214038).References
- E. Yoo and H. Zhou, RSC Adv., 2014, 4, 11798–11801 RSC.
- P. Routh, R. K. Layek and A. K. Nandi, Carbon, 2012, 50, 3422–3434 CrossRef CAS PubMed.
- P. Bhattacharya, S. Dhibar, G. Hatui, A. Mandal, T. Das and C. K. Das, RSC Adv., 2014, 4, 17039–17053 RSC.
- A. Ambrosi, C. K. Chua, A. Bonanni and M. Pumera, Chem. Rev., 2014, 114, 7150–7188 CrossRef CAS PubMed.
- C.-Y. Chang, S.-P. Ju, J.-W. Chang, S.-C. Huang and H.-W. Yang, RSC Adv., 2014, 4, 26074–26080 RSC.
- J. Zhu, M. Chen, Q. He, L. Shao, S. Wei and Z. Guo, RSC Adv., 2013, 3, 22790–22824 RSC.
- A. K. Geim, Science, 2009, 324, 1530–1534 CrossRef CAS PubMed.
- K. S. Novoselov, A. K. Geim, S. V. Morozov, D. Jiang, Y. Zhang, S. V. Dubonos, I. V. Grigorieva and A. A. Firsov, Science, 2004, 306, 666–669 CrossRef CAS PubMed.
- S. Stankovich, D. A. Dikin, R. D. Piner, K. A. Kohlhaas, A. Kleinhammes, Y. Jia, Y. Wu, S. T. Nguyen and R. S. Ruoff, Carbon, 2007, 45, 1558–1565 CrossRef CAS PubMed.
- A. K. Geim and K. S. Novoselov, Nat. Mater., 2007, 6, 183–191 CrossRef CAS PubMed.
- S. Park and R. S. Ruoff, Nat. Nanotechnol., 2009, 4, 217–224 CrossRef CAS PubMed.
- A. Reina, X. Jia, J. Ho, D. Nezich, H. Son, V. Bulovic, M. S. Dresselhaus and J. Kong, Nano Lett., 2008, 9, 30–35 CrossRef PubMed.
- H. Chen, W. Zhu and Z. Zhang, Phys. Rev. Lett., 2010, 104, 186101 CrossRef.
- Y. Si and E. T. Samulski, Nano Lett., 2008, 8, 1679–1682 CrossRef CAS PubMed.
- B. C. Brodie, Ann. Chim. Phys., 1860, 59, 466–472 Search PubMed.
- L. Staudenmaier, Ber. Dtsch. Chem. Ges., 1898, 31, 1481–1487 CrossRef CAS.
- W. S. Hummers and R. E. Offeman, J. Am. Chem. Soc., 1958, 80, 1339 CrossRef CAS.
- X. Li, X. Wang, L. Zhang, S. Lee and H. Dai, Science, 2008, 319, 1229–1232 CrossRef CAS PubMed.
- G. Wang, J. Yang, J. Park, X. Gou, B. Wang, H. Liu and J. Yao, J. Phys. Chem. C, 2008, 112, 8192–8195 CAS.
- R. Muszynski, B. Seger and P. V. Kamat, J. Phys. Chem. C, 2008, 112, 5263–5266 CAS.
- N. Mohanty, A. Nagaraja, J. Armesto and V. Berry, Small, 2010, 6, 226–231 CrossRef CAS PubMed.
- Y. Zhu, M. D. Stoller, W. Cai, A. Velamakanni, R. D. Piner, D. Chen and R. S. Ruoff, ACS Nano, 2010, 4, 1227–1233 CrossRef CAS PubMed.
- M. J. Fernández-Merino, L. Guardia, J. I. Paredes, S. Villar-Rodil, P. Solís-Fernández, A. Martínez-Alonso and J. M. D. Tascón, J. Phys. Chem. C, 2010, 114, 6426–6432 Search PubMed.
- Z. Fan, K. Wang, T. Wei, J. Yan, L. Song and B. Shao, Carbon, 2010, 48, 1686–1689 CrossRef CAS PubMed.
- A. M. Abdelkader, C. Vallés, A. J. Cooper, I. A. Kinloch and R. A. W. Dryfe, ACS Nano, 2014, 11, 11225–11233 CrossRef PubMed.
- S. Liu, J. Tian, L. Wang and X. Sun, Carbon, 2011, 49, 3158–3164 CrossRef CAS PubMed.
- S. Zhang, Y. Shao, H. Liao, M. H. Engelhard, G. Yin and Y. Lin, ACS Nano, 2011, 5, 1785–1791 CrossRef CAS PubMed.
- Y. Wang, Z. Shi and J. Yin, ACS Appl. Mater. Interfaces, 2011, 3, 1127–1133 CAS.
- W. Zhang, J. Cui, C. A. Tao, Y. Wu, Z. Li, L. Ma, Y. Wen and G. Li, Angew. Chem., 2009, 48, 5864–5868 CrossRef CAS PubMed.
- X. Fan, W. Peng, Y. Li, X. Li, S. Wang, G. Zhang and F. Zhang, Adv. Mater., 2008, 20, 4490–4493 CrossRef CAS.
- I. Janowska, D. Bégin, O. Ersen, M. S. Moldovan, K. Chizari, M. J. Ledoux and C. Pham-Huu, Phys. E, 2012, 44, 1009–1011 CrossRef CAS PubMed.
- D. R. Dreyer, S. Park, C. W. Bielawski and R. S. Ruoff, Chem. Soc. Rev., 2010, 39, 228–240 RSC.
- S. Zecevic, E. M. Patton and P. Parhami, Carbon, 2004, 42, 1983–1993 CrossRef CAS PubMed.
- N. J. Cherepy, R. Krueger, K. J. Fiet, A. F. Jankowski and J. F. Cooper, J. Electrochem. Soc., 2005, 152(1), A80–A87 CrossRef CAS PubMed.
- V. Gómez-Serrano, M. Acedo-Ramos, A. J. López-Peinado and C. Valenzuela-Calahorro, Fuel, 1994, 73, 387–395 CrossRef.
- D. Cao, G. Wang, C. Wang, J. Wang and T. Lu, Int. J. Hydrogen Energy, 2010, 35, 1778–1782 CrossRef CAS PubMed.
- X. Li, Z. Zhu, J. Chen, R. De Marco, A. Dicks, J. Bradley and G. Lu, J. Power Sources, 2009, 186, 1–9 CrossRef CAS PubMed.
- X. Li, Z. Zhu, R. De Marco, J. Bradley and A. Dicks, J. Power Sources, 2010, 195, 4051–4058 CrossRef CAS PubMed.
- B.-S. Nguyen, J.-F. Lin and D.-C. Perng, ACS Appl. Mater. Interfaces, 2014, 6, 19566–19573 CAS.
- S. Fujii and T. Enoki, J. Am. Chem. Soc., 2010, 132, 10034–10041 CrossRef CAS PubMed.
- P. Kirkegaard and M. Eldrup, Comput. Phys. Commun., 1974, 7, 401–409 CrossRef CAS.
- S. W. Provencher, Comput. Phys. Commun., 1982, 27, 229–242 CrossRef.
- R. B. Gregory and Y. Zhu, Nucl. Instrum. Methods Phys. Res., Sect. A, 1990, 290, 172–182 CrossRef.
- S. J. Wang and Y. C. Jean, Phys. Rev. B: Condens. Matter Mater. Phys., 1988, 37, 4869–4874 CrossRef CAS.
- P. J. Hautojärvi, Mater. Sci. Forum, 1994, 175–178, 47–58 Search PubMed.
- Z. Q. Chen, A. Uedono, A. Ogura, H. Ono, R. Suzuki, T. Ohdaira and T. Mikado, Appl. Surf. Sci., 2002, 194, 112–115 CrossRef CAS.
Footnote |
| † Electronic supplementary information (ESI) available. See DOI: 10.1039/c4ra14511a |
| This journal is © The Royal Society of Chemistry 2015 |