Investigation of dendrimers functionalized with eosin as macrophotoinitiators for polymerization-based signal amplification reactions

K. Kaastrup and H. D. Sikes*
Department of Chemical Engineering, Massachusetts Institute of Technology, Cambridge, MA 02139, USA. E-mail: sikes@mit.edu

Received 13th November 2014 , Accepted 26th January 2015

First published on 26th January 2015


Abstract

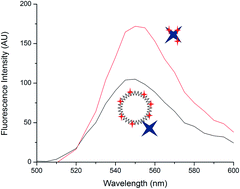
Polymerization-based signal amplification, a technique developed for use in rapid diagnostic tests, hinges on the ability to localize initiators as a function of interfacial binding events. A number of strategies are available for increasing this local concentration, including increasing the capture probe density, using higher affinity binding molecules, or, as presented here, directly conjugating additional initiators to the detection reagent through the use of functionalized polymers. We have previously considered poly(acrylic acid-co-acrylamide) backbones for this purpose; with eosin as the photoinitiator, these efforts were hindered by solubility limitations. Here, we use a poly(amidoamine) dendrimer as a scaffold to produce conjugates with enhanced solubility. Through an investigation into the surface binding and solution-phase properties of these conjugates, we show that quenching effects impact the efficacy of these conjugates as macrophotoinitiators.

Introduction

Photopolymerization-based signal amplification1–4 is an inexpensive and rapid technique that presents an alternative to traditional methods for signal amplification5,6 in molecular diagnostics. This technique links a radical polymerization reaction with molecular recognition at a surface through the use of photoinitiator-coupled affinity reagents. With an adequate dose of light and multi-acrylate monomers, the resulting hydrogel is visible to the unaided eye and easy to interpret. This technique has been demonstrated in a variety of contexts, including the detection of proteins,3,7–11 DNA hybridization,3,12–14 and epigenetic modifications of DNA using protein–DNA binding events.15

The polymerization reaction in these assays is dependent on whether the minimum surface initiator density required for propagation reactions to become competitive with inhibition reactions is exceeded. Reducing the number of binding events required to achieve this threshold initiator density could improve sensitivity and enable the extension of this technique to a number of clinical assays, including epigenotyping assays, for which the currently reported sensitivity precludes analysis of samples derived from needle biopsies.15

The relevant tunable parameters for improving assay sensitivity have been outlined in previous work;11 these include kinetic and thermodynamic characteristics of the molecular recognition events, surface density of capture probes, and assay conditions such as incubation time. We and others have made efforts to improve sensitivity by increasing the number of initiators localized per binding event using macroinitiators for both photopolymerization-based1,16,17 and ATRP-based signal amplification reactions.18 These macroinitiators consist of a poly(acrylic acid-co-acrylamide) backbone conjugated to initiating molecules and neutravidin or streptavidin (proteins for molecular recognition). Streptavidin and neutravidin are used for their high affinity for biotin (Kd ∼ 10−15 M). As an alternative to molecular recognition, the He Group has also employed electrostatic interactions in the construction of an ATRP macroinitiator for universal DNA detection with peptide nucleic acid probes. The ATRP macroinitiator improved the limit of detection by 60 times in comparison with single-initiator tagged DNA detection.19

Efforts to further improve the sensitivity of photoinitiated polymerization-based signal amplification through the synthesis of more densely photoinitiator-labeled macroinitiators have been stymied by the poor solubility of eosin, a photoinitiator, in water.17 A more water soluble xanthene derivative, fluorescein, was used in the first demonstration of how sensitivity improves as the number of photoinitiators localized per recognition event increases.16 However, in order to initiate polymerization localized near a surface with 105 biotin per μm2, it was necessary to couple more than 70 fluorescein substituents to the polymer. This contrasts sharply with the sensitivity achieved using eosin; a conjugate consisting of just three eosin coupled to avidin is able to initiate polymerization from surfaces with only 15 biotin per μm2.4 Fluorescein is a less efficient photoinitiator as it lacks eosin's heavy bromine atoms and thus less readily undergoes intersystem crossing to the triplet state, from which it can react with a tertiary amine coinitiator to form tertiary amine radicals capable of initiating the polymerization reaction.20

More recently, Lee and Sikes showed that for the same poly(acrylic acid-co-acrylamide) backbone, solubility limitations restricted the maximum average number of eosin per chain to 15.17 Lee and Sikes varied the number of eosin per polymer between 2 and 15, finding that the fluorescence intensity of the target spots attained a maximum for a polymer with 10 eosin but, counter-intuitively, decreased when the number of eosin was further increased to 15. In this case, poor solubility suggested the possibility of solution phase aggregates that would be expected to decrease the level of specific binding of the macroinitiator to the surface, leading to decreased sensitivity.

We hypothesize that an alternative scaffold may enable an increase in the number of initiators localized per binding event while, critically, remaining sufficiently soluble to enable surface binding. Towards this end, we conjugated eosin and neutravidin to poly(amidoamine) (PAMAM) dendrimers. Dendrimers present an attractive scaffold for initiator coupling as their exterior layer contains functional groups that lend themselves to modification. Dendrimers have been used in the construction of fluorescent probes for biological applications, including the fluorescence labeling of antibodies,21 as scaffolds for conjugating two different dyes to produce a ratiometric sensor,22,23 and as photostable nanoprobes for high-resolution imaging.24 In addition to increasing the number of fluorophores per protein, one of the potential advantages of using fluorescent dendrimers conjugated to proteins rather than directly derivatizing the protein is preservation of its activity.21 Here, we varied the number of eosin substituents conjugated per dendrimer and tested the conjugates in photopolymerization-based signal amplification reactions. As hypothesized, using dendrimer scaffolds improved solubility and allowed for a greater extent of eosin derivatization. However, photophysical factors interfered with their photoinitiation capability. We used solution-phase spectroscopy to elucidate these factors.

Results and discussion

Conjugates

A generation 7 (G7) poly(amidoamine) (PAMAM) dendrimer was partially carboxylated25 prior to reaction of the remaining amines with eosin 5-isothiocyanate (EITC). Carbodiimide coupling chemistry was then employed to activate the carboxylic groups of the dendrimers for reaction with neutravidin. The preparation of these conjugates is summarized in Scheme 1. After thorough purification, the conjugates were characterized by absorbance spectroscopy (Fig. S1 and S2). Dendrimer conjugates (1–3) were prepared with an average of 7, 14, and 24 eosin per dendrimer, respectively. Conjugation of neutravidin to conjugates 1–3 resulted in conjugates 4–6. On average, no more than one neutravidin was coupled per dendrimer. In addition to the three conjugates, eosin was coupled directly to neutravidin (Fig. S2) to serve as a reference conjugate with an average of 6 eosin per neutravidin. Because neutravidin binding to surface immobilized biotin is the relevant biomolecular interaction, dilutions were prepared at neutravidin-matched concentrations and we report all concentrations throughout on a mass of neutravidin per volume basis.
image file: c4ra14466j-s1.tif
Scheme 1 Preparation of conjugates 1–6. (a) Generation 7 poly(amidoamine) dendrimers were partially carboxylated via reaction with succinic anhydride. Following removal of unreacted succinic anhydride by gel filtration, the dendrimers were reacted with 10, 16, or 40-fold excess of eosin-5-isothiocyanate. The dendrimers were subsequently purified by gel filtration and dialysis and lyophilized prior to conjugation with neutravidin using EDC/NHSS to activate the dendrimers' carboxylic acid functional groups. (b) Summary of the calculated number of eosin and neutravidin per dendrimer for conjugates 4–6. DMSO: dimethyl sulfoxide, EDC: N-(3-dimethylaminopropyl)-N′-ethylcarbodiimide hydrochloride, NHSS: N-hydroxysulfosuccinimide.

Interfacial performance

In the assessment of new conjugates for polymerization-based signal amplification reactions, the primary functional properties of interest include the level of specific binding and the level of nonspecific binding. To date, the fluorescence signal of conjugates bound to surface-immobilized DNA labeled with biotin (Fig. 1a) has served as a useful metric for comparing the performance of different conjugates.16,17
image file: c4ra14466j-f1.tif
Fig. 1 Interfacial binding. (a) Schematic diagram of a test surface. The outer “Γ” is designated row 1 and contains the highest interfacial density of biotin-labeled oligonucleotides. The interfacial concentration of biotin decreases with each subsequent row consisting of three spots. The final row contains three spots of buffer without any biotinylated oligonucleotide. (b) Fluorescence image of test surfaces following incubation with neutravidin–eosin (left) and conjugate 6 (right), each 10 μg mL−1 on a neutravidin basis (intensity scale: 0–1500). (c) Summary of the mean fluorescence intensities for each set of replicate features from the array. The mean fluorescence intensities comprise the surface features from two test surfaces with error bars denoting the standard deviation about the mean. Bkgd: background (area surrounding surface features).

Fig. 1b shows that binding of 4–6 was specific to those areas with chemically coupled biotin. This specificity was further corroborated by the lack of surface binding observed for (neutravidin-free) 3 (Fig. S3).

To be sure that the concentrations used in Fig. 1 were sufficient to saturate the available interfacial binding sites, test surfaces were incubated with conjugate dilutions prepared at 5, 10, and 20 μg mL−1 prior to fluorescence scanning. With 4–6, increasing the neutravidin concentration from 5 to 20 μg mL−1 did not produce a statistically significant increase in fluorescence intensity across the surface.

(Fig. 1c and S4), suggesting that binding site saturation was effectively achieved at 5 μg mL−1. For the neutravidin–eosin conjugate, however, increasing the concentration from 5 to 10 μg mL−1 resulted in a doubling of the fluorescence intensity, while further increasing the concentration had no effect on the specific signal, indicating saturation at 10 μg mL−1. Fig. 1c shows that increasing the number of eosin per dendrimer by a factor of 2 from 7 (4) to 14 (5) did not result in an increase in fluorescence intensity, possibly indicating that 4 has a smaller hydrodynamic radius, thereby allowing more conjugate binding at the surface relative to 5. Further increasing the number of eosin per dendrimer to 24 (6) resulted in an increase in the fluorescence intensity. However, the signal from the neutravidin–eosin conjugate was more than three times that of 6.

The average background fluorescence intensities are presented in Fig. 2. The background fluorescence intensity for the neutravidin–eosin conjugate increases with increasing concentration, following the expected trend for nonspecific adsorption. In contrast with previous work in which increasing the number of eosin per polymer from 2 to 15 resulted in an increase in nonspecific adsorption,17 neither increasing the concentration of the conjugates nor the number of eosin substituents resulted in an increase in the background fluorescence intensity. This deviation from the expected trend could indicate fluorescence quenching or that the dendrimer conjugates are less hydrophobic than the polymers prepared in earlier work or a combination of the two.


image file: c4ra14466j-f2.tif
Fig. 2 Mean background fluorescence intensity for each conjugate for increasing neutravidin concentration. The background fluorescence intensity for the neutravidin–eosin conjugate follows the expected trend, increasing with increasing concentration. However, the background fluorescence intensities for the dendrimer conjugates do not follow any clear trend.

Following interfacial fluorescence analysis, the conjugate-bound test surfaces were contacted with aqueous solutions of monomers and amine coinitiators and initiating light as previously described.4 The binding of the dendrimer conjugates to surface-immobilized biotin and subsequent photopolymerization are illustrated in Scheme 2. At 10 μg mL−1 neutravidin, the limit of detection for the neutravidin–eosin conjugate was 15 biotin per μm2 (Fig. 3a). As shown in Fig. 1c, this limit corresponds to a fluorescence intensity of 190 ± 12, implying that for features with higher fluorescence intensities, the initiator density should be above the threshold for polymerization. Only 6 produced fluorescence intensities above this level and only for features with more than 100 biotin per μm2. One of four surfaces tested resulted in polymerization for these features (Fig. 3b), suggesting that the initiator density is near the threshold for polymerization4 where inhibition reactions compete effectively with initiation and propagation reactions. We have observed similar stochastic outcomes with replicates in past work just below the reported limits of detection.4,11


image file: c4ra14466j-s2.tif
Scheme 2 Using dendrimer conjugates for colorimetric detection of molecular recognition. Generation 7 poly(amidoamine) dendrimers conjugated to a photoinitiator (eosin) and neutravidin bind to biotinylated oligonucleotides immobilized at a glass surface. Following the addition of an aqueous monomer solution and 522 nm light, a hydrogel forms in areas specifically bound by the conjugate.

image file: c4ra14466j-f3.tif
Fig. 3 Polymerization results for surfaces incubated with (a) neutravidin–eosin and (b) conjugate 6 (each 10 μg mL−1 on a neutravidin basis). The hydrogels on the surface incubated with conjugate 6 are thinner than those on the surface incubated with the neutravidin–eosin as indicated by the intensity of the staining.

Solution-phase spectroscopy

To better understand the results presented in Fig. 1 and 2, the conjugate dilutions were evaluated using solution-phase spectroscopy. We wished to assess whether the formation of aggregates in solution or a quenching phenomenon may explain the reduced surface fluorescence observed using 4–6 relative to eosin coupled directly to neutravidin (Fig. 1c). In comparison with much of the previous work with modified dendrimers and in particular those looking at dendrimer aggregation,26 we were operating in a relatively dilute regime (0.2 μM versus 86 μM),26 precluding the use of common methods such as dynamic light scattering for assessing whether aggregates were present. Both absorbance and fluorescence measurements were performed. For the fluorescence measurements, emission was monitored between 500 and 600 nm with excitation at 450 nm. Neither the presence of the dendrimer nor the progressive increase in the number of eosin per conjugate produced spectral shifts (Fig. 4 and S5), which can be indicative of chromophore aggregation.27,28 Upon excitation, conjugates 4–6 and the physical mixture of the dendrimer and neutravidin–eosin each emitted less light than neutravidin–eosin alone, a finding that we investigated further as a function of concentration (Fig. 5).
image file: c4ra14466j-f4.tif
Fig. 4 Emission spectra following excitation at 450 nm for 20 μg mL−1 of each conjugate (neutravidin basis) as well as neutravidin–eosin to which an equimolar amount of free dendrimer was added. The spectra are corrected for the background fluorescence of the buffer solution (a) and normalized by peak height (b). At the highest concentration assayed (shown) spectral shifts are not evident.

image file: c4ra14466j-f5.tif
Fig. 5 Solution spectroscopy. (a) Peak absorbances (525 nm) for dilutions of conjugates 4–6 with concentrations given on a neutravidin basis. (b) Peak absorbances (525 nm) for dilutions of neutravidin–eosin alone and, as an additional comparison, neutravidin–eosin to which an equimolar concentration of free dendrimer (G7) was added. (c) Fluorescence emission at 545 nm (excitation at 450 nm) for the dilution series presented in (a). (d) Fluorescence emission at 545 nm (excitation at 450 nm) for the dilution series presented in (b). The absorbance and fluorescence emission values have been normalized by multiplication with the number of neutravidin conjugated per dendrimer. Three trials were averaged in all cases. Mechanisms underlying the observed trends are considered in the text.

Fig. 5 shows the peak absorbance at 525 nm as well as the peak fluorescence emission at 545 nm for the conjugate dilutions at 5, 10, and 20 μg mL−1 neutravidin (full emission spectra presented in Fig. 4 and S5). For comparison, results for dilutions of neutravidin–eosin, both with and without an equimolar amount of free dendrimer added, are included (Fig. 5b and d). Although the absorbance values for 5 and 6 (Fig. 5a) were higher than for the corresponding neutravidin–eosin dilutions (Fig. 5b), in both cases, the emission was lower than for the neutravidin–eosin conjugate (Fig. 5c vs. d). The emission measurements suggest that, rather than relaxing from the excited state to the ground state via fluorescence, the eosin molecules lost energy nonradiatively. The reduction in emission upon the addition of the free dendrimer to the neutravidin–eosin dilutions indicates that the dendrimer quenched eosin fluorescence. Quenching is frequently characterized using Stern–Volmer plots; these have been used previously to characterize quenching of BSA fluorescence by PAMAM dendrimers.29 Here, the Stern–Volmer plot generated for eosin with increasing amounts of dendrimer added is nonlinear (Fig. S6), indicating that quenching is likely not the result of a diffusive process.30

To further investigate the mechanism of quenching, the pH of the dilutions was reduced. Previous work has shown that the tertiary amines of dendrimers are capable of reductively quenching the excited states of fluorescent molecules.31,32 Below pH 4, all of the primary and tertiary amines are protonated,33 so the pH was reduced to 3.5. This reduction in pH increased the emission from mixtures of neutravidin–eosin with free dendrimer added to the levels measured for dilutions of neutravidin–eosin alone (Fig. 6). However, reducing the pH did not have a similar effect on the emission from 6, implying the existence of an alternative quenching mechanism for eosin covalently bound to a dendrimer.


image file: c4ra14466j-f6.tif
Fig. 6 Effect of pH on fluorescence intensity. Dilutions of neutravidin–eosin, both with and without an equimolar concentration of free dendrimer (G7), and conjugate 6 were prepared at 10 μg mL−1 in the original buffer (pH 7) and in a second buffer for which the pH had been reduced to 3.5 with HCl. The samples were excited with 450 nm light and the resulting emission at 545 nm measured. Reducing the pH should protonate the tertiary amines of the dendrimer and suppress quenching if the quenching mechanism involves an electron transfer from the tertiary amines to the excited state of eosin. Reducing the pH increased the fluorescence emission for the dilution of neutravidin–eosin with free dendrimer, but had no effect on dendrimer conjugate 6.

The reduced fluorescence of the dendrimer conjugates relative to the neutravidin–eosin conjugate could be an indication that locally high concentrations of eosin on the dendrimer surfaces promote self-quenching. The reduction in fluorescence intensity observed when increasing amounts of fluorescein were coupled to G0–G2 (ref. 21) and G5 (ref. 34) PAMAM dendrimers was attributed to self-quenching. Here, increasing the number of fluorophores enhanced the signal. Yet, if we normalize the emission by each conjugate's absorbance, we see that the normalized emission decreased as the number of eosin substituents per dendrimer increased (Fig. S7). Kim et al. also observed a reduction in normalized emission when the number of Cy5 coupled to G5 PAMAM dendrimers was increased from 0.8 to 8; this was attributed to weak excitonic coupling between the dye molecules on the dendrimers.24

Finally, for both the dendrimer and poly(acrylic acid-co-acrylamide) conjugates, the limit of detection for the polymer conjugates was higher than for neutravidin directly coupled to eosin. For the poly(acrylic acid-co-acrylamide) system, the observations of decreased solubility and increasing levels of nonspecific binding with increasing eosin substitution suggested the possibility of solution phase aggregates. In this work, solubility was improved even for higher degrees of eosin labeling; however, fluorescence quenching mechanisms were evident in solution-phase measurements. Susceptibility to quenching is a feature that distinguishes photopolymerization from the other chemistries that have been used for polymerization-based signal amplification; these include atom-transfer radical polymerization (ATRP),35,36 reversible addition–fragmentation chain transfer polymerization (RAFT),37 and enzyme-mediated redox polymerization.38 For both photopolymerization-based and RAFT-based signal amplification, macroinitiators have been shown to contribute to an enhancement in photoinitiation efficiency.16,18,19 This work provides the first demonstration of a macrophotoinitiator for which a quenching limit was encountered, highlighting the impact of complex photophysical phenomena on macrophotoinitiator performance.

Conclusions

A body of work has established that the interfacial density of initiators determines the sensitivity obtained when polymerization reactions are used to provide signal amplification in bioassays. It follows that increasing the number of initiators localized per binding event may improve sensitivity. This strategy has provided improved sensitivity for several combinations of initiators (2-hydroxy-1-[4-(2-hydroxyethoxy)phenyl]-2-methyl-1-propanone, fluorescein/tertiary amine, bromoisobutyrate) and polymeric scaffolds (poly(acrylic acid-co-acrylamide), polylysine) that present functional groups for modification with both initiators and moieties that are capable of either molecular recognition or useful electrostatic interactions. The eosin/tertiary amine initiation system is attractive in comparison with the above-mentioned initiators because it allows for reaction times on the seconds timescale under ambient conditions. However, eosin has exhibited more complex behavior than these other initiation systems upon incorporation into macroinitiators. Coupling eosin directly to proteins has provided superior sensitivity. The partially carboxylated G7 PAMAM dendrimer scaffold solved the solubility limitation that was encountered in past work with poly(acrylic acid-co-acrylamide) scaffolds, but a new quenching limitation has been identified here and investigated mechanistically. Future efforts to design eosin macroinitiators should include a feature that increases the separation between eosin molecules, or conjugation of eosin directly to proteins should be accepted as the design that provides the greatest sensitivity.

Experimental

Materials

Poly(amidoamine) (PAMAM) dendrimer (ethylenediamine core, generation 7), N-(3-dimethlaminopropyl)-N′-ethylcarbodiimide hydrochloride (EDC), dimethyl sulfoxide, poly(ethylene glycol) diacrylate, triethanolamine, 1-vinyl-2-pyrrolidinone, eosin Y disodium salt, succinic anhydride, Tween® 20, and MES solution were purchased from Sigma Aldrich. N-Hydroxysulfosuccinimide (NHSS), no-weigh format, NeutrAvidin Protein, and Blocker BSA in PBS (10×) were purchased from Thermo Scientific. Eosin 5-isothiocyanate (EITC) was obtained from Marker Gene Technologies. Calibration chips were purchased from InDevR. Amicon Ultra-4 Centrifugal Filter Units with Ultracel-100 membranes and Amicon Ultra-0.5 Centrifugal Filter Units with Ultracel-30 membranes were purchased from EMD Millipore. PD-10 desalting columns were purchased from GE Healthcare. UltraCruz™ Micro G-25 Spin Columns were obtained from Santa Cruz Biotechnology. Black 96-well microplates were purchased from Corning. Clear 96-well microplates were purchased from Grenier Bio-One. AMRESCO Denhardt's solution (100×) was purchased from BioExpress. AMRESCO phosphate buffered saline (10×) was purchased from VWR. ACS grade methanol and 2 N hydrochloric acid were purchased from BDH. Sodium chloride, sodium phosphate monobasic, and sodium phosphate dibasic were purchased from Mallinckrodt Chemicals.

Coupling of eosin to dendrimers

In order to improve water solubility, a generation 7 PAMAM dendrimer (0.043 μmol) was partially carboxylated with a 512-fold excess of succinic anhydride (22 μmol) in DMSO (1[thin space (1/6-em)]:[thin space (1/6-em)]1 ratio of dendrimer amines[thin space (1/6-em)]:[thin space (1/6-em)]succinic anhydride). The reaction was stirred overnight at room temperature, after which unreacted succinic anhydride was removed by gel filtration. A 10, 16, or 40 fold excess (based on the initial mass of dendrimer reacted) of eosin 5-isothiocyanate (EITC) was then introduced and the reaction was once again stirred overnight at room temperature. Unreacted EITC was removed by gel filtration. The eosin-conjugated dendrimers were then dialyzed against water for 2 days and lyophilized. As the fold excess of eosin was increased, the fraction of conjugates that precipitated during dialysis increased. Because of this solubility limitation, increasing the fold excess further did not produce conjugates with higher eosin densities.

Conjugation of neutravidin to dendrimers

Prior to protein conjugation, ∼1 mg of the lyophilized product (1–3) was dissolved in 50 μL water and characterized using absorbance spectroscopy. 0.2–0.5 mg of 1–3 was then reacted with a 500-fold excess of EDC and sulfo-NHS in pH 6 0.1 M MES, 0.5 M NaCl buffer. In the final reaction volume, the dendrimer concentration was 6 μM with 3 mM EDC and 3 mM sulfo-NHS. After 15 minutes, a 2-fold molar excess of neutravidin dissolved in pH 7.5 0.1 M sodium phosphate buffer was introduced and the reaction was incubated at 4 °C overnight. The reaction volume was doubled during the neutravidin addition, thereby increasing the pH to favor the reaction between the neutravidin amines and the NHS-ester. The reaction resulted in conjugates with between 0.5 and 2 neutravidin per dendrimer. Variability in the number of neutravidin conjugated per dendrimer is likely a consequence of uncertainty in the initial mass measurements of 1–3. To avoid complications due to potential avidity effects, only products with an average of one or fewer neutravidin per dendrimer were used. For the purposes of assessing signal from polymers bound to a surface, a lower coupling efficiency is preferable as unconjugated dendrimers do not bind to the surface (Fig. S3). All dilutions were prepared on a neutravidin basis and, for the solution spectroscopy, absorbance and emission values were normalized by the number of neutravidin per dendrimer.

Following the overnight reaction, the samples were purified using a 100 kDa molecular weight cut-off centrifugal filter device to remove unreacted neutravidin. The samples were centrifuged at 4 °C according to the manufacturer's instructions and the filtration was repeated 5 times with pH 7 PBS.

Conjugate characterization

The filtered solutions were characterized using absorbance spectroscopy with a Tecan Infinite m200 microplate reader and a NanoQuant plate (path length = 0.05 cm). Extinction coefficients were determined from absorbance standard curves for the dendrimer, eosin, and neutravidin in PBS (Fig. S1). In each case, the absorbance standard curves were based on a minimum of two separate dilution sets. Absorbance spectroscopy was favored over H-NMR as it has been shown to be a more reliable method for quantifying the number of fluorophores conjugated per polymer.16,17 H-NMR analysis has also been shown to suffer in accuracy for the analysis of dendrimers due to the large difference in the number of dendrimer and dye protons.34 The number of eosin per dendrimer was determined from absorbance spectra collected for the lyophilized eosin–dendrimer products (conjugates 1–3). Prior to characterization, stock solutions were prepared with the lyophilized products; ∼1 mg was resuspended in 50 μL water. These stock solutions were then diluted by at least a factor of 10 with PBS so as to be within the linear range for absorbance measurements. The absorbance at 525 nm was used to determine the eosin concentration and the absorbance at 280 nm was used for the dendrimer concentration, accounting for eosin's absorbance at 280 nm. Following the neutravidin conjugation, the absorbance spectra for the purified samples (conjugates 4–6) were measured. The eosin concentration was determined from the absorbance at 525 nm and the concentration of the dendrimer was then calculated based on the previously determined number of eosin per dendrimer (for the corresponding conjugates 1–3). The 280 nm absorbance was used to determine the neutravidin concentration, this time accounting for absorbance by both eosin and the dendrimer. For each conjugate, a minimum of three absorbance spectra were collected and averaged. The concentrations, as calculated using the standard curves, are presented in Table S1. Finally, the samples were diluted with an equal volume of glycerol, aliquoted, and stored at −20 °C.

Preparation of neutravidin–eosin conjugates

To serve as a reference conjugate, eosin was conjugated directly to neutravidin. This reaction was performed according to the protocol outlined previously for streptavidin.2 1 mL of a 1 mg mL−1 solution of neutravidin was concentrated with a 30 kDa centrifuge filter and then diluted to 10 mg mL−1 with pH 9 0.1 M sodium bicarbonate buffer for a final volume of 100 μL. 10 μL of 10 mg mL−1 eosin 5-isothiocyanate (EITC) was then added and the reaction was placed at 4 °C overnight. Finally, the reaction was purified by gel filtration, characterized by absorbance spectroscopy (6 replicate measurements), and diluted with glycerol for storage at −20 °C.

Interfacial analysis using fluorescence

In order to verify the binding activity of 4–6 as well as compare the surface initiator density achieved using the dendrimer conjugates relative to a neutravidin–eosin conjugate, glass surfaces consisting of dilution arrays of biotinylated oligonucleotides were incubated with conjugate dilutions. The dilutions were prepared based on the neutravidin concentrations in order to normalize for the number of potential binding events as the biomolecular interaction of interest is neutravidin binding to surface immobilized biotin. Three concentrations (5, 10, 20 μg mL−1) were selected based on previous work in which 10 μg mL−1 of a streptavidin–eosin conjugate was shown to effectively saturate the binding sites on the surface.4 The dilutions were prepared in 0.5% BSA, 1.5× PBS, and 5× Denhardt's solution. The test surfaces were rinsed with water to remove residual salts prior to a 5 minute incubation with the dilutions. Following the incubation, the surfaces were rinsed sequentially with 0.1% Tween® 20 in PBS, PBS, and ddH2O to remove unbound conjugates. Once dry, the surfaces were scanned with a GenePix 4000B Microarray scanner (Molecular Devices, LLC). The wavelength was set to 532 nm with 500 PMT gain at 100% power. The fluorescence intensity of the arrays was later quantified in ImageJ. A minimum of 2 arrays was scanned for each condition. On each array, the highest density of biotin (row 1) is printed in an “Γ” comprising 11 spots. The following 7 dilutions as well as the final negative control row consisting of spotting buffer each comprise 3 spots.

The specificity of the dendrimer conjugates for biotin was verified by repeating the surface incubation with 0.27 μM of neutravidin–free dendrimer conjugate 3. This dendrimer was selected on the basis that it has the highest number of eosin per dendrimer and is thus the most likely to nonspecifically adhere to the surface. The concentration corresponds to the highest concentration of dendrimer used in the surface binding experiments (the dendrimer concentration when 20 μg mL−1 of neutravidin is used).

Interfacial polymerization

An aqueous monomer solution consisting of 200 mM poly(ethylene glycol) diacrylate (PEGDA), 150 mM triethanolamine (TEA), 100 mM vinyl-2-pyrrolidinone (VP), and 0.5 μM eosin Y was prepared. Following incubation with the conjugate dilutions described above and the subsequent rinsing steps, each array was contacted with 40 μL of this monomer solution and irradiated for 70 seconds with 522 nm light (30 mW cm−2) from an array of LEDs housed in an ampliPHOX reader (InDevR). The arrays were then rinsed with water at room temperature and stained with a 50 mM eosin Y solution in 50% methanol, 50% ddH2O for 2 minutes, after which the surfaces were rinsed one final time with water at room temperature and dried with compressed air. Each surface was imaged using the digital camera built into the ampliPHOX reader (InDevR) imaging bay. Four surfaces were polymerized for each conjugate dilution prepared at 10 μg mL−1 neutravidin (the concentration at which each conjugate saturated the available binding sites). Two surfaces each were polymerized for 5 and 20 μg mL−1.

Solution spectroscopy

The dilutions prepared above were analyzed by absorbance and fluorescence spectroscopy using a Tecan Infinite m200 microplate reader. The concentrations for each component are summarized in Table S2. 80 μL of the dilutions were added to clear and black 96-well plates for absorbance and fluorescence measurements, respectively. A volume of 80 μL results in a path length of approximately 0.23 cm. Absorbance was measured at 5 nm steps between 400 and 700 nm. Emission scans were performed for excitation at 525, 450, and 260 nm with emission measured at 5 nm steps between 545–650 nm, 500–600 nm, and 450–650 nm, respectively. 525 nm is eosin's peak absorbance wavelength, but measurements were performed for excitation at 450 and 260 nm in order to obtain a complete emission spectrum around the maximum emission peak at 545 nm. The absorbance at 525 nm and emission at 545 nm (for excitation at 450 nm) were normalized by the number of neutravidin coupled per dendrimer. Three separate trials (performed on separate days) were averaged in each case.

Acknowledgements

We acknowledge support from an NSF Graduate Research Fellowship (K.K.), a Burroughs Wellcome Fund Career Award at the Scientific Interface (H.D.S.) and the Department of Defense (Congressionally Directed Medical Research Program, Prostate Cancer Research Program) under Award no. W81XWH-13-1-0272. The opinions, interpretations, conclusions, and recommendations are those of the authors and are not necessarily endorsed by the Department of Defense.

Notes and references

  1. H. D. Sikes, R. R. Hansen, L. M. Johnson, R. Jenison, J. W. Birks, K. L. Rowlen and C. N. Bowman, Nat. Mater., 2008, 7, 52–56 CrossRef CAS PubMed.
  2. R. R. Hansen, H. D. Sikes and C. N. Bowman, Biomacromolecules, 2008, 9, 355–362 CrossRef CAS PubMed.
  3. L. R. Kuck and A. W. Taylor, BioTechniques, 2008, 45, 179–186 CrossRef CAS PubMed.
  4. K. Kaastrup and H. D. Sikes, Lab Chip, 2012, 12, 4055–4058 RSC.
  5. C. A. Valencia and B. Coffee, in Modern Clinical Molecular Techniques, ed. P. C. Hu, M. R. Hegde and P. A. Lennon, Springer, New York, NY, 2012, ch. 4, pp. 49–66 Search PubMed.
  6. J. Lei and H. Ju, Chem. Soc. Rev., 2012, 41, 2122–2134 RSC.
  7. H. D. Sikes, R. Jenison and C. N. Bowman, Lab Chip, 2009, 9, 653–656 RSC.
  8. H. J. Avens and C. N. Bowman, Acta Biomater., 2010, 6, 83–89 CrossRef CAS PubMed.
  9. H. J. Avens, E. L. Chang, A. M. May, B. J. Berron, G. J. Seedorf, V. Balasubramaniam and C. N. Bowman, J. Nanopart. Res., 2011, 13, 331–346 CrossRef CAS.
  10. H. J. Avens, B. J. Berron, A. M. May, K. R. Voigt, G. J. Seedorf, V. Balasubramaniam and C. N. Bowman, J. Histochem. Cytochem., 2011, 59, 76–87 CrossRef CAS PubMed.
  11. K. Kaastrup, L. Chan and H. D. Sikes, Anal. Chem., 2013, 85, 8055–8060 CrossRef CAS PubMed.
  12. R. R. Hansen, L. M. Johnson and C. N. Bowman, Anal. Biochem., 2009, 386, 285–287 CrossRef CAS PubMed.
  13. L. M. Johnson, H. J. Avens, R. R. Hansen, H. L. Sewell and C. N. Bowman, Aust. J. Chem., 2009, 62, 877–884 CrossRef CAS.
  14. L. M. Johnson, R. R. Hansen, M. Urban, R. D. Kuchta and C. N. Bowman, Biomacromolecules, 2010, 11, 1133–1138 CrossRef CAS PubMed.
  15. B. W. Heimer, T. A. Shatova, J. K. Lee, K. Kaastrup and H. D. Sikes, Analyst, 2014, 139, 3695–3701 RSC.
  16. J. K. Lee, B. W. Heimer and H. D. Sikes, Biomacromolecules, 2012, 13, 1136–1143 CrossRef CAS PubMed.
  17. J. K. Lee and H. D. Sikes, Macromol. Rapid Commun., 2014, 35, 981–986 CrossRef CAS PubMed.
  18. L. Xu, L. Yuan and S. Liu, RSC Adv., 2014, 4, 140–146 RSC.
  19. H. Qian and L. He, Sens. Actuators, B, 2010, 150, 594–600 CrossRef CAS PubMed.
  20. A. Zakrzewski and D. C. Neckers, Tetrahedron, 1987, 43, 4507–4512 CrossRef CAS.
  21. C. Wängler, G. Moldenhauer, R. Saffrich, E.-M. Knapp, B. Beijer, M. Schnölzer, B. Wängler, M. Eisenhut, U. Haberkorn and W. Mier, Chem.–Eur. J., 2008, 14, 8116–8130 CrossRef PubMed.
  22. L. Albertazzi, B. Storti, L. Marchetti and F. Beltram, J. Am. Chem. Soc., 2010, 132, 18158–18167 CrossRef CAS PubMed.
  23. L. Albertazzi, M. Brondi, G. M. Pavan, S. S. Sato, G. Signore, B. Storti, G. M. Ratto and F. Beltram, PLoS One, 2011, 6, e28450 CAS.
  24. Y. Kim, S. H. Kim, M. Tanyeri, J. A. Katzenellenbogen and C. M. Schroeder, Biophys. J., 2013, 104, 1566–1575 CrossRef CAS PubMed.
  25. J. H. Myung, K. A. Gajjar, J. Saric, D. T. Eddington and S. Hong, Angew. Chem., Int. Ed., 2011, 50, 11769–11772 CrossRef CAS PubMed.
  26. M. J. Jasmine, M. Kavitha and E. Prasad, J. Lumin., 2009, 129, 506–513 CrossRef CAS PubMed.
  27. A. H. Herz, Adv. Colloid Interface Sci., 1977, 8, 237–298 CrossRef CAS.
  28. O. Valdes-Aguilera and D. C. Neckers, Acc. Chem. Res., 1989, 22, 171–177 CrossRef CAS.
  29. B. Klajnert, L. Stanisławska, M. Bryszewska and B. Pałecz, Biochim. Biophys. Acta, 2003, 1648, 115–126 CrossRef CAS.
  30. J. R. Lakowicz, Principles of Fluorescence Spectroscopy, Springer, New York, NY, 3rd edn, 2006 Search PubMed.
  31. A. Archut, G. C. Azzellini, V. Balzani, L. De Cola and F. Vögtle, J. Am. Chem. Soc., 1998, 120, 12187–12191 CrossRef CAS.
  32. G. Pistolis, A. Malliaris, C. M. Paleos and D. Tsiourvas, Langmuir, 1997, 13, 5870–5875 CrossRef CAS.
  33. P. K. Maiti, T. Çaǧın, S.-T. Lin and W. A. Goddard III, Macromolecules, 2005, 38, 979–991 CrossRef CAS.
  34. C. A. Dougherty, J. C. Furgal, M. A. van Dongen, T. Goodson III, M. M. Banaszak Holl, J. Manono and S. DiMaggio, Chem.–Eur. J., 2014, 20, 4638–4645 CrossRef CAS PubMed.
  35. X. Lou, M. S. Lewis, C. B. Gorman and L. He, Anal. Chem., 2005, 77, 4698–4705 CrossRef CAS PubMed.
  36. Y. Wu, S. Liu and L. He, Anal. Chem., 2009, 81, 7015–7021 CrossRef CAS PubMed.
  37. P. He, W. Zheng, E. Z. Tucker, C. B. Gorman and L. He, Anal. Chem., 2008, 80, 3633–3639 CrossRef CAS PubMed.
  38. B. J. Berron, L. M. Johnson, X. Ba, J. D. McCall, N. J. Alvey, K. S. Anseth and C. N. Bowman, Biotechnol. Bioeng., 2011, 108, 1521–1528 CrossRef CAS PubMed.

Footnote

Electronic supplementary information (ESI) available: Additional figures as described in the text. See DOI: 10.1039/c4ra14466j

This journal is © The Royal Society of Chemistry 2015
Click here to see how this site uses Cookies. View our privacy policy here.