Sol–gel hydrothermal synthesis of microstructured CaO-based adsorbents for CO2 capture

Nwe Ni Hlaingabc, Srimala Sreekantan*a, Radzali Othmana, Swee-Yong Punga, Hirofumi Hinode*b, Winarto Kurniawanb, Aye Aye Thantc, Abdul Rahman Mohamedd and Chris Salimee
aSchool of Materials and Mineral Resources Engineering, Engineering Campus, Universiti Sains Malaysia, 14300 Nibong Tebal, Penang, Malaysia. E-mail: srimala@usm.my; nwenihlaing76@gmail.com; Fax: +60-604 5995215; Tel: +60-604 5941011
bDepartment of International Development Engineering, Tokyo Institute of Technology, 2-12-1 Ookayama, Meguro-ku, Tokyo, Japan. E-mail: hinode@ide.titech.ac.jp; Fax: +81-3-5734-3245; Tel: +81-3-5734-3245
cDepartment of Physics, University of Yangon, 11041 Kamayut, Yangon, Myanmar
dLow Carbon Economy (LCE) Research Group, School of Chemical Engineering, Engineering Campus, Universiti Sains Malaysia, 14300 Nibong Tebal, Penang, Malaysia
eEnvironmental Engineering, Surya University, Tangerang, 15810 Banten, Indonesia

Received 12th November 2014 , Accepted 15th December 2014

First published on 15th December 2014


Abstract

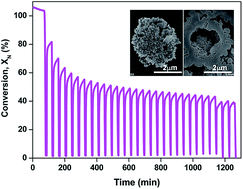
In this study, microstructured CaO-based adsorbents were synthesized by a sol–gel hydrothermal method using calcium nitrate tetrahydrate, citric acid and sodium hydroxide as precursors. Experiments with different NaOH concentrations (2, 6 and 10 M) were carried out to investigate the effects on the morphologies and CO2 adsorption activities of the synthesized adsorbents. X-ray diffraction (XRD) and field-emission scanning electron microscopy (FESEM) results showed that different NaOH concentrations resulted in different crystal phases and morphologies. A novel three-dimensional (3D) hierarchical calcite (CaCO3) hollow microspherical adsorbent composed of one-dimensional (1D) spike-shaped nanorods was obtained with 2 M NaOH. XRD analyses confirmed that the hierarchical CaCO3 hollow microspheres were characteristic of the calcite phase. The FESEM image revealed that the microspheres were composed of 1D spike-shaped nanorods with an average length of 500 nm. The cross-sectional FESEM image showed that the microspheres had hollow structures with an average inner cavity of 2 μm and a shell thickness of approximately 0.5 μm. The CO2 adsorption performance of the synthesized adsorbents was investigated using thermogravimetry-differential thermal analysis (TG-DTA) apparatus. The results indicated that the novel hierarchical calcite (CaCO3) hollow microspherical adsorbent composed of one-dimensional (1D) spike-shaped nanorods possessed higher carbonation conversion of 45% after 15 cycles, which was about 22% higher than that of other adsorbents synthesized with 6 and 10 M NaOH concentration and limestone. This property could be attributed to the 3D hierarchical hollow microsphere structure, 1D spike-shaped nanorod structure, trimodal pore size distribution and large BET surface area (44.85 m2 g−1) of the novel adsorbent.

1. Introduction

In recent years, three-dimensional (3D) hierarchical hollow microspheres composed of one-dimensional (1D) nanostructures have extensively attracted attention because of their well-defined morphology, low density, large surface area and high performance. These properties enable a wide range of potential applications, such as in adsorption and separation, energy conversion, electronics, optoelectronics, catalysis, sensors and drugs delivery.1–3 Therefore, various types of materials such as In2O3,4 SnO2,5 hydroxyapatite,6 V2O5,7 β-Ni(OH)2,8 ZnO,9 TiOSO4,10 MnO2,11 CuO,12 α-Fe2O3[thin space (1/6-em)]13 and CaCO3[thin space (1/6-em)]14–19 hierarchical hollow microspheres have been prepared by different synthesis methods such as hydrothermal, precipitation, solvothermal, mixing and gas-diffusion methods. Their applications in various fields are summarized in Table 1. Among these synthesis methods, hard and soft templates approaches are favourable for the formation of hollow spheres.1–19 However, hollow spheres prepared using the hard template route usually possess disadvantages related to high cost and tedious synthetic procedures such as rinsing and calcination or chemical etching to remove the templates; which not only destroys the core–shell structures, but is also time and energy-consuming. In addition, the size and morphology of the final hollow spheres mainly depend on the templates (e.g., SiO2 carbon spheres, polymers).20,21 Using the soft template (e.g., micelles, ionic liquid) route is relatively easier, however, large quantities of surfactants or functionalized organic acids are required. Moreover, the shape, shell thickness, and diameter distribution of the resulting hollow particles are difficult to control because of the deformability of the soft templates.1,21,22 In other words, both methods possess some disadvantages. Therefore, it is highly desirable to develop a new approach without templates for the preparation of 3D hierarchical hollow microspheres assembled by 1D nanostructure materials.
Table 1 Summary of different types of hierarchical hollow microspheres and their applications
Samples Templates/additives/solvents Method Application References
In2O3 Ethylenediamine Hydrothermal Gas sensors 4
SnO2 Sulfonated polystyrene hollow spheres Hydrothermal Anode materials for lithium-ion batteries 5
Hydroxyapatite Polyaspartic acid Hydrothermal Water treatment 6
V2O5 Polyvinylpyrrolidone and ethylene glycol Mixing Cathode material in lithium-ion batteries 7
β-Ni(OH)2 Urea Hydrothermal 8
ZnO Pluronic P123 and hexamethylenetetramine Solvothermal 9
TiOSO4 Glycerol and ethanol Solvothermal Photocatalytic 10
MnO2 Ethanol Mixing Waste-water treatment 11
CuO Hydrothermal Anode materials for lithium ion batteries 12
α-Fe2O3 Glycerol-quasiemulsion microdroplets Hydrothermal Anode materials for lithium-ion batteries 13
CaCO3 Polyvinylpyrrolidone and sodium dodecyl sulfonate Precipitation 14
CaCO3 Carboxyl-terminated hyperbranched polyglycerol Gas diffusion 15
CaCO3 Low methoxy pectin Precipitation 16
CaCO3 Soluble starch Mixing Anticancer drug carrier 17
CaCO3 Poly(ethylene oxide)-block-poly(methacrylic acid) and sodium dodecylsulfate 18
CaCO3 Polyoxyet hylene sorbitan monooleate Interfacial reaction Filler and coating pigment 19


Calcium carbonate is one of the most abundant natural minerals found in different polymorphs: three anhydrous crystalline polymorphs (calcite, aragonite, and vaterite) and three metastable forms (amorphous calcium carbonate (ACC), crystalline hexahydrate and crystalline monohydrate).23,24 Hierarchical CaCO3 hollow microspheres are attracting significant interest because of their excellent properties such as low density, high surface areas, and their potential application in industry (e.g., filler and coating pigment)19 and health care (e.g., anticancer drug carrier).17 Zhao and Wang14 synthesized hollow CaCO3 microspheres by the precipitation method employing polyvinylpyrrolidone with sodium dodecyl sulfonate as template for the controlled growth of hollow spheres. Butler et al.16 reported that low methoxy pectin played a key role in the formation of hollow shells of CaCO3. In 2008, Wei et al.17 reported the formation of hierarchical CaCO3 hollow microspheres using a soluble starch for anticancer drugs carriers. This application could be attributed to the biocompatibility, biodegradability, and pH-sensitive properties of CaCO3 hollow microspheres. Moreover, Enomae and Tsujino19 fabricated CaCO3 hollow spheres with polyoxyethylene sorbitan monooleate using the interfacial reaction method. They proposed CaCO3 hollow spheres to be used as a filler and paper coating pigment because hollow structure scatters more light, resulting to high brightness and opacity. According to literatures, the hierarchical CaCO3 hollow microspheres were mostly prepared using templates or additives, which lead to complicated synthesis procedures. These procedures are time and energy consuming, require toxic raw materials, produce pollutants from the removal of the templates and are costly. Therefore, an economical and environmental-friendly template-free synthesis method must be developed to fabricate CaCO3 hollow spheres from the scientific research and practical application point of view.25,26 To the best of our knowledge, no studies have been reported on the synthesis of 3D hierarchical calcite CaCO3 hollow microspherical adsorbent composed of one-dimensional (1D) spike-shaped nanorods for CO2 capture using the sol–gel hydrothermal method. Furthermore, most of these literatures focused on the hierarchical CaCO3 hollow microspheres as smart carriers for anticancer drugs, filler, and coating pigment, but not so much on CO2 capture.

To capture CO2 from power plants or industrial processes, several kinds of adsorbents and absorbents (such as amines, zeolite, activated carbon, metal–organic framework and calcium oxide) have been investigated.27 Currently, absorption mainly uses aqueous amine compounds (e.g., monoethanolamine (MEA) and diethanolamine (DEA)) is a commercialized technology for CO2 separation due to their selectivity for acidic gases and fast reactivity.28 However, this technique has some of major drawbacks such as high solvent regeneration cost, low CO2 loading capacity and high equipment corrosion rate.29 In recent years, calcium oxide based adsorbents are one of the most promising adsorbents to capture CO2 due to their high adsorption capacity (0.786 g-CO2/g-adsorbent), wide availability in natural minerals (e.g. limestone and dolomite) and reversible carbonation–calcination reaction.27 However, the main disadvantage of using CaO adsorbents is the rapid decay in adsorbent performance during multiple cycles because of sintering during every calcination step.30 In general, the carbonation conversion of the CaO adsorbent derived from limestone is about 80% for the initial cycle and sharply drops to about 25% after 10 cycles.31,32 Therefore, thermal precalcination,33 modification34 and steam hydration35 of limestones and synthetic CaO-based adsorbents36–39 have been proposed to improve the CO2 adsorption performance.

Herein, we firstly report a 3D hierarchical calcite CaCO3 hollow microspherical adsorbent composed of one-dimensional (1D) spike-shaped nanorods for CO2 capture synthesized by a sol–gel hydrothermal method. The effects of NaOH concentration on the structural properties as well as CO2 adsorption performance of synthesized adsorbents were studied in detail. The experimental results indicated that the 3D hierarchical calcite CaCO3 hollow microspherical adsorbent composed of one-dimensional (1D) spike-shaped nanorods could be obtained at 2 M NaOH concentration using hydrothermal reaction. This novel structure exhibited higher carbonation conversion of 45% after 15 cycles, which was about 22% higher than that of other adsorbents synthesized with 6 and 10 M NaOH concentration and limestone.

2. Materials and methods

2.1 Sol–gel hydrothermal synthesis

All reagents used were of analytical grade and were used without further purification. First, dry gel was prepared by the sol–gel method. An equal molar ratio (1[thin space (1/6-em)]:[thin space (1/6-em)]1) of calcium nitrate tetrahydrate (Ca(NO3)2·4H2O, R&M chemical) and citric acid monohydrate (C6H8O7·H2O, Merck) was dissolved in 100 ml distilled water. The solution was evaporated by heating at 80 °C on a hot plate with vigorous stirring for 5 h. As water evaporated, the solution became viscous and finally formed a very viscous pale yellow gel. The obtained viscous gel was then dried overnight in an oven at 140 °C.40,41 After which, 2 g of dry gel was dissolved into a 2 M NaOH solution and the mixture was stirred for 30 min. Then the stirred mixture was placed in a Teflon-lined stainless-steel autoclave. Hydrothermal reaction was conducted at 170 °C for 16 h. After the hydrothermal reaction, the precipitates were centrifuged, washed several times with distilled water and ethanol, and then dried in an oven at 70 °C for 24 h to obtain the final adsorbent. To investigate the effects of NaOH concentration on the structural properties and CO2 adsorption capacities, experiments with 6 and 10 M NaOH concentration were carried out under similar conditions. For further comparison, commercial limestone (CaCO3) from Malaysia was used in this study.

2.2 Characterization

The crystal structures of the as-synthesized adsorbents were characterized by X-ray diffraction (XRD) using a Rigaku X-ray diffractometer with Cu Kα1 radiation (λ = 0.154056 nm); the working current and voltage were 20 mA and 40 kV, respectively. The surface morphology of the adsorbents was observed under a S-4700 (Hitachi) field-emission scanning electron microscope (FESEM). The resulting CaCO3 hollow spheres were crosscut using an argon ion beam (cross section polisher (CP) SM-09010, JEOL) and the cross sectional FESEM images were obtained using a S-4700 (Hitachi, FESEM). The samples were coated with a thin layer of platinum to avoid sample charge up before FESEM analysis. The presence of the functional groups (CO32−, OH) was determined using a JASCO FT/IR-6100 FV Fourier-transform infrared spectroscopy (FTIR) over the region of 400–4000 cm−1 with the KBr pellet technique having spectral resolution of 4 cm−1. A thermogravimetry-differential thermal analysis (TG-DTA) was carried out using a Rigaku TG-DTA. The adsorbents were placed in a platinum crucible and heated at the rate of 10 °C min−1 up to 900 °C, under N2 purge at a flow rate of 40 ml min−1. Al2O3 was used as reference material. The pore structure parameters of the adsorbents were determined from nitrogen adsorption–desorption isotherms using the Quantachrome (Autosorb-1-MP) instrument and the Brunauer–Emmett–Teller (BET) method was used for surface area calculation.

2.3 CO2 carbonation–calcination performances

To measure the CO2 adsorption, a Rigaku thermogravimetry-differential thermal analysis (TG-DTA) apparatus with Thermoplus 2 software was used. Carbonation–calcination processes were performed at 800 °C. A small amount of the adsorbent (∼6.5 mg) was placed in a platinum crucible and was heated from room temperature to 800 °C at a heating rate of 10 °C min−1 under 100% N2 gas flow and atmospheric pressure, and then the temperature was held for 6 min to achieve complete decomposition. Subsequently, carbonation performance was carried out for 30 min under 100% CO2 gas flow. After the 30 min carbonation process, 100% N2 gas was flowed for 6 min to calcine the carbonated adsorbent. To investigate the CO2 adsorption capacity and cyclic stability of the adsorbents, the carbonation–calcination performance was repeated for multiple cycles. The constant flow rate for CO2 and N2 gas was 40 ml min−1. The CO2 adsorption capacity and CO2 conversion were calculated using the following equations;
 
image file: c4ra14355h-t1.tif(1)
 
image file: c4ra14355h-t2.tif(2)
where C is the CO2 adsorption capacity, XN is the carbonation conversion, WN is the weight (%) of the carbonated adsorbents after N cycle(s), WI is the initial weight (%) of the calcined adsorbents, MCaO and MCO2 are molar masses of CaO and CO2, respectively.

3. Results and discussion

3.1 Structure and morphology

Fig. 1(a) shows the X-ray diffraction (XRD) pattern of hierarchical CaCO3 hollow microspherical adsorbent with a rhombohedral phase calcite (JCPDS-05-0586) with R[3 with combining macron]c(167) space group.42 No diffraction peaks related to other impurities was detected. The peak at 2θ = 29.40°, assigned to the (104) plane showed the strongest diffraction which could be assumed that CaCO3 grows mainly along the (104) plane, which was in agreement with the XRD pattern of limestone, common CaCO3 (Fig. S1 (ESI)). Obviously, highly crystallized CaCO3 crystals could be observed under mild hydrothermal condition without calcination at high temperature. The crystallite size calculated using Scherrer equation (D = 0.9λ/β[thin space (1/6-em)]cos[thin space (1/6-em)]θ) was 76.75 nm.
image file: c4ra14355h-f1.tif
Fig. 1 XRD patterns of microstructured CaO-based adsorbents.

Fig. S2 (ESI) shows the FTIR spectrum of the hierarchical calcite CaCO3 hollow microspheres. The characteristic bands of calcite CaCO3 at 711, 874 and 1423 cm−1 could be observed in Fig. S2 (ESI).43 The broad band observed at 3456 cm−1 corresponded to the stretching vibration mode of O–H bond and due to the absorbed water on the surface of the 1D spike-shaped nanorods. The strong and wide band at 1423 cm−1 attributed to the asymmetric stretching vibration of the C–O bond while the sharp bands at 874 and 711 cm−1 corresponded to the in-plane and out-of-plane bending modes of CO32−, respectively.42

Fig. 2(a) shows the FESEM image of hierarchical calcite CaCO3 hollow microsphere with an average diameter of 3.3 μm composed of an array of spike-shaped CaCO3 nanorods. The nanorods have grown radially on the surface of the sphere. Fig. 2(b) shows the cross sectional FESEM image of the CaCO3 hollow sphere with an average inner cavity of 2 μm. The inner part of hollow structures was found to comprise particles with several nanometers. The shell thickness of the CaCO3 hollow sphere was about 0.5 μm. Additional detail high magnification structural features are shown in Fig. 2(c). The spike-shaped CaCO3 nanorods had a root size of 110–150 nm and a tip size of 50–70 nm with an average length of 500 nm. The average atomic percentage (at%) of the elements in the CaCO3 hollow spheres was determined using EDX analysis. The EDX spectrum (Fig. S3 (ESI)) proved that the composition of the hierarchical hollow microsphere adsorbent was pure CaCO3. The pure CaCO3 hollow spheres were composed of 19.96 at% Ca, 27.71 at% C, and 52.33 at% C. The Pt peaks in the EDX spectrum was due to the plated platinum. The FESEM image of the commercial limestone (CaCO3) was shown in Fig. S4 (ESI).


image file: c4ra14355h-f2.tif
Fig. 2 FESEM images of microstructured CaO-based adsorbents: (a) microsphere (b) cross sectional and (c) higher magnification images of 3D hierarchical CaCO3 hollow microspherical adsorbent composed of 1D spike-shaped nanorods, (d) hexagonal and rectangular-shaped Ca(OH)2 and (e) plate-shaped CaC2O4·H2O adsorbents.

Fig. 3 shows the trimodal pore size distribution of hierarchical calcite CaCO3 hollow microspherical adsorbent. The first pore size peak was 1.70 nm, which corresponded to the micro-pores, while pore sizes of 3.07 and 5.65 nm corresponded to meso-pores. The N2-adsorption–desorption isotherm of the hierarchical CaCO3 hollow spheres (inset figure) was classified as type II isotherm (no plateau at high P/Po) according to the International Union of Pure and Applied Chemistry (IUPAC) classification.44–46 The BET surface area of the CaCO3 hollow microspheres was 44.85 m2 g−1, which was higher than that of the commercial limestone (1.38 m2 g−1) and others CaCO3 adsorbents reported in literature such as CaCO3 nanopod (10.40 m2 g−1),37 commercial microsized CaCO3 (12.40 m2 g−1) and nanosized CaCO3 (17.00 m2 g−1).47 High surface area has been reported to enhance the CO2 adsorption capacity and cyclic stability of the adsorbent.48 The larger BET surface area (44.85 m2 g−1) together with the micro-pore and meso-pore size distributions suggested that as-synthesized calcite CaCO3 hollow spheres would exhibit good CO2 adsorption capacity.


image file: c4ra14355h-f3.tif
Fig. 3 Pore size distribution and N2-adsorption–desorption isotherm (inset) of 3D hierarchical CaCO3 hollow microspherical adsorbent composed of 1D spike-shaped nanorods.

Thermal analysis was carried out to investigate the thermal decomposition temperature of the CaCO3 adsorbent. The TG and DTA curves of the CaCO3 hollow microspheres are shown in Fig. S5 (ESI). The wide endothermic peak at 779 °C, which coincided with the TG weight loss in the temperature range of 715–795 °C, represented the thermal decomposition of CaCO3 into CaO. Based on this data, the calcination temperature of the hierarchical calcite CaCO3 hollow spheres for multiple cycles were fixed at 800 °C. Results will be discussed in the later section.

3.2 Effect of NaOH concentration

The NaOH concentration was increased from 2 M to 6 and 10 M to investigate the effects of NaOH concentration on the structural properties and CO2 adsorption performances. As discussed previously, using 2 M NaOH resulted in CaCO3. With increased concentration to 6 M NaOH, Ca(OH)2 (calcium hydroxide, JCPDS-78-0315) with a hexagonal phase was observed (Fig. 1(b)). In addition, the presence of minor peaks, which belong to the CaCO3 and CaC2O4·H2O were found. When the concentration of NaOH was further increased to 10 M, a monoclinic phase CaC2O4·H2O (whewellite, JCPDS-20-0231) was obtained (Fig. 1(c)). Some minor peaks at 2θ values of 18.23°, 28.84°, and 34.23° displayed the coexistence of Ca(OH)2 with CaC2O4·H2O. Crystallite sizes and BET surface areas of the synthesized adsorbents are summarized in Table S1 (ESI).

FTIR spectra were recorded to exhibit the chemical groups of each adsorbent with different NaOH concentrations. The characteristic band of Ca(OH)2 could be seen at 3643 cm−1 which represented the O–H stretching mode (Fig. S6(a) (ESI)).49 Moreover, the bands at 781, 1318, and 1623 cm−1 as well as 874, 1428 cm−1, proved that CaC2O4·H2O and CaCO3 coexist, respectively. In Fig. S6 (ESI), the sharp band at 1318 cm−1 and the strong band at 1618 cm−1 attributed to symmetric metal-carboxylate and antisymmetric carbonyl stretching C[double bond, length as m-dash]O modes, which corresponded to the characteristic bands of CaC2O4·H2O.50,51 In Fig. S6(b) (ESI), the weak band at 3642 cm−1 signified the existence of Ca(OH)2. In summary, the FTIR spectra are in agreement with the XRD patterns.

The morphology and size of the adsorbents were examined using FESEM. Fig. 2(d) and (e) show the representative FESEM images of the synthesized adsorbents with 6 and 10 M NaOH. Notably, different NaOH concentrations led to the formation of different morphologies. As shown in Fig. 2(d), hexagonal-shaped microstructures with an average size of 1.6 μm and rectangular-shaped microstructures with the length of 1–1.3 μm and the width range from 0.6 to 1 μm were obtained at 6 M NaOH. Fig. 2(e) shows the morphology of the adsorbent obtained at 10 M NaOH. The microplates adsorbent with the length of 2–2.5 μm and the width range from 0.7–1.2 μm was formed under this condition. Fig. S7 (ESI) shows the EDX spectra of the Ca(OH)2 and CaC2O4·H2O adsorbents. EDX results identified that the composition of the adsorbents was Ca, C and O. For Ca(OH)2 adsorbent Fig. S7(a) (ESI), the C peak at 0.27 keV could be attributed to the content of CaCO3 and CaC2O4·H2O.

The TG-DTA curves of the Ca(OH)2 and CaC2O4·H2O adsorbents synthesized with 6 and 10 M NaOH are shown in Fig. S8 (ESI). Weight losses in the TG curves occurred in three stages (Fig. S8(a) and (b) (ESI)). However, different adsorbents (Ca(OH)2 and CaC2O4·H2O) resulted to different weight losses. This might be due to the different amounts of H2O, CO, and CO2 in the adsorbents. The first stage of weight loss (100–160 °C) in Fig. S8(a) (ESI) represented the evolution of water molecule from the small amount of CaC2O4·H2O phase present in the adsorbent. The second weight loss in the temperature range (370–440 °C) represented the dehydroxylation of Ca(OH)2.52,53 The final weight loss (560–700 °C) was related to the thermal decomposition of the content of CaCO3 in the Ca(OH)2 adsorbent. In Fig. S8(b) (ESI), the first stage of significant weight loss (100–190 °C) corresponded to the removal of water molecule from CaC2O4·H2O (CaC2O4·H2O to CaC2O4). The second stage (390–510 °C) was related to the evolution of carbon monoxide (CaC2O4 to CaCO3) and the final weight loss (770–830 °C) could be attributed to the liberation of CO2 (CaCO3 to CaO), respectively.54 The TG weight losses (%) of synthesized adsorbents aer listed in Table S2 (ESI). The experimental weight losses were lower than the theoretical value for the adsorbents synthesized at 6 and 10 M, because of the presence of different types of impurity phases in the adsorbents.

In Fig. S8(c) (ESI), the sharp endothermic peak at 423 °C represented the decomposition of Ca(OH)2. Water vapour and carbon dioxide evolved at 140 and 680 °C, which was from the content of CaC2O4·H2O and CaCO3, respectively. In Fig. S8(d) (ESI), a sharp exothermic peak at 494 °C indicated that the oxidation of carbon and carbon monoxide were released from the CaC2O4. The two endothermic peaks at 176 and 817 °C represented the evolution of water molecule from CaC2O4·H2O and the thermal decomposition of CaCO3, respectively.

The morphology and phase evolution of the synthesized adsorbents as a function of NaOH concentration based on the aforementioned results are presented in Fig. 4. Firstly, in the sol–gel process, the citrate anion (C6H5O7)3− is presumed to combine with the calcium ion Ca2+ to form calcium–citric acid chelate complexes during the gelation of sol. Afterwards, the dry gel was dissolved by adding different concentrations of NaOH solution. In this process, some of the OH ions in the solution might neutralize the H+ ions derived from the citric acid, while other OH ions might react with the Ca2+ citric acid chelate complexes. During the hydrothermal reaction, decomposition of citric acid would take place and subsequently produce carbonate ions CO32− in the aqueous solution. Therefore, at a low concentration of NaOH (2 M), three different ionic species (Ca2+, OH and CO32−) were available as reactants. At these conditions, Ca2+ citric acid chelate complexes would preferably react with CO32− to form CaCO3 because the free energy formation of CaCO3 are −1129.1, which is lower than that of calcium hydroxide (−897.5). Once the entire CO32− ions were consumed for the formation of CaCO3, the rest of the Ca2+ in the citric acid chelate complexes would react with OH to form Ca(OH)2. This may represent the results obtained at 6 M which showed that the as-prepared particles were dominantly Ca(OH)2.


image file: c4ra14355h-f4.tif
Fig. 4 A schematic diagram of the morphology and phase evolution of the synthesized adsorbents as a function of NaOH concentration.

As the number of nanoparticles increased, the total surface energy of the nanoparticles in the solution increased accordingly, and the Ca(OH)2 nanoparticles aggregated to form the hexagonal and rectangular shaped microstructures. When the concentration of NaOH was increased to 10 M, high excess of OH ions would react with Ca2+ citric acid chelate complexes in the solution to form the CaC2O4·H2O nanoparticles. The CaC2O4·H2O nanoparticles would then grow into the irregular nanoplates in the solution through oriented aggregation.55 The irregular nanoplates coalesced with each other through side-by-side means to enlarge the planar area thus forming microplates.

3.3 CO2 adsorption analysis

To investigate the effect of temperature on the carbonation of CaCO3 hollow microspheres adsorbent, a set of experiment was conducted at temperature ranging from 600 to 800 °C (Fig. 5). It could be seen that the curves evolved into a plateau stage within 6 min after the carbonation started and the adsorbent achieved over 80% weight gain. The results showed that the CaCO3 hollow microspheres possessed high carbonation rate, which offered a great chance for this adsorbent in practical application. The fast carbonation could be attributed to the larger BET surface area, micro-pore and meso-pore size distributions of the CaCO3 hollow microspherical adsorbent. After 30 min carbonation, the maximum weight gain of the adsorbent at 600, 700 and 800 °C were 84%, 86% and 89%, respectively. It was observed that the maximum weight gain of the CaCO3 adsorbent increased with increasing the carbonation temperature. At 800 °C, the carbonation reaction proceeded quickly.
image file: c4ra14355h-f5.tif
Fig. 5 Effect of temperature on the carbonation of 3D hierarchical CaCO3 hollow microspherical adsorbent composed of 1D spike-shaped nanorods.

In this study, the carbonation and calcination reactions were carried out at the same temperature (800 °C) in order to avoid the repetitive heating and cooling of the adsorbents between cyclic operations which in turn resulted to reduce the effect of the thermal stress on the adsorbents.48,56 Sun et al.57 and Lysikov et al.38 reported that the carbonation processes carried out at long carbonation time (up to 30 min) exhibited substantially higher residual conversions than the processes performed at short carbonation time (less than 10 min). In contrast, the effect of calcination time (3–60 min) was only visible for first few cycles and it became modest when the number of cycles was increased.32,38 In this experiment, 30 min was selected to perform carbonation reaction to attain substantially higher residual conversions and the calcination time was fixed for 6 min to reduce sintering of the adsorbents for multiple cycles.

Fig. 6 shows the profiles of 29 consecutive carbonation–calcination cycles of the calcite CaCO3 hollow microspherical adsorbent in percentage weight. The weight gain dropped from 89% of first cycle to 71% after 29 cycles. The detail of the carbonation–calcination profile for 30 and 6 min could be described by eqn (3) to (5), respectively. When the as-synthesized CaCO3 adsorbent was heated from room temperature to 800 °C under 100% N2 gas, the thermal decomposition of CaCO3 adsorbent was observed, as expressed in eqn (3). Then, the temperature was maintained at 800 °C for 6 min to ensure complete decomposition of CaCO3. After that, the reaction atmosphere was switched to a 100% CO2, the carbonation reaction of CaO took place (eqn (4)) to form the carbonated CaCO3. This step was followed by the calcination reaction (eqn (5)) whereby the carbonated CaCO3 converted to CaO under 100% N2 gas.

 
image file: c4ra14355h-t3.tif(3)
 
image file: c4ra14355h-t4.tif(4)
 
image file: c4ra14355h-t5.tif(5)


image file: c4ra14355h-f6.tif
Fig. 6 Weight change associated with 29 carbonation–calcination cycles of 3D hierarchical CaCO3 hollow microspherical adsorbent composed of 1D spike-shaped nanorods.

The carbonation conversion of the CaCO3 adsorbent for multiple cycles is shown in Fig. S9 (ESI). Notably, the maximum conversion of 79% was achieved after 30 min carbonation in the 1st cycle compared with 38% following the 29th cycle. The carbonation reaction appeared in the two-stages. The initial reaction (chemical controlled reaction) stage was completed within the first 2 min due to the rapid surface reaction between CO2 and CaO to form the CaCO3 product layer covering the CaO core.58 The higher conversion in the first cycle was due to the extent of conversion attained during the chemical controlled reaction stage. In the second stage (diffusion controlled reaction, 2–30 min), CO2 diffused through a layer of nascent CaCO3 to react with the unconverted CaO core.59 A sharp decay in the carbonation conversion occurred during the first five cycles and thereafter became sluggish. The former condition was due to the loss of pore volume of the adsorbent whereas the latter condition was caused by the sintering effect.60 On the other hand, the increase in grain size61 and the collapse of morphology during multiple cycles also affected the degradation of the adsorbent62 and would be discussed by FESEM images.

Fig. 7 shows the selected carbonation conversion curves (1st and 15th cycle) of the synthesized CaCO3, Ca(OH)2, CaC2O4·H2O adsorbents and commercial limestone. For the initial stage (chemical controlled reaction), the conversion of the hollow sphere CaCO3 adsorbent completed about 67% while Ca(OH)2, CaC2O4·H2O and limestone attained about 60%, 55% and 65%, respectively. The CaCO3, CaC2O4·H2O adsorbents and limestone completed the initial stage within 2 min, however the Ca(OH)2 adsorbent completed around 3 min. After this stage, the carbonation conversion increased relatively slow with time. Notably, the increase in conversion of CaCO3, CaC2O4·H2O adsorbents and limestone were about 12% in the second stage (diffusion controlled reaction), however, the conversion for Ca(OH)2 adsorbent increased to about 30%. After 30 min carbonation, the carbonation conversion achieved 79%, 94%, 68% and 77% for CaCO3, Ca(OH)2, CaC2O4·H2O adsorbents and limestone, respectively.


image file: c4ra14355h-f7.tif
Fig. 7 The 1st and 15th carbonation conversion curves of CaCO3, Ca(OH)2, CaC2O4·H2O adsorbents and limestone.

The difference in carbonation conversion between the adsorbents might be caused by the variance in the nucleation rate of CaCO3.63 The conversion of the adsorbents in the first cycle was ranked as follows: Ca(OH)2 > CaCO3 > limestone > CaC2O4·H2O. However, after the 15th cycle, the ranking of the conversion changed to be CaCO3 > CaC2O4·H2O > limestone > Ca(OH)2. The decaying carbonation conversion of CaCO3, Ca(OH)2, CaC2O4·H2O adsorbents and limestone after multiple cycles were attributed to the growth of crystallite of the CaO particle due to the sintering accompanied by the calcination process. The growth of crystallite results to a decrease in reactive surface area, which consequently decreased the overall reaction rate.64 In addition, the different carbonation conversions of the CaCO3, Ca(OH)2, CaC2O4·H2O adsorbents and limestone could be due to the different morphologies and BET surface areas of the adsorbents. Lu et al.65 and Gupta and Fan36 assumed that the differences in reactivity appeared due to the differences in the adsorbent morphology and not because of a reflection of chemistry of the gas-solid reaction that took place on the CaO surface, as all of the CaO adsorbents which obtained from different precursors showed similar crystal structure.

In this study, the mass of the adsorbents tested in multi cycles TG experiments was not sufficiently high to perform the physisorption analysis. Through the observation with SEM, Lu et at. found that pore volumes and surface areas of the adsorbents were based on their different morphologies, which finally determined their carbonation performances.48 Hence, the FESEM analysis was used to investigate the sintering effect on the morphologies of the adsorbents after multiple carbonation–calcination cycles. As shown in Fig. S10(a) (ESI), the spike-shaped CaCO3 nanorods merged into interconnected networks after 1 cycle, however, the hollow structure still occurred. As shown in Fig. S10(b) (ESI), the hollow structure disappeared after 29 cycles and a noticeable increase in grain size could be observed. The increase in CaO grain size with number of cycles could be affected the CO2 adsorption performance for subsequent cycles.61 The FESEM images in Fig. S10 (ESI) indicated a change in pore structure. After 1 cycle, the adsorbent exhibited small pores (40–70 nm), whereas after 29 cycles, small pores almost disappeared and larger pores (∼700 nm) were observed. The increase in grains size, change in pore structure, the appearance of agglomerates and smooth surface were the typical of the sintering effect, led to the lower surface area,61,67,68 which in turn resulted to a decrease in carbonation conversion of the CaCO3 adsorbent.

Fig. S11 (ESI) shows FESEM images of Ca(OH)2, CaC2O4·H2O and limestone after 15 cycles. As seen in FESEM images, there were two different types of textures on the surface of the Ca(OH)2 and CaC2O4·H2O adsorbents, while the limestone showed cracks in the CaO crystalline structure as reported in literature.69 As shown in Fig. S11(a) and (b) (ESI), one texture was a large number of smaller CaO grains appeared to agglomerate together. The other texture was a compact solid with smooth surface, which covered the agglomerated CaO grains in some area. These two textures might be decreased the CO2 reaction rate because there were very few pores available for gas-solid reaction and CO2 had to penetrate the agglomerated grain during carbonation reaction. The FESEM results demonstrated that Ca(OH)2 and CaC2O4·H2O adsorbents experienced serious sintering effect, which led to obviously reduce the surface area and CO2 adsorption performances.70

The cyclic carbonation conversions of the synthesized adsorbents under different NaOH concentrations are presented in Fig. 8. For comparison purposes, the solid line calculated from a semi-empirical model that was proposed for the decay of the capture capacity by Abanades and Alvarez69 was attached (eqn (6)),

 
XN = fNm(1 − fw) + fw (6)
where XN is the maximum carbonation conversion achieved after N cycles, fm = 0.77 and fw = 0.17. After 15 cycles, the carbonation conversion of CaCO3 hollow microspheres was 45%, which was about 22% higher than the semi-empirical model, CaC2O4·H2O, Ca(OH)2 adsorbents and limestone. In comparison, the residual conversion ∼38% for CaCO3 hollow microspheres after 29 cycles was higher than those of spherical shaped mixed with cubic shaped CaCO3 adsorbent, CaCO3 nanopod, commercial CaCO3 adsorbents and natural limestone reported in literatures as summarized in Table 2.32,37–39,57,66 This finding means that the hierarchical CaCO3 hollow microspheres composed of spike-shaped nanorod adsorbent possessed better anti-sintering performances than others CaO-based adsorbents. This may be attributed to the novel 3D structure, which has larger surface area and the trimodal pore size distribution (micro-pore and meso-pore range). This structure enhanced the performance of the CO2 adsorption for multiple carbonation–calcination cycles and could be the potential adsorbents structure for CO2 capture.


image file: c4ra14355h-f8.tif
Fig. 8 Cyclic carbonation conversions of CaCO3, Ca(OH)2, CaC2O4·H2O adsorbents and limestone.
Table 2 Summary of the carbonation conversions of CaCO3 adsorbents and limestone
Adsorbents Morphology Temperature (°C) Time (min) Cycles (n) Conversion (%) References
Carbonation Calcination Carbonation Calcination
CaCO3 (synthesized) Hollow microsphere 800 800 30 6 29 ∼38 This study
CaCO3 (synthesized) Spherical shaped mixed with cubic shaped 800 800 30 7.5 29 ∼30 38
CaCO3 (synthesized) Porous sphere shaped 650 700 45 30 18 ∼31 39
CaCO3 (synthesized) Nanopod 750 750 20 20 29 ∼30 37
CaCO3 (commercial) 600 700 20 20 29 ∼30 37
CaCO3 (commercial) Nanoparticle 650 850 20 20 29 ∼30 66
Havelock (limestone) 650 850 10 10 29 ∼20 32
Cadomin (limestone) 650 850 10 10 29 ∼20 32
Blanca (limestone) 650 850 10 10 29 ∼20 32
Piasek (limestone) 650 850 10 10 29 ∼20 32
Gotland (limestone) 650 850 10 10 29 <20 32
La Blanca (limestone) 650 850 20 20 29 <20 32
Strassburg (limestone) 850 850 9 8 29 <20 57


4. Conclusions

We successfully synthesized the novel microstructured hierarchical calcite CaCO3 hollow spherical adsorbent composed of spike-shaped nanorods by the sol–gel hydrothermal with varying NaOH concentrations. This is a new proposed approach to prepare 3D hierarchical calcite CaCO3 hollow microspheres without surfactants. The hierarchical CaCO3 hollow microspheres produced at 2 M NaOH exhibited the best CO2 adsorption performances, which was about 22% higher than that of Ca(OH)2 and CaC2O4·H2O adsorbents synthesized with 6 and 10 M NaOH. This is attributed to the 3D hierarchical hollow microsphere structure, 1D spike-shaped nanorod structure, large BET surface area and trimodal pore size distribution. The enhanced performance of the novel morphology indicated that it is a promising adsorbent for CO2 adsorption and a potential candidate for other applications, such as catalysis, filler, coating pigment and anticancer drug carrier.

Acknowledgements

The authors thank the AUN/SEED Net Project under grant no. 304/6050219, RU grant no. 814154, Japan International Cooperation Agency (JICA) and Long Term Research Grant (LRGS) (203/PKT/6723001) from the Ministry of Higher Education (MOHE) Malaysia for their financial support. The authors thank Mr Jon Koki, Technical Department, Center for Advanced Materials Analysis, Tokyo Institute of Technology, for FESEM analysis. The authors also greatly acknowledge the Universiti Sains Malaysia and Tokyo Institute of Technology for the use of their facilities.

Notes and references

  1. X. W. Lou, L. A. Archer and Z. Yang, Adv. Mater., 2008, 20, 3987–4019 CrossRef CAS.
  2. M. Chen, C. Ye, S. Zhou and L. Wu, Adv. Mater., 2013, 25, 5343–5351 CrossRef CAS PubMed.
  3. J. Hu, M. Chen, X. Fang and L. Wu, Chem. Soc. Rev., 2011, 40, 5472–5491 RSC.
  4. H. Dong, Y. Liu, G. Li, X. Wang, D. Xu, Z. Chen, T. Zhang, J. Wang and L. Zhang, Sens. Actuators, B, 2013, 178, 302–309 CrossRef CAS PubMed.
  5. S. Ding and X. Wen Lou, Nanoscale, 2011, 3, 3586–3588 RSC.
  6. S.-D. Jiang, Q.-Z. Yao, G.-T. Zhou and S.-Q. Fu, J. Phys. Chem. C, 2012, 116, 4484–4492 CAS.
  7. A.-M. Cao, J.-S. Hu, H.-P. Liang and L.-J. Wan, Angew. Chem., Int. Ed., 2005, 44, 4391–4395 CrossRef CAS PubMed.
  8. L.-P. Zhu, G.-H. Liao, Y. Yang, H.-M. Xiao, J.-F. Wang and S.-Y. Fu, Nanoscale Res. Lett., 2009, 4, 550–557 CrossRef CAS PubMed.
  9. Z. Sun, T. Liao, K. Liu, L. Jiang, J. H. Kim and S. X. Dou, Nano Res., 2013, 6, 726–735 CrossRef CAS.
  10. Z. Bian, J. Zhu, J. Wang, S. Xiao, C. Nuckolls and H. Li, J. Am. Chem. Soc., 2012, 134, 2325–2331 CrossRef CAS PubMed.
  11. J. B. Fei, Y. Cui, X. H. Yan, W. Qi, Y. Yang, K. W. Wang, Q. He and J. B. Li, Adv. Mater., 2008, 20, 452–456 CrossRef.
  12. X. Guan, L. Li, G. Li, Z. Fu, J. Zheng and T. Yan, J. Alloys Compd., 2011, 509, 3367–3374 CrossRef CAS PubMed.
  13. B. Wang, J. S. Chen, H. B. Wu, Z. Wang and X. W. Lou, J. Am. Chem. Soc., 2011, 133, 17146–17148 CrossRef CAS PubMed.
  14. L. Zhao and J. Wang, Colloids Surf., A, 2012, 393, 139–143 CrossRef CAS PubMed.
  15. W. Dong, H. Cheng, Y. Yao, Y. Zhou, G. Tong, D. Yan, Y. Lai and W. Li, Langmuir, 2010, 27, 366–370 CrossRef PubMed.
  16. M. F. Butler, W. J. Frith, C. Rawlins, A. C. Weaver and M. Heppenstall-Butler, Cryst. Growth Des., 2008, 9, 534–545 Search PubMed.
  17. W. Wei, G.-H. Ma, G. Hu, D. Yu, T. McLeish, Z.-G. Su and Z.-Y. Shen, J. Am. Chem. Soc., 2008, 130, 15808–15810 CrossRef CAS PubMed.
  18. L. Qi, J. Li and J. Ma, Adv. Mater., 2002, 14, 300–303 CrossRef CAS.
  19. T. Enomae and K. Tsujino, Appita J., 2004, 57, 493 Search PubMed.
  20. Y. Guan, X. Meng and D. Qiu, Langmuir, 2014, 30, 3681–3686 CrossRef CAS PubMed.
  21. M. Wan, Adv. Mater., 2008, 20, 2926–2932 CrossRef CAS.
  22. L. Y. Xia, M. Q. Zhang, C. e. Yuan and M. Z. Rong, J. Mater. Chem., 2011, 21, 9020–9026 RSC.
  23. S. P. Gopi, P. Vijaya and V. K. Subramanian, Powder Technol., 2012, 225, 58–64 CrossRef CAS PubMed.
  24. I. Lee, H. Han and S.-Y. Lee, J. Cryst. Growth, 2010, 312, 1741–1746 CrossRef CAS PubMed.
  25. D. Zhao, J. Jiang, J. Xu, L. Yang, T. Song and P. Zhang, Mater. Lett., 2013, 104, 28–30 CrossRef CAS PubMed.
  26. Y. Wang, Y. X. Moo, C. Chen, P. Gunawan and R. Xu, J. Colloid Interface Sci., 2010, 352, 393–400 CrossRef CAS PubMed.
  27. S. Choi, J. H. Drese and C. W. Jones, ChemSusChem, 2009, 2, 796 CrossRef CAS PubMed.
  28. M. Afkhamipour and M. Mofarahi, Int. J. Greenhouse Gas Control, 2014, 25, 9–22 CrossRef CAS PubMed.
  29. C.-H. Yu, C.-H. Huang and C.-S. Tan, Aerosol Air Qual. Res., 2012, 12, 745–769 CAS.
  30. P. Sun, J. R. Grace, C. J. Lim and E. J. Anthony, AIChE J., 2007, 53, 2432–2442 CrossRef CAS.
  31. J. C. Abanades, E. J. Anthony, D. Y. Lu, C. Salvador and D. Alvarez, AIChE J., 2004, 50, 1614–1622 CrossRef CAS.
  32. G. S. Grasa and J. C. Abanades, Ind. Eng. Chem. Res., 2006, 45, 8846–8851 CrossRef CAS.
  33. V. Manovic and E. J. Anthony, Environ. Sci. Technol., 2008, 42, 4170–4174 CrossRef CAS.
  34. Y. J. Li, C. S. Zhao, C. R. Qu, L. B. Duan, Q. Z. Li and C. Liang, Chem. Eng. Technol., 2008, 31, 237–244 CrossRef CAS.
  35. F. Donat, N. H. Florin, E. J. Anthony and P. S. Fennell, Environ. Sci. Technol., 2011, 46, 1262–1269 CrossRef PubMed.
  36. H. Gupta and L.-S. Fan, Ind. Eng. Chem. Res., 2002, 41, 4035–4042 CrossRef CAS.
  37. Z. Yang, M. Zhao, N. H. Florin and A. T. Harris, Ind. Eng. Chem. Res., 2009, 48, 10765–10770 CrossRef CAS.
  38. A. I. Lysikov, A. N. Salanov and A. G. Okunev, Ind. Eng. Chem. Res., 2007, 46, 4633–4638 CrossRef CAS.
  39. S. Wang, L. Fan, C. Li, Y. Zhao and X. Ma, ACS Appl. Mater. Interfaces, 2014, 6, 18072–18077 CAS.
  40. E. T. Santos, C. Alfonsín, A. J. S. Chambel, A. Fernandes, A. P. Soares Dias, C. I. C. Pinheiro and M. F. Ribeiro, Fuel, 2012, 94, 624–628 CrossRef CAS PubMed.
  41. M. Ghiasi and A. Malekzadeh, Cryst. Res. Technol., 2012, 47, 471–478 CrossRef CAS.
  42. S. Gunasekaran, G. Anbalagan and S. Pandi, J. Raman Spectrosc., 2006, 37, 892–899 CrossRef CAS.
  43. X. Yang, H. Meng, T. Li, L. Shi, Y. Li and G. Xu, Powder Technol., 2014, 256, 272–278 CrossRef CAS PubMed.
  44. R. R. Virtudazo, H. Watanabe, T. Shirai, M. Fuji and M. Takahashi, in IOP Conference Series: Materials Science and Engineering, IOP Publishing, 2011, p. 062014 Search PubMed.
  45. K. S. Sing, J. Porous Mater., 1995, 2, 5–8 CrossRef CAS.
  46. K. S. Sing, Pure Appl. Chem., 1985, 57, 603–619 CrossRef CAS.
  47. C. Luo, Q. Shen, N. Ding, Z. Feng, Y. Zheng and C. Zheng, Chem. Eng. Technol., 2012, 35, 547–554 CrossRef CAS.
  48. H. Lu, E. P. Reddy and P. G. Smirniotis, Ind. Eng. Chem. Res., 2006, 45, 3944–3949 CrossRef CAS.
  49. T. Liu, Y. Zhu, X. Zhang, T. Zhang, T. Zhang and X. Li, Mater. Lett., 2010, 64, 2575–2577 CrossRef CAS PubMed.
  50. J.-M. Ouyang, H. Zheng and S.-P. Deng, J. Cryst. Growth, 2006, 293, 118–123 CrossRef CAS PubMed.
  51. I. Petrov and B. Šoptrajanov, Spectrochim. Acta, Part A, 1975, 31, 309–316 CrossRef.
  52. S. J. Palmer, M. K. Smith and R. L. Frost, J. Ind. Eng. Chem., 2011, 17, 56–61 CrossRef CAS PubMed.
  53. S. Chedella and D. Berzins, Int. Endod. J., 2010, 43, 509–518 CrossRef CAS PubMed.
  54. R. L. Frost and M. L. Weier, Thermochim. Acta, 2004, 409, 79–85 CrossRef CAS.
  55. Y. Cheng, Y. Wang, Y. Zheng and Y. Qin, J. Phys. Chem. B, 2005, 109, 11548–11551 CrossRef CAS PubMed.
  56. V. Manovic and E. J. Anthony, Energy Fuels, 2008, 22, 1851–1857 CrossRef CAS.
  57. P. Sun, C. J. Lim and J. R. Grace, AIChE J., 2008, 54, 1668–1677 CrossRef CAS.
  58. T. Witoon, Ceram. Int., 2011, 37, 3291–3298 CrossRef CAS PubMed.
  59. A. Akgsornpeak, T. Witoon, T. Mungcharoen and J. Limtrakul, Chem. Eng. J., 2014, 237, 189–198 CrossRef CAS PubMed.
  60. R. Barker, J. Appl. Chem. Biotechnol., 1974, 24, 221–227 CAS.
  61. Y. Zhu, S. Wu and X. Wang, Chem. Eng. J., 2011, 175, 512–518 CrossRef CAS PubMed.
  62. C. Zhao, Z. Zhou and Z. Cheng, Ind. Eng. Chem. Res., 2014, 53, 14065–14074 CrossRef CAS.
  63. W. Liu, N. W. Low, B. Feng, G. Wang and J. C. Diniz da Costa, Environ. Sci. Technol., 2009, 44, 841–847 CrossRef PubMed.
  64. B. Feng, H. An and E. Tan, Energy Fuels, 2007, 21, 426–434 CrossRef CAS.
  65. H. Lu, A. Khan and P. G. Smirniotis, Ind. Eng. Chem. Res., 2008, 47, 6216–6220 CrossRef CAS.
  66. N. H. Florin and A. T. Harris, Chem. Eng. Sci., 2009, 64, 187–191 CrossRef CAS PubMed.
  67. D. Alvarez and J. C. Abanades, Ind. Eng. Chem. Res., 2005, 44, 5608–5615 CrossRef CAS.
  68. C. Luo, Y. Zheng, N. Ding, Q. Wu, G. Bian and C. Zheng, Ind. Eng. Chem. Res., 2010, 49, 11778–11784 CrossRef CAS.
  69. J. C. Abanades and D. Alvarez, Energy Fuels, 2003, 17, 308–315 CrossRef CAS.
  70. Z.-s. Li, N.-s. Cai and Y.-y. Huang, Ind. Eng. Chem. Res., 2006, 45, 1911–1917 CrossRef CAS.

Footnote

Electronic supplementary information (ESI) available: XRD pattern of limestone, FTIR spectrum, EDX spectrum and TG-DTA curves of 3D hierarchical CaCO3 hollow microspherical adsorbent, FESEM image of the commercial limestone, FTIR spectra, EDX spectra, TG and DTA curves of Ca(OH)2 and CaC2O4·H2O adsorbents, Multi cycles carbonation conversion curves of 3D hierarchical calcite CaCO3 hollow microspherical adsorbent, FESEM images of the adsorbents after multiple cycles, BET surface areas and crystallite sizes of synthesized adsorbents under different NaOH concentrations and TG data of Ca(OH)2 and CaC2O4·H2O adsorbents. See DOI: 10.1039/c4ra14355h

This journal is © The Royal Society of Chemistry 2015
Click here to see how this site uses Cookies. View our privacy policy here.